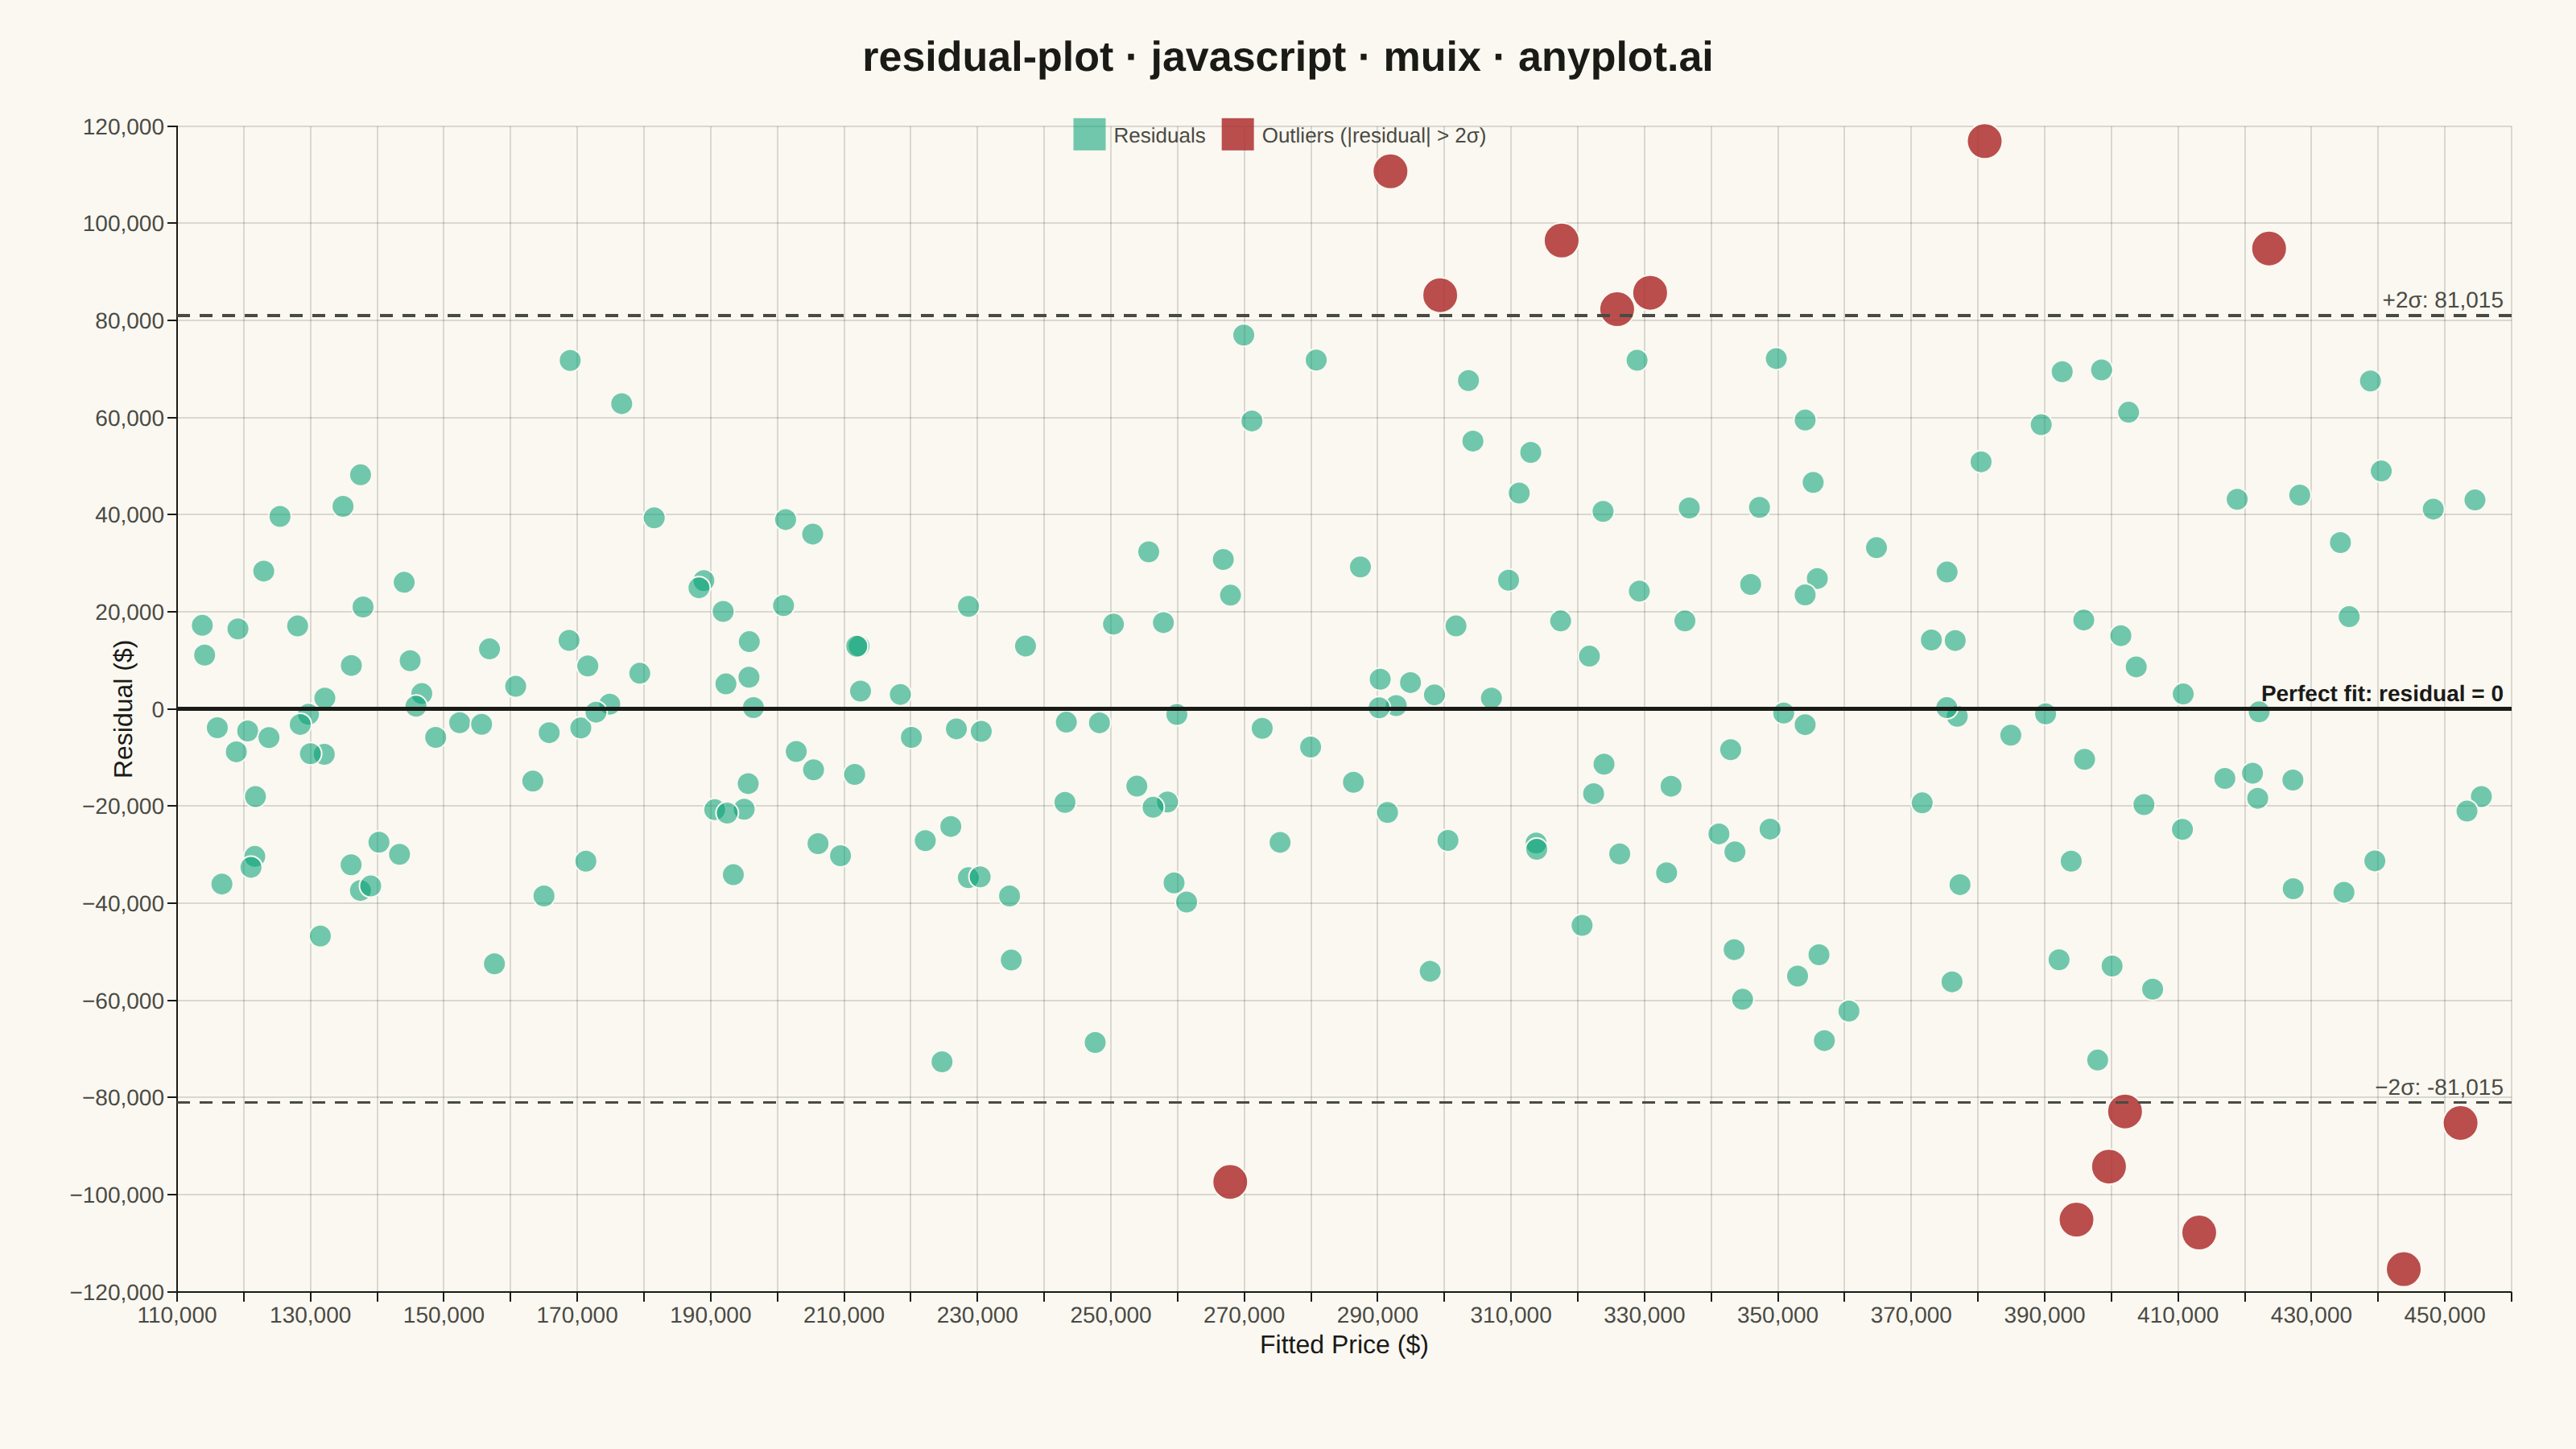
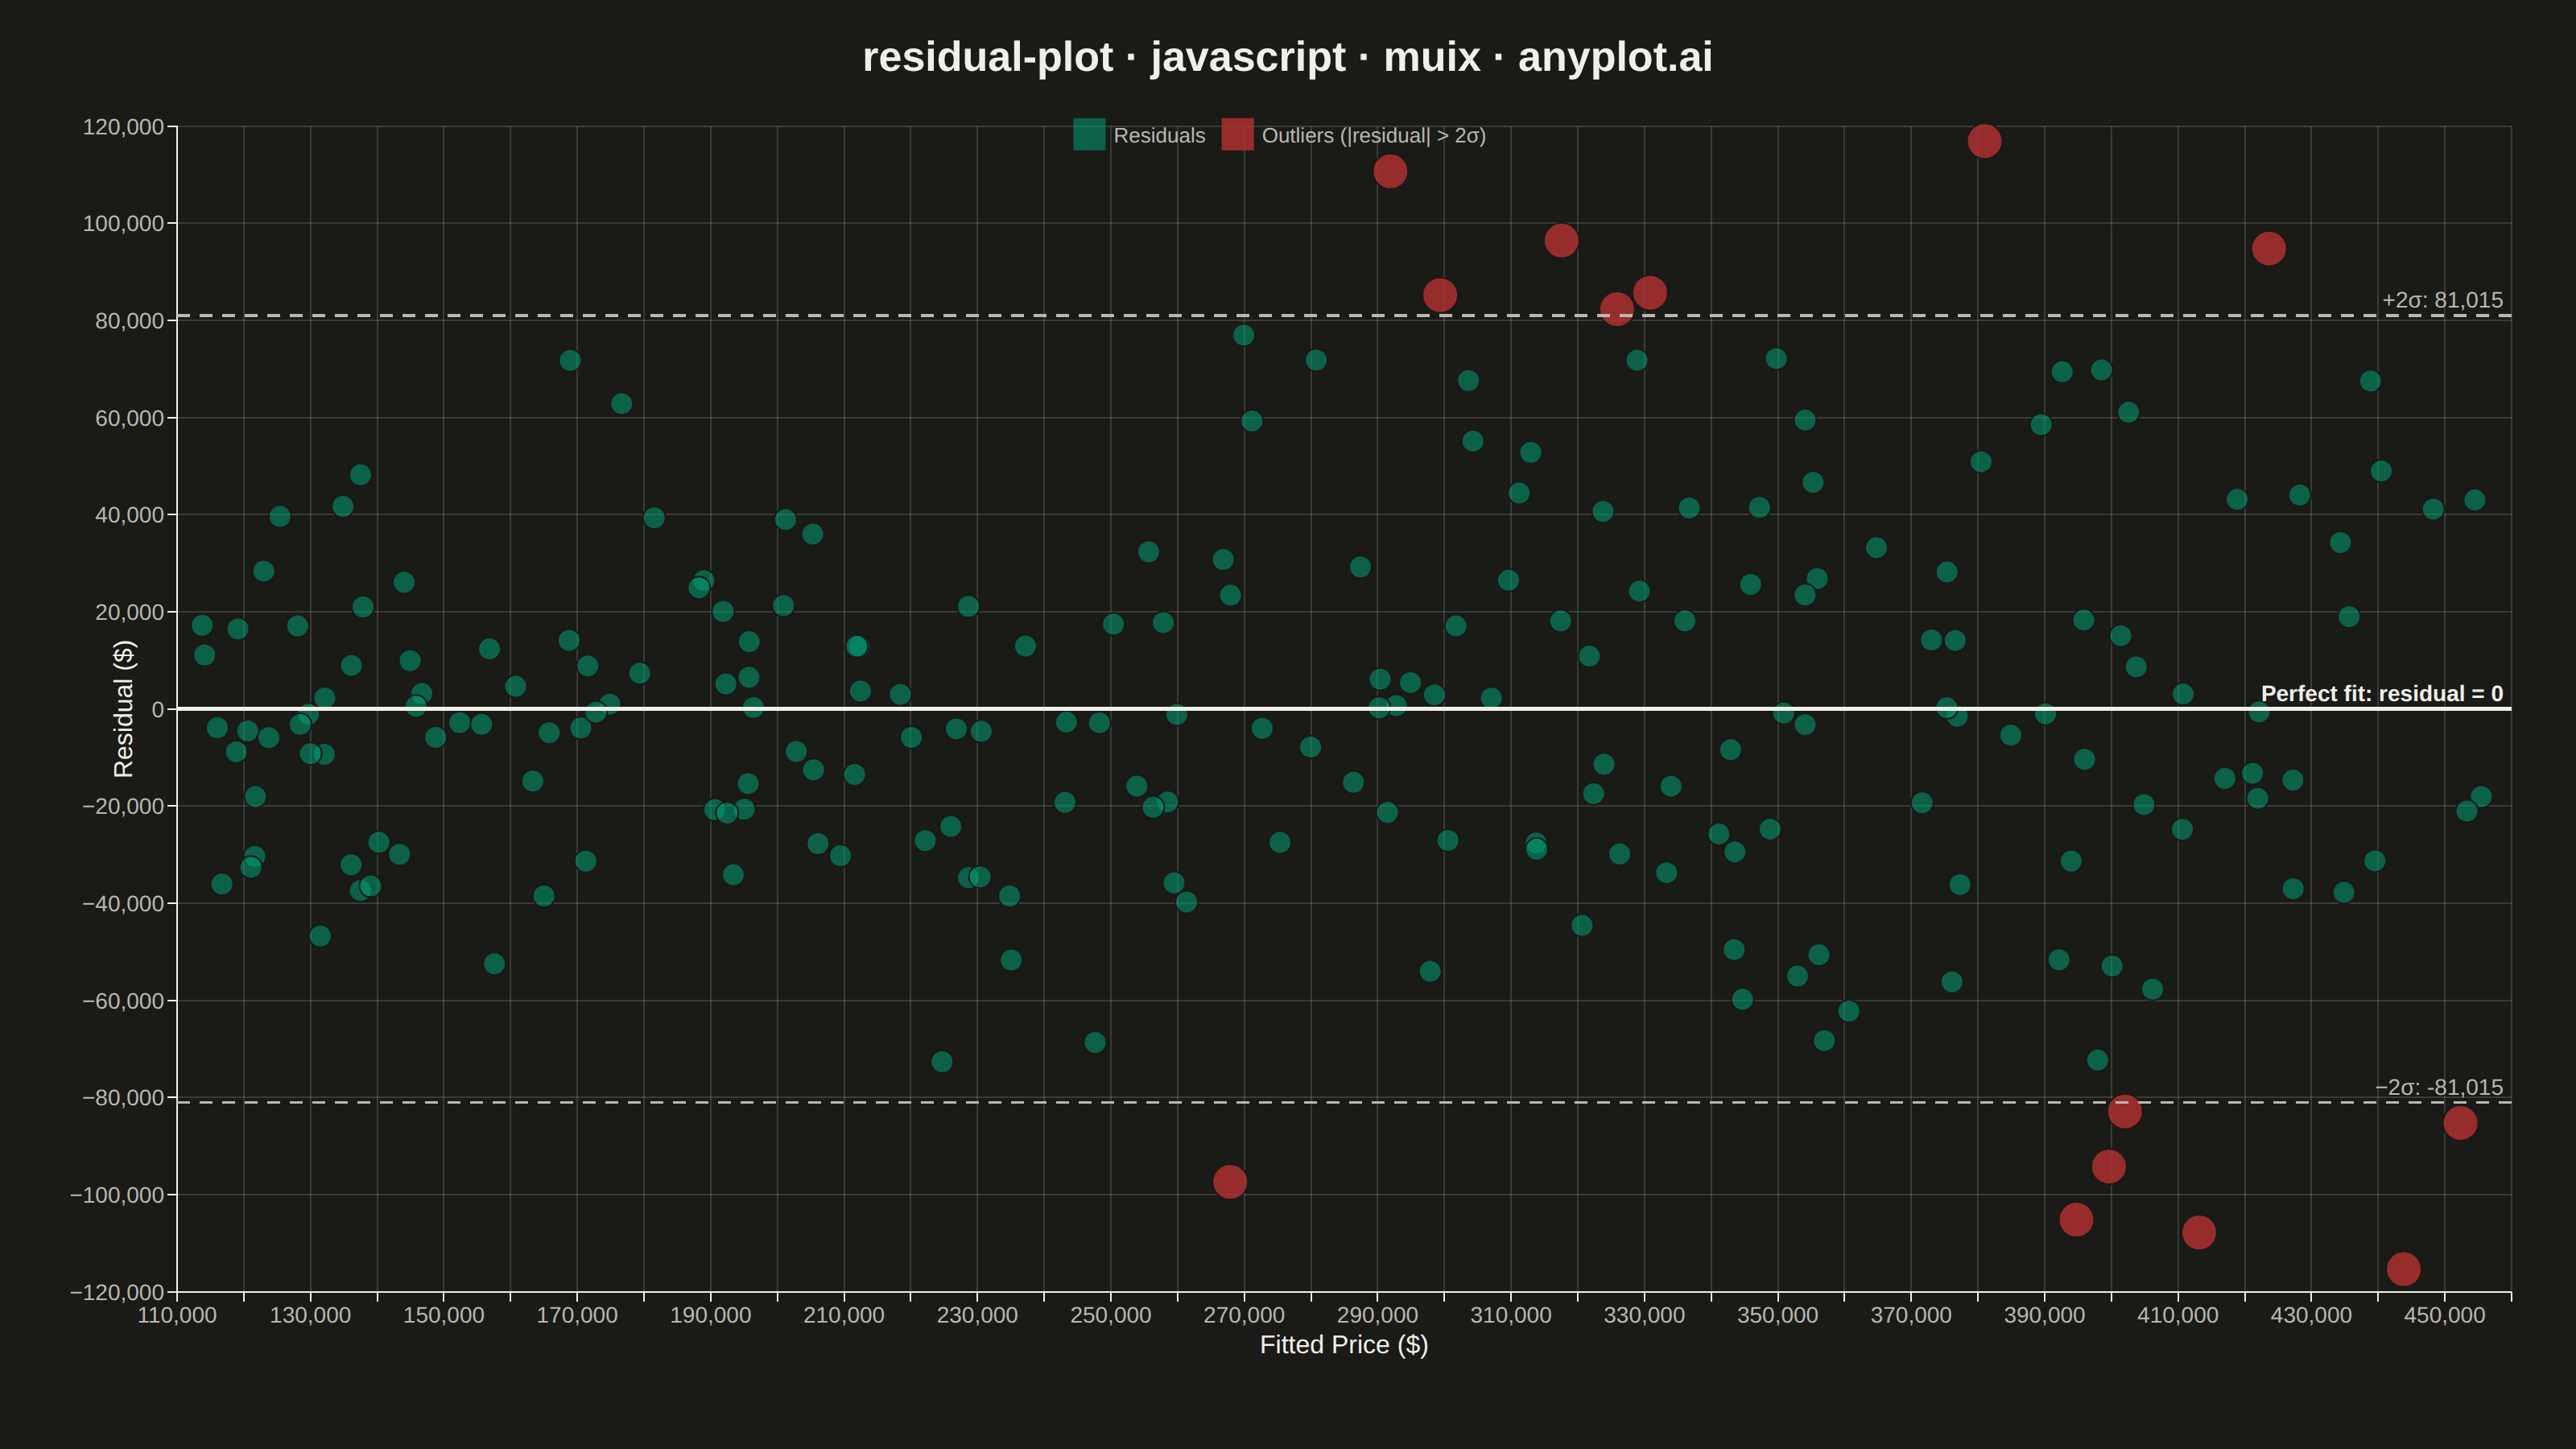
The same plot in 14 other libraries — JavaScript: Chart.js, D3.js, Apache ECharts, Highcharts; Python: Altair, Bokeh, lets-plot, Matplotlib, Plotly, plotnine, Pygal, Seaborn; R: ggplot2; Julia: Makie.jl. Compare all 15 side by side: Residual Plot in Python, R, Julia and JavaScript.
A residual plot displays the difference between observed and predicted values (residuals) against fitted values in regression analysis. This diagnostic visualization helps identify violations of regression assumptions including non-linearity, heteroscedasticity (non-constant variance), and outliers. A well-fitting model shows residuals randomly scattered around zero with no discernible pattern.
// anyplot.ai
// residual-plot: Residual Plot
// Library: muix 7.29.1 | JavaScript 22.23.2
// Quality: 87/100 | Created: 2026-09-05
import { ScatterChart } from "@mui/x-charts/ScatterChart";
import { ChartsReferenceLine } from "@mui/x-charts/ChartsReferenceLine";
import Box from "@mui/material/Box";
import Typography from "@mui/material/Typography";

const t = window.ANYPLOT_TOKENS;

// --- Data (in-memory, deterministic LCG) ------------------------------------
// A simple linear regression predicting house price from square footage, with
// noise that widens for larger homes — a classic heteroscedastic pattern a
// residual plot is designed to surface.
let seed = 42;
function nextRandom() {
  seed = (seed * 1103515245 + 12345) & 0x7fffffff;
  return seed / 0x7fffffff;
}
function gaussian() {
  const u1 = Math.max(nextRandom(), 1e-9);
  const u2 = nextRandom();
  return Math.sqrt(-2 * Math.log(u1)) * Math.cos(2 * Math.PI * u2);
}

const HOME_COUNT = 220;
const squareFootage = Array.from(
  { length: HOME_COUNT },
  () => 600 + nextRandom() * 2900,
);
const housePrices = squareFootage.map((sqft) => {
  const noise = gaussian() * (8000 + sqft * 18);
  return 42000 + sqft * 118 + noise;
});

// Ordinary least squares fit: price = intercept + slope * sqft
const meanSqft = squareFootage.reduce((sum, v) => sum + v, 0) / HOME_COUNT;
const meanPrice = housePrices.reduce((sum, v) => sum + v, 0) / HOME_COUNT;
let covariance = 0;
let variance = 0;
for (let i = 0; i < HOME_COUNT; i++) {
  covariance += (squareFootage[i] - meanSqft) * (housePrices[i] - meanPrice);
  variance += (squareFootage[i] - meanSqft) ** 2;
}
const slope = covariance / variance;
const intercept = meanPrice - slope * meanSqft;

const fittedValues = squareFootage.map((sqft) => intercept + slope * sqft);
const residuals = housePrices.map((price, i) => price - fittedValues[i]);

const residualMean = residuals.reduce((sum, r) => sum + r, 0) / HOME_COUNT;
const residualStd = Math.sqrt(
  residuals.reduce((sum, r) => sum + (r - residualMean) ** 2, 0) /
    (HOME_COUNT - 1),
);
const upperBand = 2 * residualStd;
const lowerBand = -2 * residualStd;

// Points beyond ±2 standard deviations get a semantic-red accent — they are
// the leverage points / outliers a reviewer checks first.
const withinBand = [];
const outliers = [];
fittedValues.forEach((fitted, i) => {
  const residual = residuals[i];
  const point = { x: fitted, y: residual, id: i };
  if (residual > upperBand || residual < lowerBand) {
    outliers.push(point);
  } else {
    withinBand.push(point);
  }
});

const TITLE_HEIGHT = 66;

// --- Chart (default-exported component — the harness mounts it) ------------
export default function Chart() {
  const { width, height } = window.ANYPLOT_SIZE;

  return (
    <Box
      sx={{
        width,
        height,
        display: "flex",
        flexDirection: "column",
        paddingTop: "20px",
      }}
    >
      <Typography
        sx={{
          color: t.ink,
          fontSize: 26,
          fontWeight: 600,
          textAlign: "center",
          lineHeight: 1.2,
        }}
      >
        residual-plot · javascript · muix · anyplot.ai
      </Typography>
      <ScatterChart
        width={width}
        height={height - TITLE_HEIGHT}
        skipAnimation
        series={[
          {
            id: "residuals",
            data: withinBand,
            label: "Residuals",
            markerSize: 7,
            color: "rgba(0, 158, 115, 0.55)",
          },
          {
            id: "outliers",
            data: outliers,
            label: "Outliers (|residual| > 2σ)",
            markerSize: 11,
            color: "rgba(174, 48, 48, 0.85)",
          },
        ]}
        xAxis={[
          {
            label: "Fitted Price ($)",
            labelStyle: { fontSize: 16, fill: t.ink },
            tickLabelStyle: { fontSize: 14, fill: t.inkSoft },
          },
        ]}
        yAxis={[
          {
            label: "Residual ($)",
            labelStyle: { fontSize: 16, fill: t.ink },
            tickLabelStyle: { fontSize: 14, fill: t.inkSoft },
          },
        ]}
        margin={{ left: 110, right: 40, top: 20, bottom: 90 }}
        grid={{ horizontal: true, vertical: true }}
        slotProps={{
          legend: {
            position: { vertical: "top", horizontal: "middle" },
            direction: "row",
            labelStyle: { fontSize: 13, fill: t.inkSoft },
          },
        }}
        sx={{
          "& .MuiChartsGrid-line": { stroke: t.grid, strokeWidth: 1 },
          "& circle": { stroke: t.pageBg, strokeWidth: 1 },
        }}
      >
        <ChartsReferenceLine
          y={0}
          label="Perfect fit: residual = 0"
          labelAlign="end"
          lineStyle={{ stroke: t.ink, strokeWidth: 2.5 }}
          labelStyle={{ fill: t.ink, fontSize: 14, fontWeight: 600 }}
        />
        <ChartsReferenceLine
          y={upperBand}
          label={`+2σ: ${Math.round(upperBand).toLocaleString()}`}
          labelAlign="end"
          lineStyle={{
            stroke: t.inkSoft,
            strokeDasharray: "8 6",
            strokeWidth: 1.75,
          }}
          labelStyle={{ fill: t.inkSoft, fontSize: 14 }}
        />
        <ChartsReferenceLine
          y={lowerBand}
          label={`−2σ: ${Math.round(lowerBand).toLocaleString()}`}
          labelAlign="end"
          lineStyle={{
            stroke: t.inkSoft,
            strokeDasharray: "8 6",
            strokeWidth: 1.75,
          }}
          labelStyle={{ fill: t.inkSoft, fontSize: 14 }}
        />
      </ScatterChart>
    </Box>
  );
}
Runnable source as JSON, for any HTTP client: https://api.anyplot.ai/specs/residual-plot/muix/code. Any spec id and library id listed in llms-full.txt fit the same URL shape; every URL below is complete and callable.
{
  "spec_id": "residual-plot",
  "language": "javascript",
  "library": "muix",
  "page": "https://anyplot.ai/residual-plot/javascript/muix",
  "hub": "https://anyplot.ai/residual-plot",
  "code_json": "https://api.anyplot.ai/specs/residual-plot/muix/code",
  "spec_json": "https://api.anyplot.ai/specs/residual-plot",
  "render_light_png": "https://storage.googleapis.com/anyplot-images/plots/residual-plot/javascript/muix/plot-light.png",
  "render_dark_png": "https://storage.googleapis.com/anyplot-images/plots/residual-plot/javascript/muix/plot-dark.png",
  "interactive_light_html": "https://storage.googleapis.com/anyplot-images/plots/residual-plot/javascript/muix/plot-light.html",
  "interactive_dark_html": "https://storage.googleapis.com/anyplot-images/plots/residual-plot/javascript/muix/plot-dark.html",
  "quality_score": 87.0,
  "license": "MIT",
  "guide": "https://anyplot.ai/llms.txt"
}
Part of Residual Plot on anyplot.ai.