The same plot in 14 other libraries — JavaScript: D3.js, Apache ECharts, Highcharts, MUI X Charts; Python: Altair, Bokeh, lets-plot, Matplotlib, Plotly, plotnine, Pygal, Seaborn; R: ggplot2; Julia: Makie.jl. Compare all 15 side by side: ROC Curve with AUC in Python, R, Julia and JavaScript.
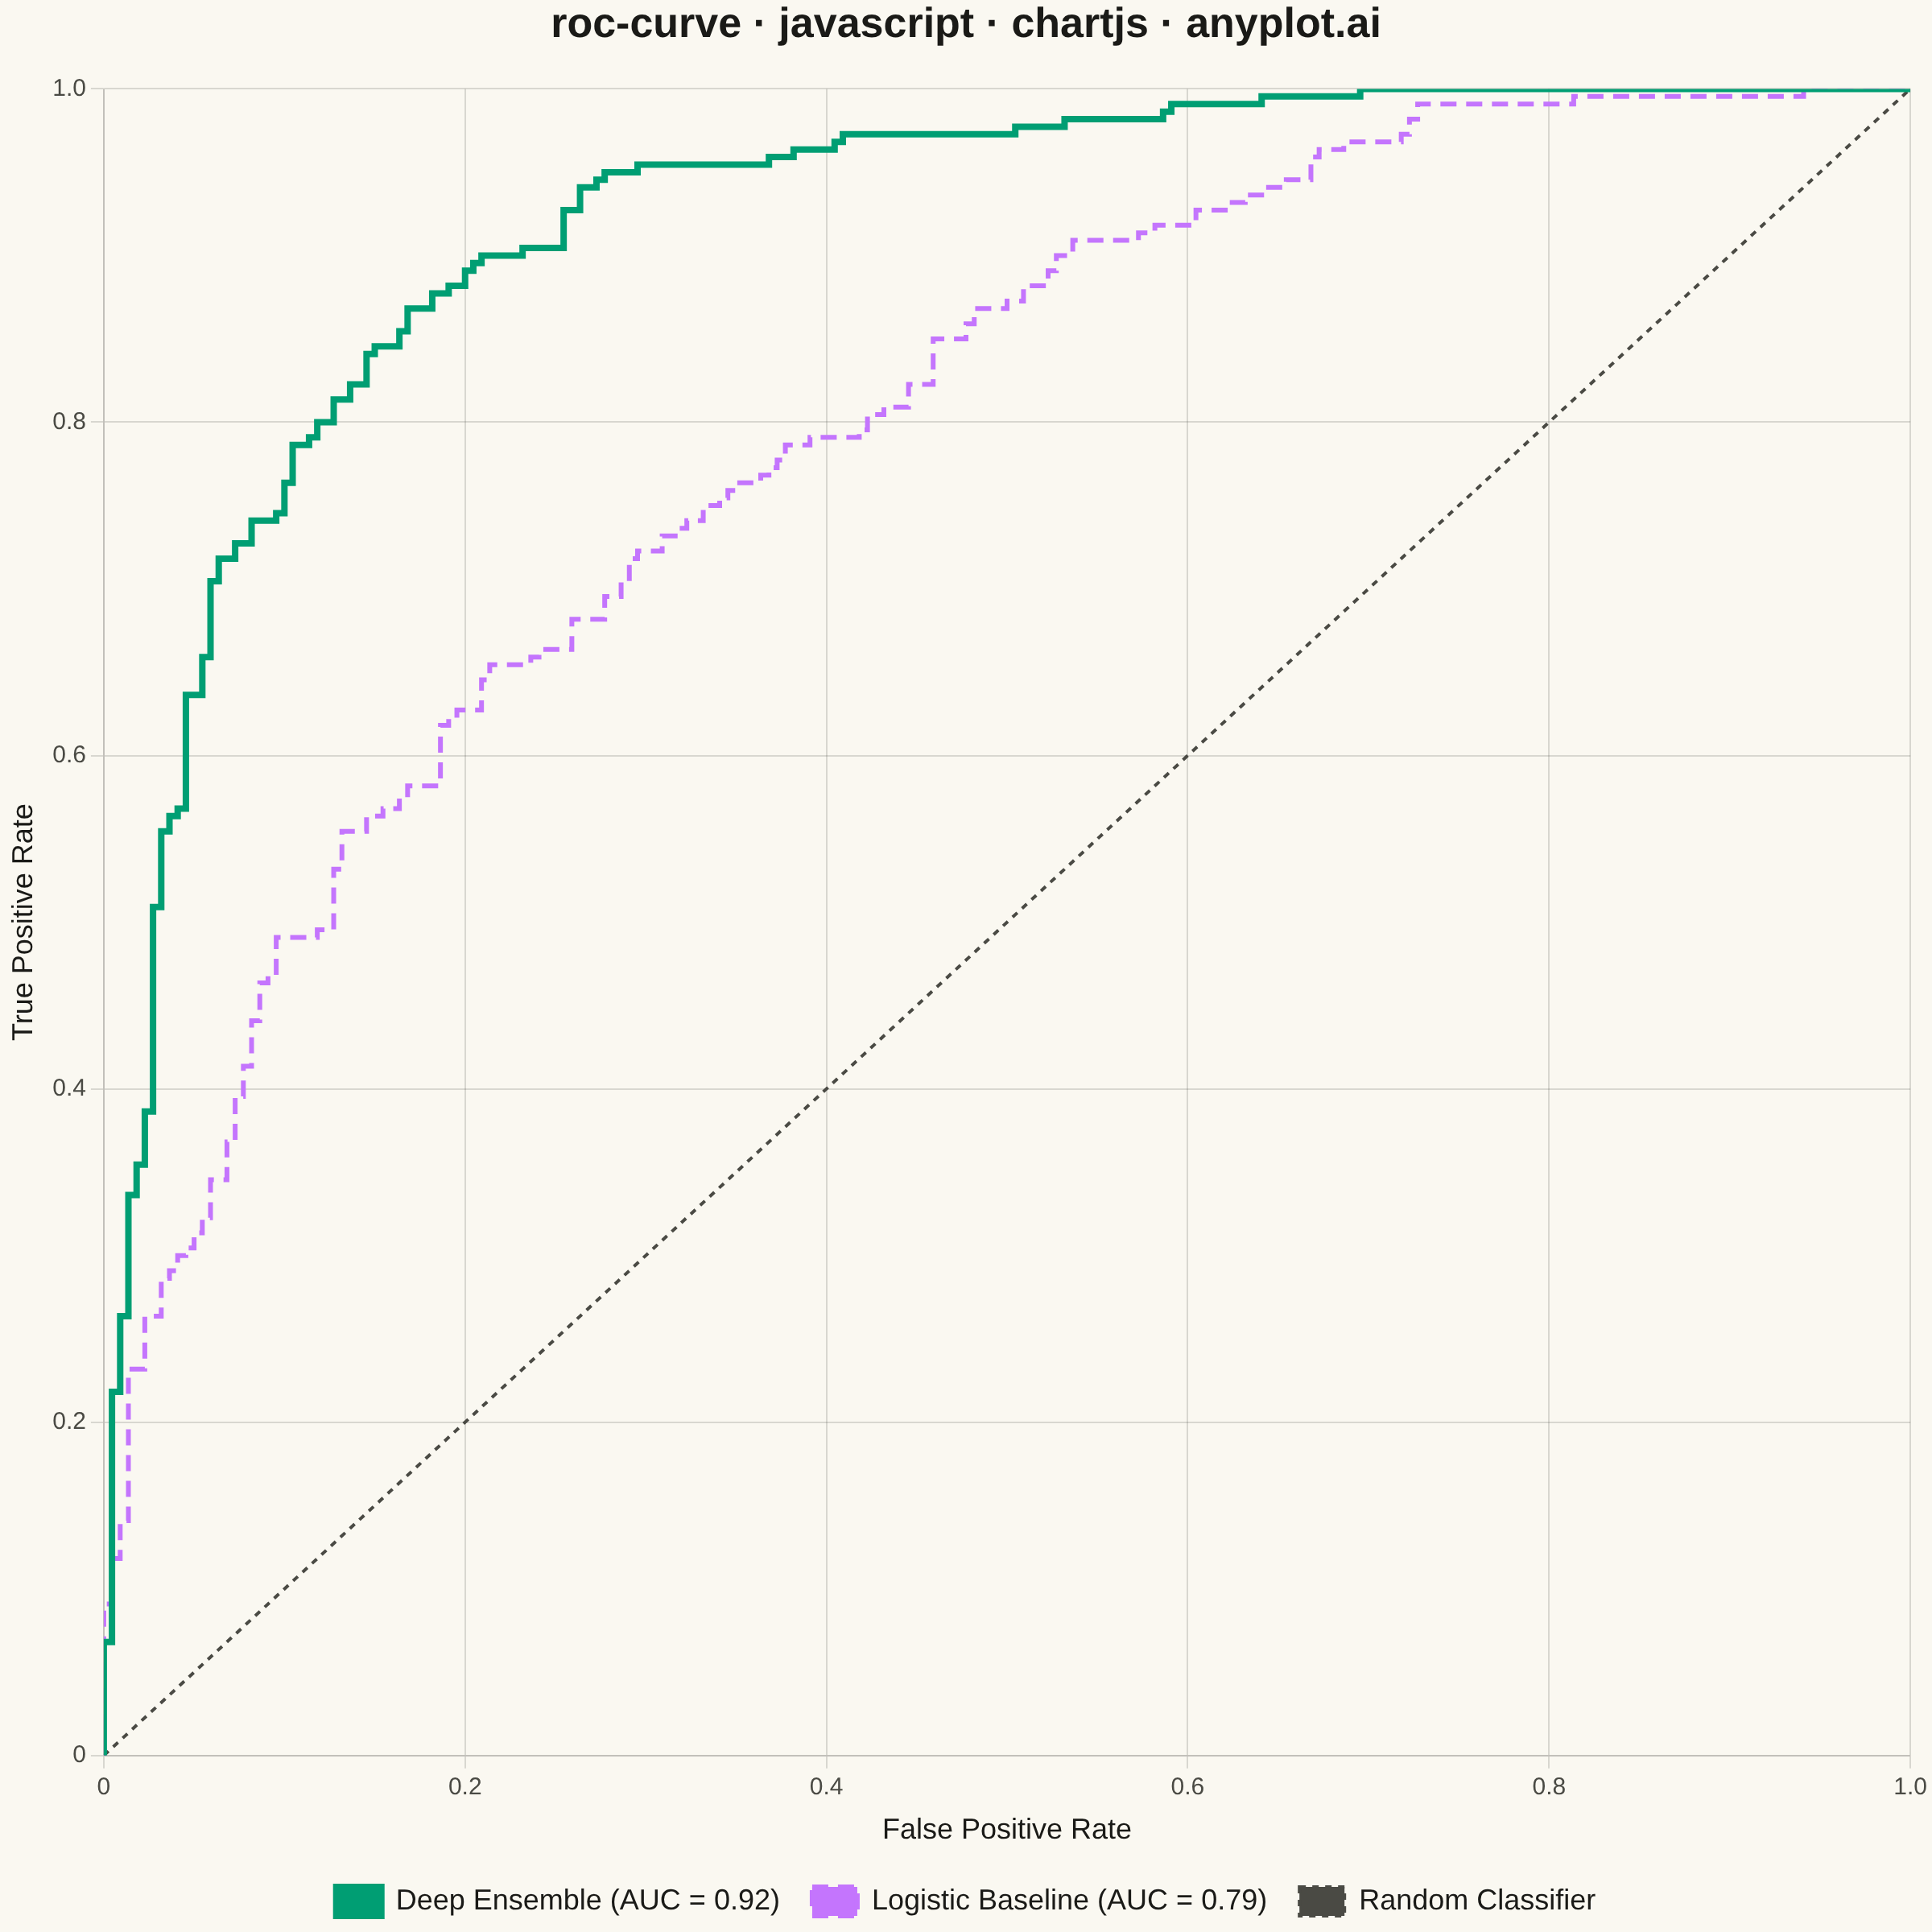
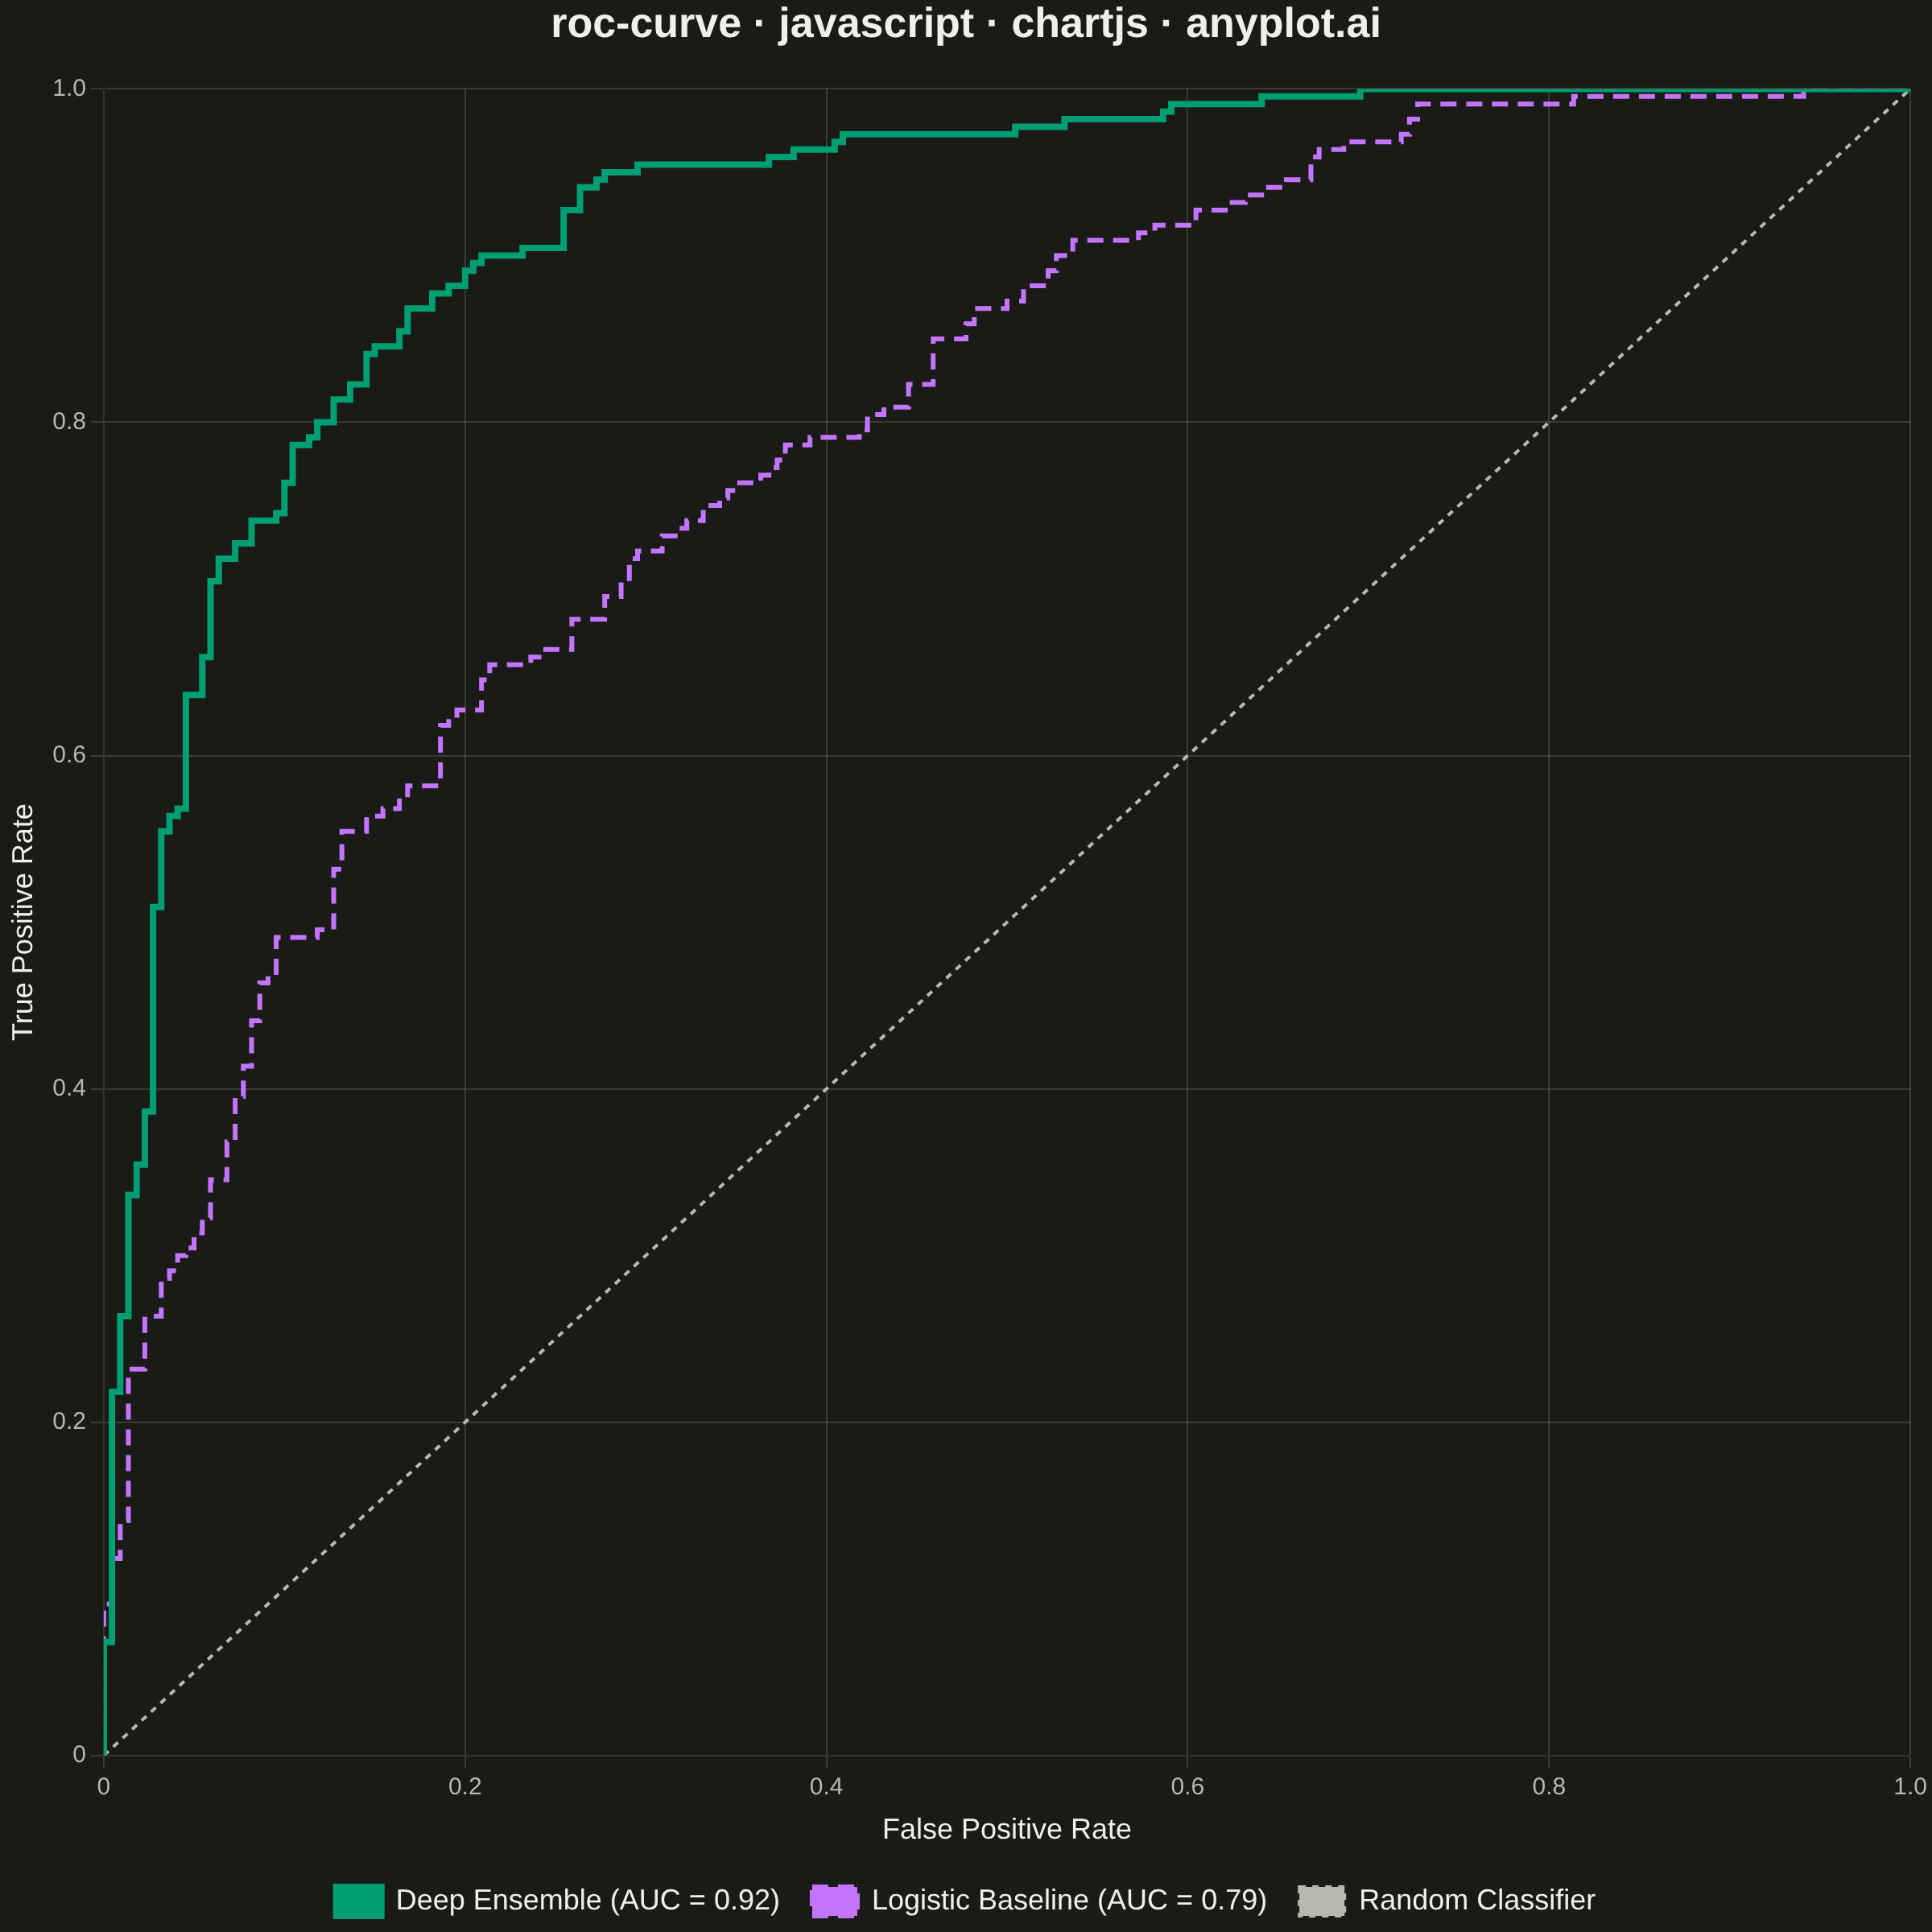
A Receiver Operating Characteristic (ROC) curve visualizes the performance of a binary classifier by plotting the True Positive Rate (TPR) against the False Positive Rate (FPR) at various classification thresholds. The Area Under the Curve (AUC) provides a single metric summarizing model performance, where 1.0 indicates perfect classification and 0.5 represents random guessing.
// anyplot.ai
// roc-curve: ROC Curve with AUC
// Library: chartjs 4.4.7 | JavaScript 22.23.2
// Quality: 86/100 | Created: 2026-09-05

//# anyplot-orientation: square
const t = window.ANYPLOT_TOKENS;

// --- Reproducible PRNG (LCG) + Box-Muller normal sampler --------------------
function makeLcg(seed) {
  let state = seed;
  return () => {
    state = (state * 1664525 + 1013904223) % 4294967296;
    return state / 4294967296;
  };
}
function sampleNormal(rand) {
  const u1 = Math.max(rand(), 1e-9);
  const u2 = rand();
  return Math.sqrt(-2 * Math.log(u1)) * Math.cos(2 * Math.PI * u2);
}

// --- Data: synthetic classifier scores for a tumor-malignancy screen -------
// 220 benign cases, 220 malignant cases; two candidate classifiers scored on
// the same cohort with different separability between the score distributions.
const N_PER_CLASS = 220;
const rand = makeLcg(42);
const labels = [];
const deepModelScores = [];
const baselineModelScores = [];
for (let i = 0; i < N_PER_CLASS; i++) {
  labels.push(0);
  deepModelScores.push(sampleNormal(rand) * 1.0 + 0.0);
  baselineModelScores.push(sampleNormal(rand) * 1.0 + 0.0);
}
for (let i = 0; i < N_PER_CLASS; i++) {
  labels.push(1);
  deepModelScores.push(sampleNormal(rand) * 1.0 + 2.1);
  baselineModelScores.push(sampleNormal(rand) * 1.0 + 1.0);
}

// --- ROC curve + AUC (trapezoidal rule) -------------------------------------
function computeRoc(scores, classLabels) {
  const positives = classLabels.reduce((sum, l) => sum + l, 0);
  const negatives = classLabels.length - positives;
  const order = scores
    .map((score, i) => i)
    .sort((a, b) => scores[b] - scores[a]);

  const points = [{ x: 0, y: 0 }];
  let truePositives = 0;
  let falsePositives = 0;
  for (const i of order) {
    if (classLabels[i] === 1) truePositives++;
    else falsePositives++;
    points.push({ x: falsePositives / negatives, y: truePositives / positives });
  }

  let auc = 0;
  for (let i = 1; i < points.length; i++) {
    const dx = points[i].x - points[i - 1].x;
    auc += (dx * (points[i].y + points[i - 1].y)) / 2;
  }
  return { points, auc };
}

const deepRoc = computeRoc(deepModelScores, labels);
const baselineRoc = computeRoc(baselineModelScores, labels);

// --- Mount -------------------------------------------------------------------
const canvas = document.createElement("canvas");
document.getElementById("container").appendChild(canvas);

// --- Chart ---------------------------------------------------------------
new Chart(canvas, {
  type: "line",
  data: {
    datasets: [
      {
        label: `Deep Ensemble (AUC = ${deepRoc.auc.toFixed(2)})`,
        data: deepRoc.points,
        borderColor: t.palette[0],
        backgroundColor: t.palette[0],
        borderWidth: 4,
        pointRadius: 0,
        fill: false,
        tension: 0,
      },
      {
        label: `Logistic Baseline (AUC = ${baselineRoc.auc.toFixed(2)})`,
        data: baselineRoc.points,
        borderColor: t.palette[1],
        backgroundColor: t.palette[1],
        borderWidth: 3,
        borderDash: [10, 6],
        pointRadius: 0,
        fill: false,
        tension: 0,
      },
      {
        label: "Random Classifier",
        data: [
          { x: 0, y: 0 },
          { x: 1, y: 1 },
        ],
        borderColor: t.inkSoft,
        backgroundColor: t.inkSoft,
        borderWidth: 2,
        borderDash: [4, 4],
        pointRadius: 0,
        fill: false,
        tension: 0,
      },
    ],
  },
  options: {
    responsive: true,
    maintainAspectRatio: false,
    animation: false,
    aspectRatio: 1,
    plugins: {
      title: {
        display: true,
        text: "roc-curve · javascript · chartjs · anyplot.ai",
        color: t.ink,
        font: { size: 26 },
        padding: { bottom: 24 },
      },
      legend: {
        position: "bottom",
        labels: { color: t.ink, font: { size: 18 }, boxWidth: 28, padding: 20 },
      },
    },
    scales: {
      x: {
        type: "linear",
        min: 0,
        max: 1,
        ticks: { color: t.inkSoft, font: { size: 15 }, stepSize: 0.2 },
        grid: { color: t.grid },
        title: { display: true, text: "False Positive Rate", color: t.ink, font: { size: 18 } },
      },
      y: {
        type: "linear",
        min: 0,
        max: 1,
        ticks: { color: t.inkSoft, font: { size: 15 }, stepSize: 0.2 },
        grid: { color: t.grid },
        title: { display: true, text: "True Positive Rate", color: t.ink, font: { size: 18 } },
      },
    },
  },
});
Runnable source as JSON, for any HTTP client: https://api.anyplot.ai/specs/roc-curve/chartjs/code. Any spec id and library id listed in llms-full.txt fit the same URL shape; every URL below is complete and callable.
{
  "spec_id": "roc-curve",
  "language": "javascript",
  "library": "chartjs",
  "page": "https://anyplot.ai/roc-curve/javascript/chartjs",
  "hub": "https://anyplot.ai/roc-curve",
  "code_json": "https://api.anyplot.ai/specs/roc-curve/chartjs/code",
  "spec_json": "https://api.anyplot.ai/specs/roc-curve",
  "render_light_png": "https://storage.googleapis.com/anyplot-images/plots/roc-curve/javascript/chartjs/plot-light.png",
  "render_dark_png": "https://storage.googleapis.com/anyplot-images/plots/roc-curve/javascript/chartjs/plot-dark.png",
  "interactive_light_html": "https://storage.googleapis.com/anyplot-images/plots/roc-curve/javascript/chartjs/plot-light.html",
  "interactive_dark_html": "https://storage.googleapis.com/anyplot-images/plots/roc-curve/javascript/chartjs/plot-dark.html",
  "quality_score": 86.0,
  "license": "MIT",
  "guide": "https://anyplot.ai/llms.txt"
}
Part of ROC Curve with AUC on anyplot.ai.