The same plot in 14 other libraries — JavaScript: Chart.js, D3.js, Highcharts, MUI X Charts; Python: Altair, Bokeh, lets-plot, Matplotlib, Plotly, plotnine, Pygal, Seaborn; R: ggplot2; Julia: Makie.jl. Compare all 15 side by side: ROC Curve with AUC in Python, R, Julia and JavaScript.
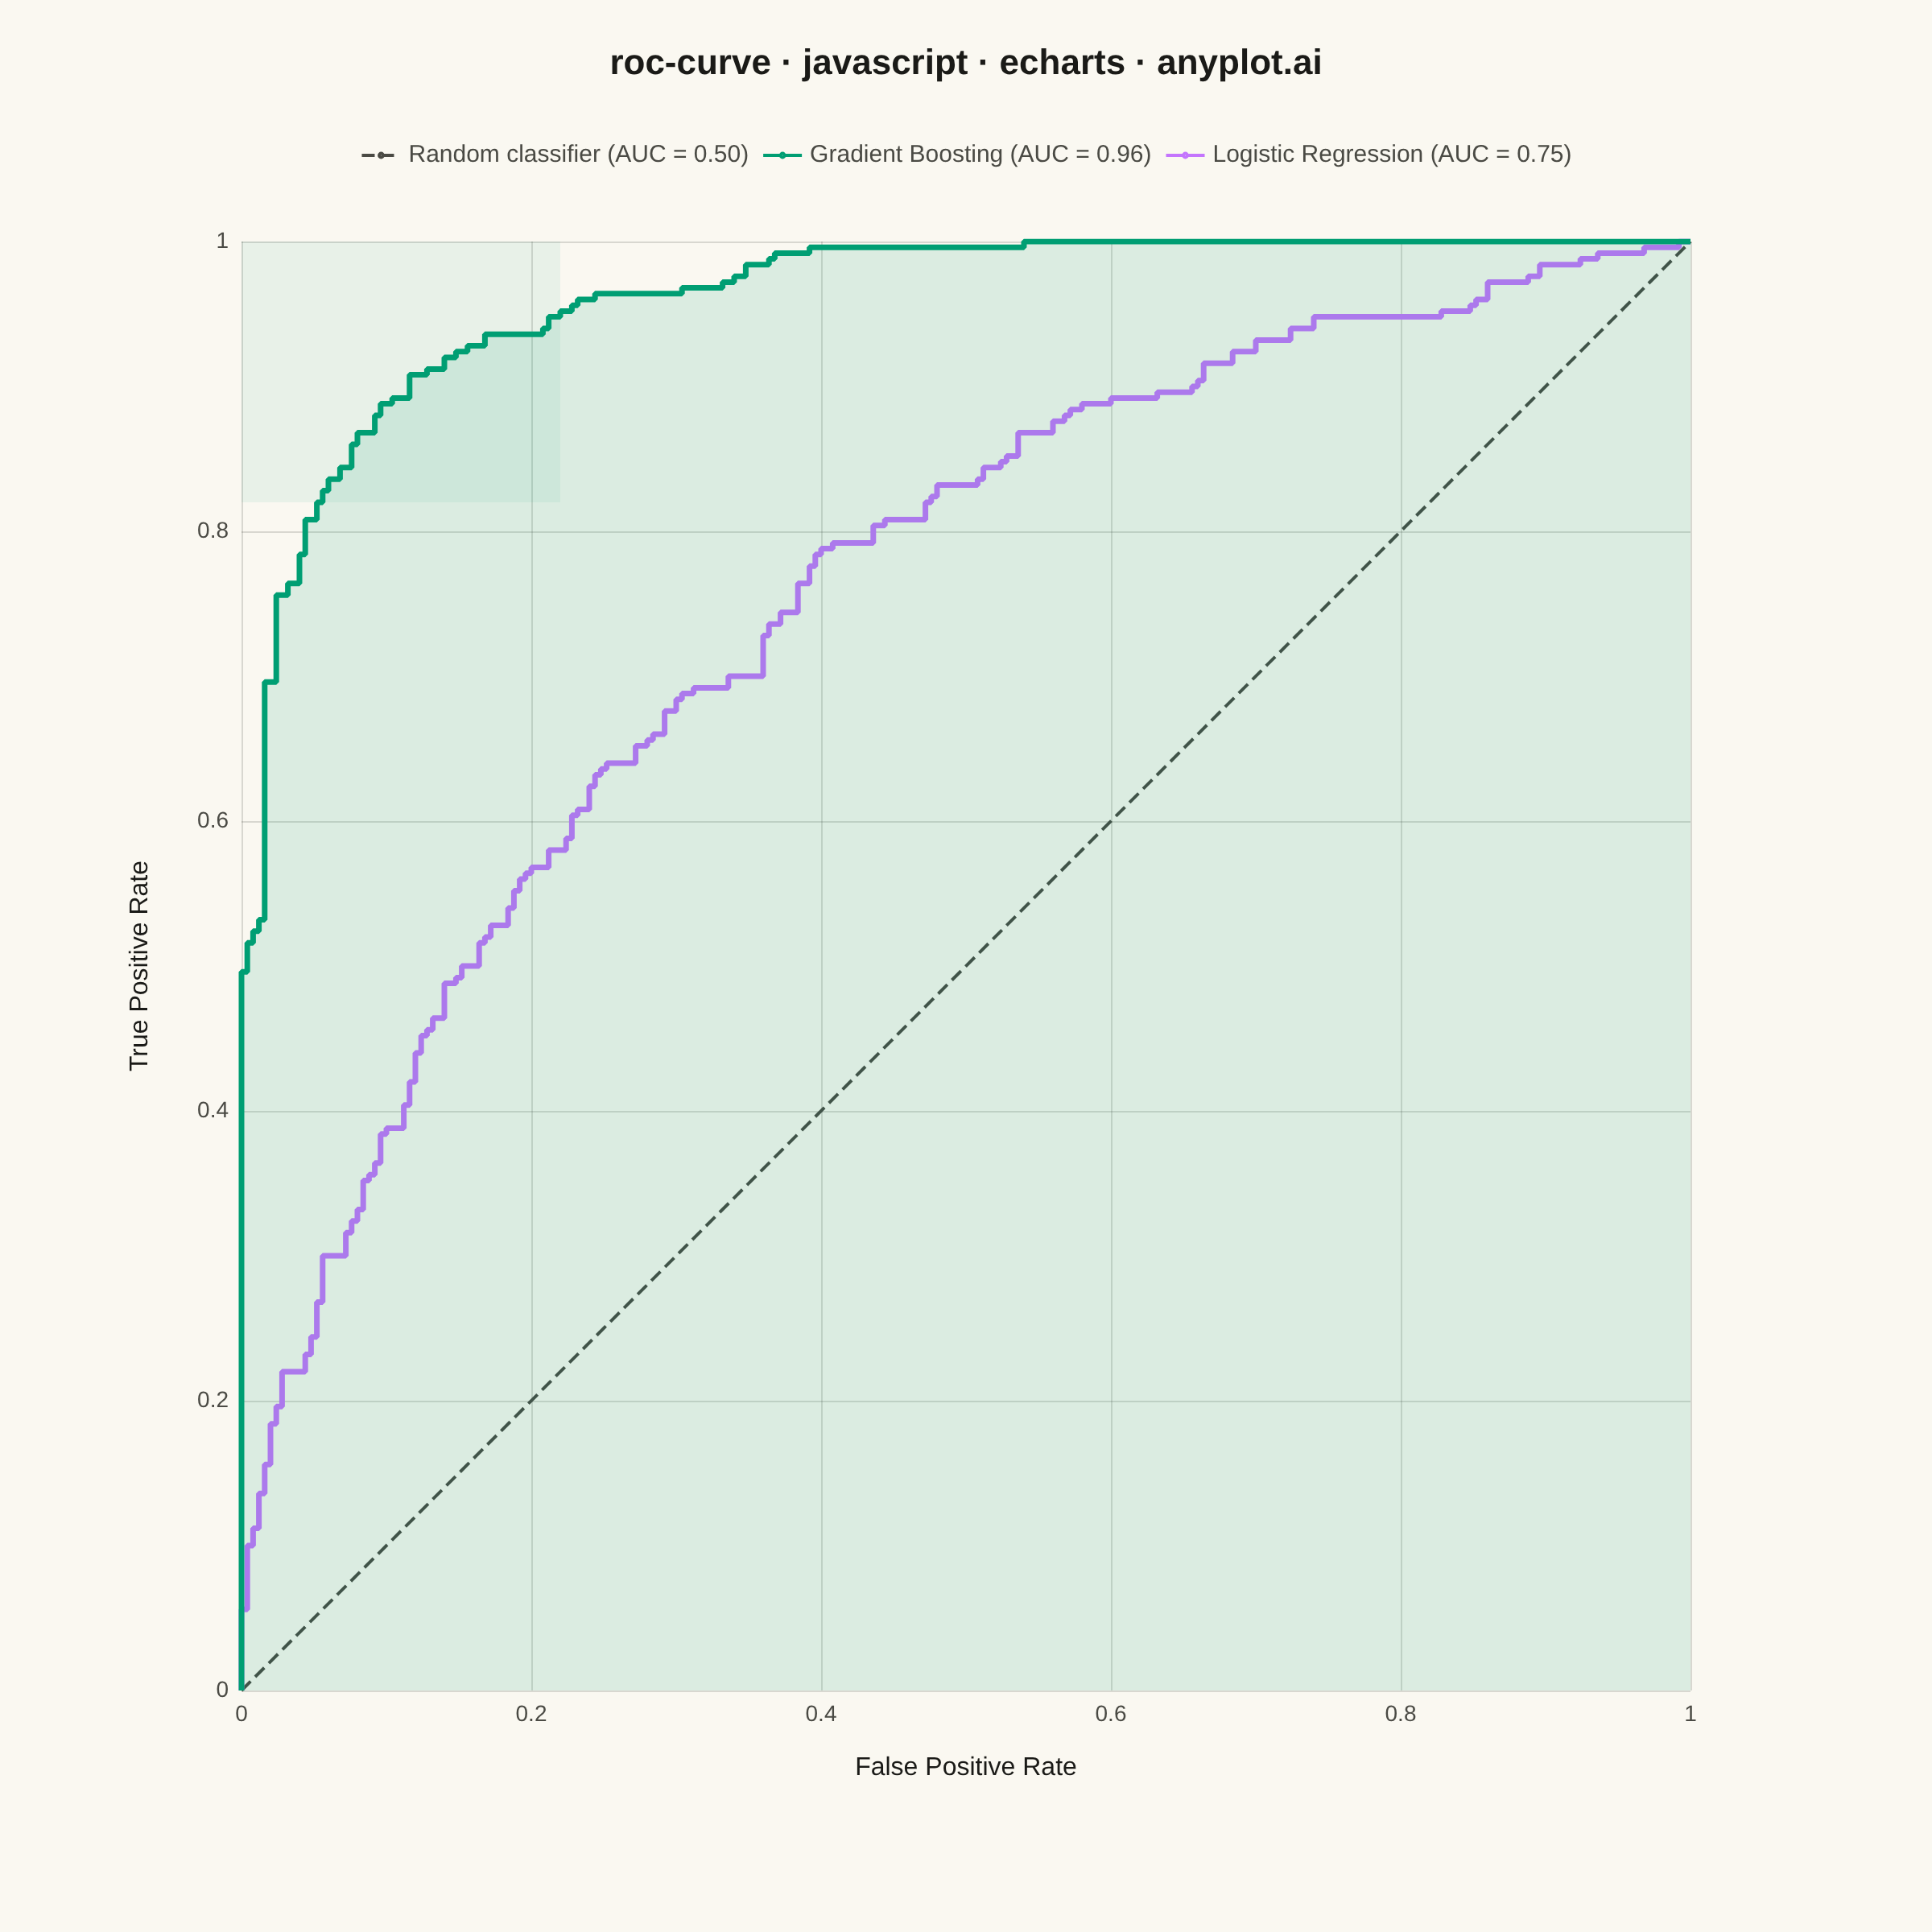
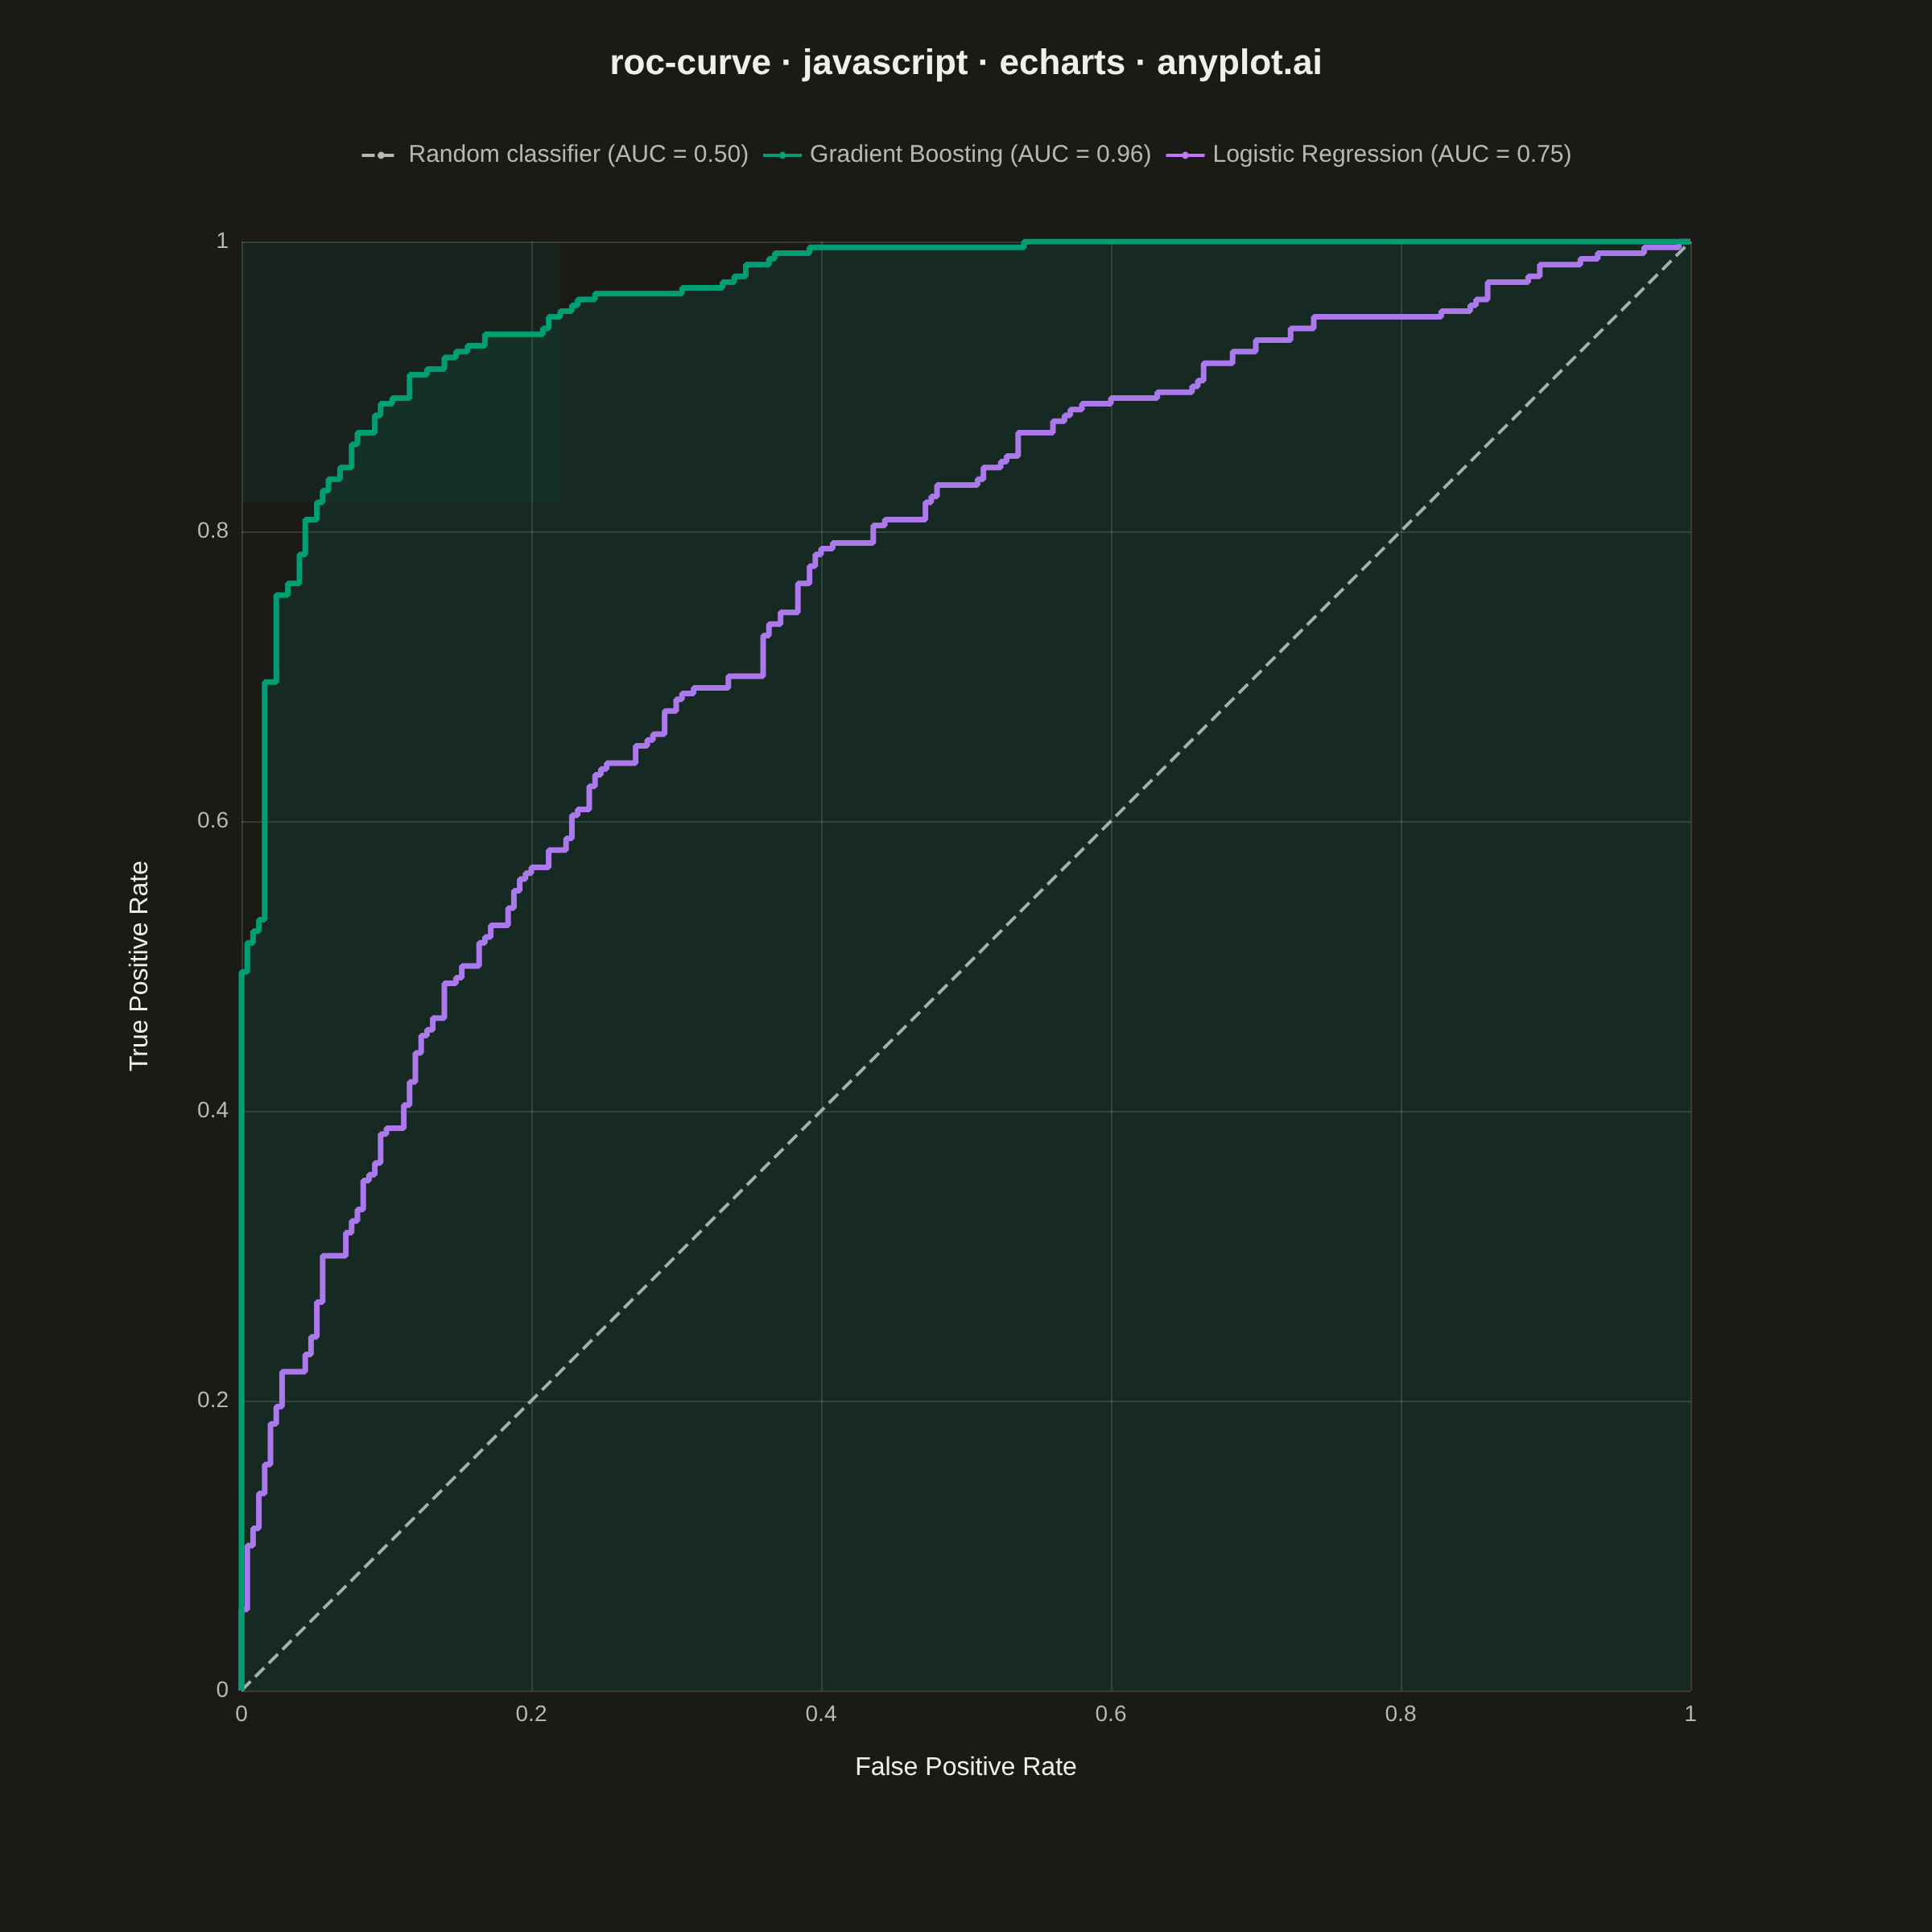
A Receiver Operating Characteristic (ROC) curve visualizes the performance of a binary classifier by plotting the True Positive Rate (TPR) against the False Positive Rate (FPR) at various classification thresholds. The Area Under the Curve (AUC) provides a single metric summarizing model performance, where 1.0 indicates perfect classification and 0.5 represents random guessing.
// anyplot.ai
// roc-curve: ROC Curve with AUC
// Library: echarts 6.1.0 | JavaScript 22.23.2
// Quality: 87/100 | Created: 2026-09-05

//# anyplot-orientation: square
const t = window.ANYPLOT_TOKENS;

// --- Data (in-memory, deterministic) ----------------------------------------
// Two binary classifiers scored on the same 500-sample holdout set (disease
// diagnosis: positive = disease present). Model scores are simulated via a
// tiny fixed-seed LCG so the ROC staircase is reproducible across renders.
function makeLcg(seed) {
  let state = seed >>> 0;
  return function random() {
    state = (state * 1664525 + 1013904223) >>> 0;
    return state / 4294967296;
  };
}

function sampleScores(seed, mean, stdDev, count) {
  const random = makeLcg(seed);
  return Array.from({ length: count }, () => {
    const u1 = Math.max(random(), 1e-9);
    const u2 = random();
    const z = Math.sqrt(-2 * Math.log(u1)) * Math.cos(2 * Math.PI * u2);
    return mean + z * stdDev;
  });
}

function rocCurve(negScores, posScores) {
  const P = posScores.length;
  const N = negScores.length;
  const thresholds = Array.from(new Set([...negScores, ...posScores])).sort(
    (a, b) => b - a,
  );

  const points = [[0, 0]];
  for (const threshold of thresholds) {
    const tp = posScores.filter((s) => s >= threshold).length;
    const fp = negScores.filter((s) => s >= threshold).length;
    points.push([fp / N, tp / P]);
  }
  points.push([1, 1]);
  return points.sort((a, b) => a[0] - b[0]);
}

function auc(points) {
  let area = 0;
  for (let i = 1; i < points.length; i++) {
    const [x0, y0] = points[i - 1];
    const [x1, y1] = points[i];
    area += ((x1 - x0) * (y0 + y1)) / 2;
  }
  return area;
}

const SAMPLE_SIZE = 250;
const negScoresGbm = sampleScores(1001, 0, 1, SAMPLE_SIZE);
const posScoresGbm = sampleScores(2002, 2.4, 1.05, SAMPLE_SIZE);
const negScoresLogReg = sampleScores(3003, 0, 1, SAMPLE_SIZE);
const posScoresLogReg = sampleScores(4004, 1.15, 1.2, SAMPLE_SIZE);

const gbmPoints = rocCurve(negScoresGbm, posScoresGbm);
const logRegPoints = rocCurve(negScoresLogReg, posScoresLogReg);
const gbmAuc = auc(gbmPoints);
const logRegAuc = auc(logRegPoints);

const gbmName = `Gradient Boosting (AUC = ${gbmAuc.toFixed(2)})`;
const logRegName = `Logistic Regression (AUC = ${logRegAuc.toFixed(2)})`;
const randomName = "Random classifier (AUC = 0.50)";

// --- Init --------------------------------------------------------------------
const chart = echarts.init(document.getElementById("container"));

// --- Option --------------------------------------------------------------------
chart.setOption({
  animation: false,
  color: t.palette,
  backgroundColor: "transparent",
  title: {
    text: "roc-curve · javascript · echarts · anyplot.ai",
    left: "center",
    top: 24,
    textStyle: { color: t.ink, fontSize: 22 },
  },
  legend: {
    top: 84,
    left: "center",
    itemWidth: 24,
    itemHeight: 3,
    textStyle: { color: t.inkSoft, fontSize: 15 },
  },
  tooltip: {
    trigger: "axis",
    axisPointer: { type: "cross" },
  },
  grid: {
    left: 150,
    top: 150,
    width: 900,
    height: 900,
  },
  xAxis: {
    type: "value",
    name: "False Positive Rate",
    nameLocation: "middle",
    nameGap: 40,
    nameTextStyle: { color: t.ink, fontSize: 16 },
    min: 0,
    max: 1,
    interval: 0.2,
    axisLabel: { color: t.inkSoft, fontSize: 14 },
    axisLine: { show: false },
    axisTick: { show: false },
    splitLine: { show: true, lineStyle: { color: t.grid } },
  },
  yAxis: {
    type: "value",
    name: "True Positive Rate",
    nameLocation: "middle",
    nameGap: 55,
    nameTextStyle: { color: t.ink, fontSize: 16 },
    min: 0,
    max: 1,
    interval: 0.2,
    axisLabel: { color: t.inkSoft, fontSize: 14 },
    axisLine: { show: false },
    axisTick: { show: false },
    splitLine: { show: true, lineStyle: { color: t.grid } },
  },
  series: [
    {
      name: randomName,
      type: "line",
      data: [
        [0, 0],
        [1, 1],
      ],
      showSymbol: false,
      lineStyle: { color: t.inkSoft, width: 2, type: "dashed" },
      itemStyle: { color: t.inkSoft },
      emphasis: { disabled: true },
      z: 1,
    },
    {
      name: gbmName,
      type: "line",
      step: "end",
      data: gbmPoints,
      showSymbol: false,
      lineStyle: { color: t.palette[0], width: 3.5 },
      itemStyle: { color: t.palette[0] },
      areaStyle: { color: t.palette[0], opacity: 0.12 },
      markArea: {
        silent: true,
        label: { show: false },
        itemStyle: { color: t.palette[0], opacity: 0.07 },
        data: [[{ coord: [0, 1] }, { coord: [0.22, 0.82] }]],
      },
      z: 3,
    },
    {
      name: logRegName,
      type: "line",
      step: "end",
      data: logRegPoints,
      showSymbol: false,
      lineStyle: { color: t.palette[1], width: 3.5 },
      itemStyle: { color: t.palette[1] },
      z: 2,
    },
  ],
});
Runnable source as JSON, for any HTTP client: https://api.anyplot.ai/specs/roc-curve/echarts/code. Any spec id and library id listed in llms-full.txt fit the same URL shape; every URL below is complete and callable.
{
  "spec_id": "roc-curve",
  "language": "javascript",
  "library": "echarts",
  "page": "https://anyplot.ai/roc-curve/javascript/echarts",
  "hub": "https://anyplot.ai/roc-curve",
  "code_json": "https://api.anyplot.ai/specs/roc-curve/echarts/code",
  "spec_json": "https://api.anyplot.ai/specs/roc-curve",
  "render_light_png": "https://storage.googleapis.com/anyplot-images/plots/roc-curve/javascript/echarts/plot-light.png",
  "render_dark_png": "https://storage.googleapis.com/anyplot-images/plots/roc-curve/javascript/echarts/plot-dark.png",
  "interactive_light_html": "https://storage.googleapis.com/anyplot-images/plots/roc-curve/javascript/echarts/plot-light.html",
  "interactive_dark_html": "https://storage.googleapis.com/anyplot-images/plots/roc-curve/javascript/echarts/plot-dark.html",
  "quality_score": 87.0,
  "license": "MIT",
  "guide": "https://anyplot.ai/llms.txt"
}
Part of ROC Curve with AUC on anyplot.ai.