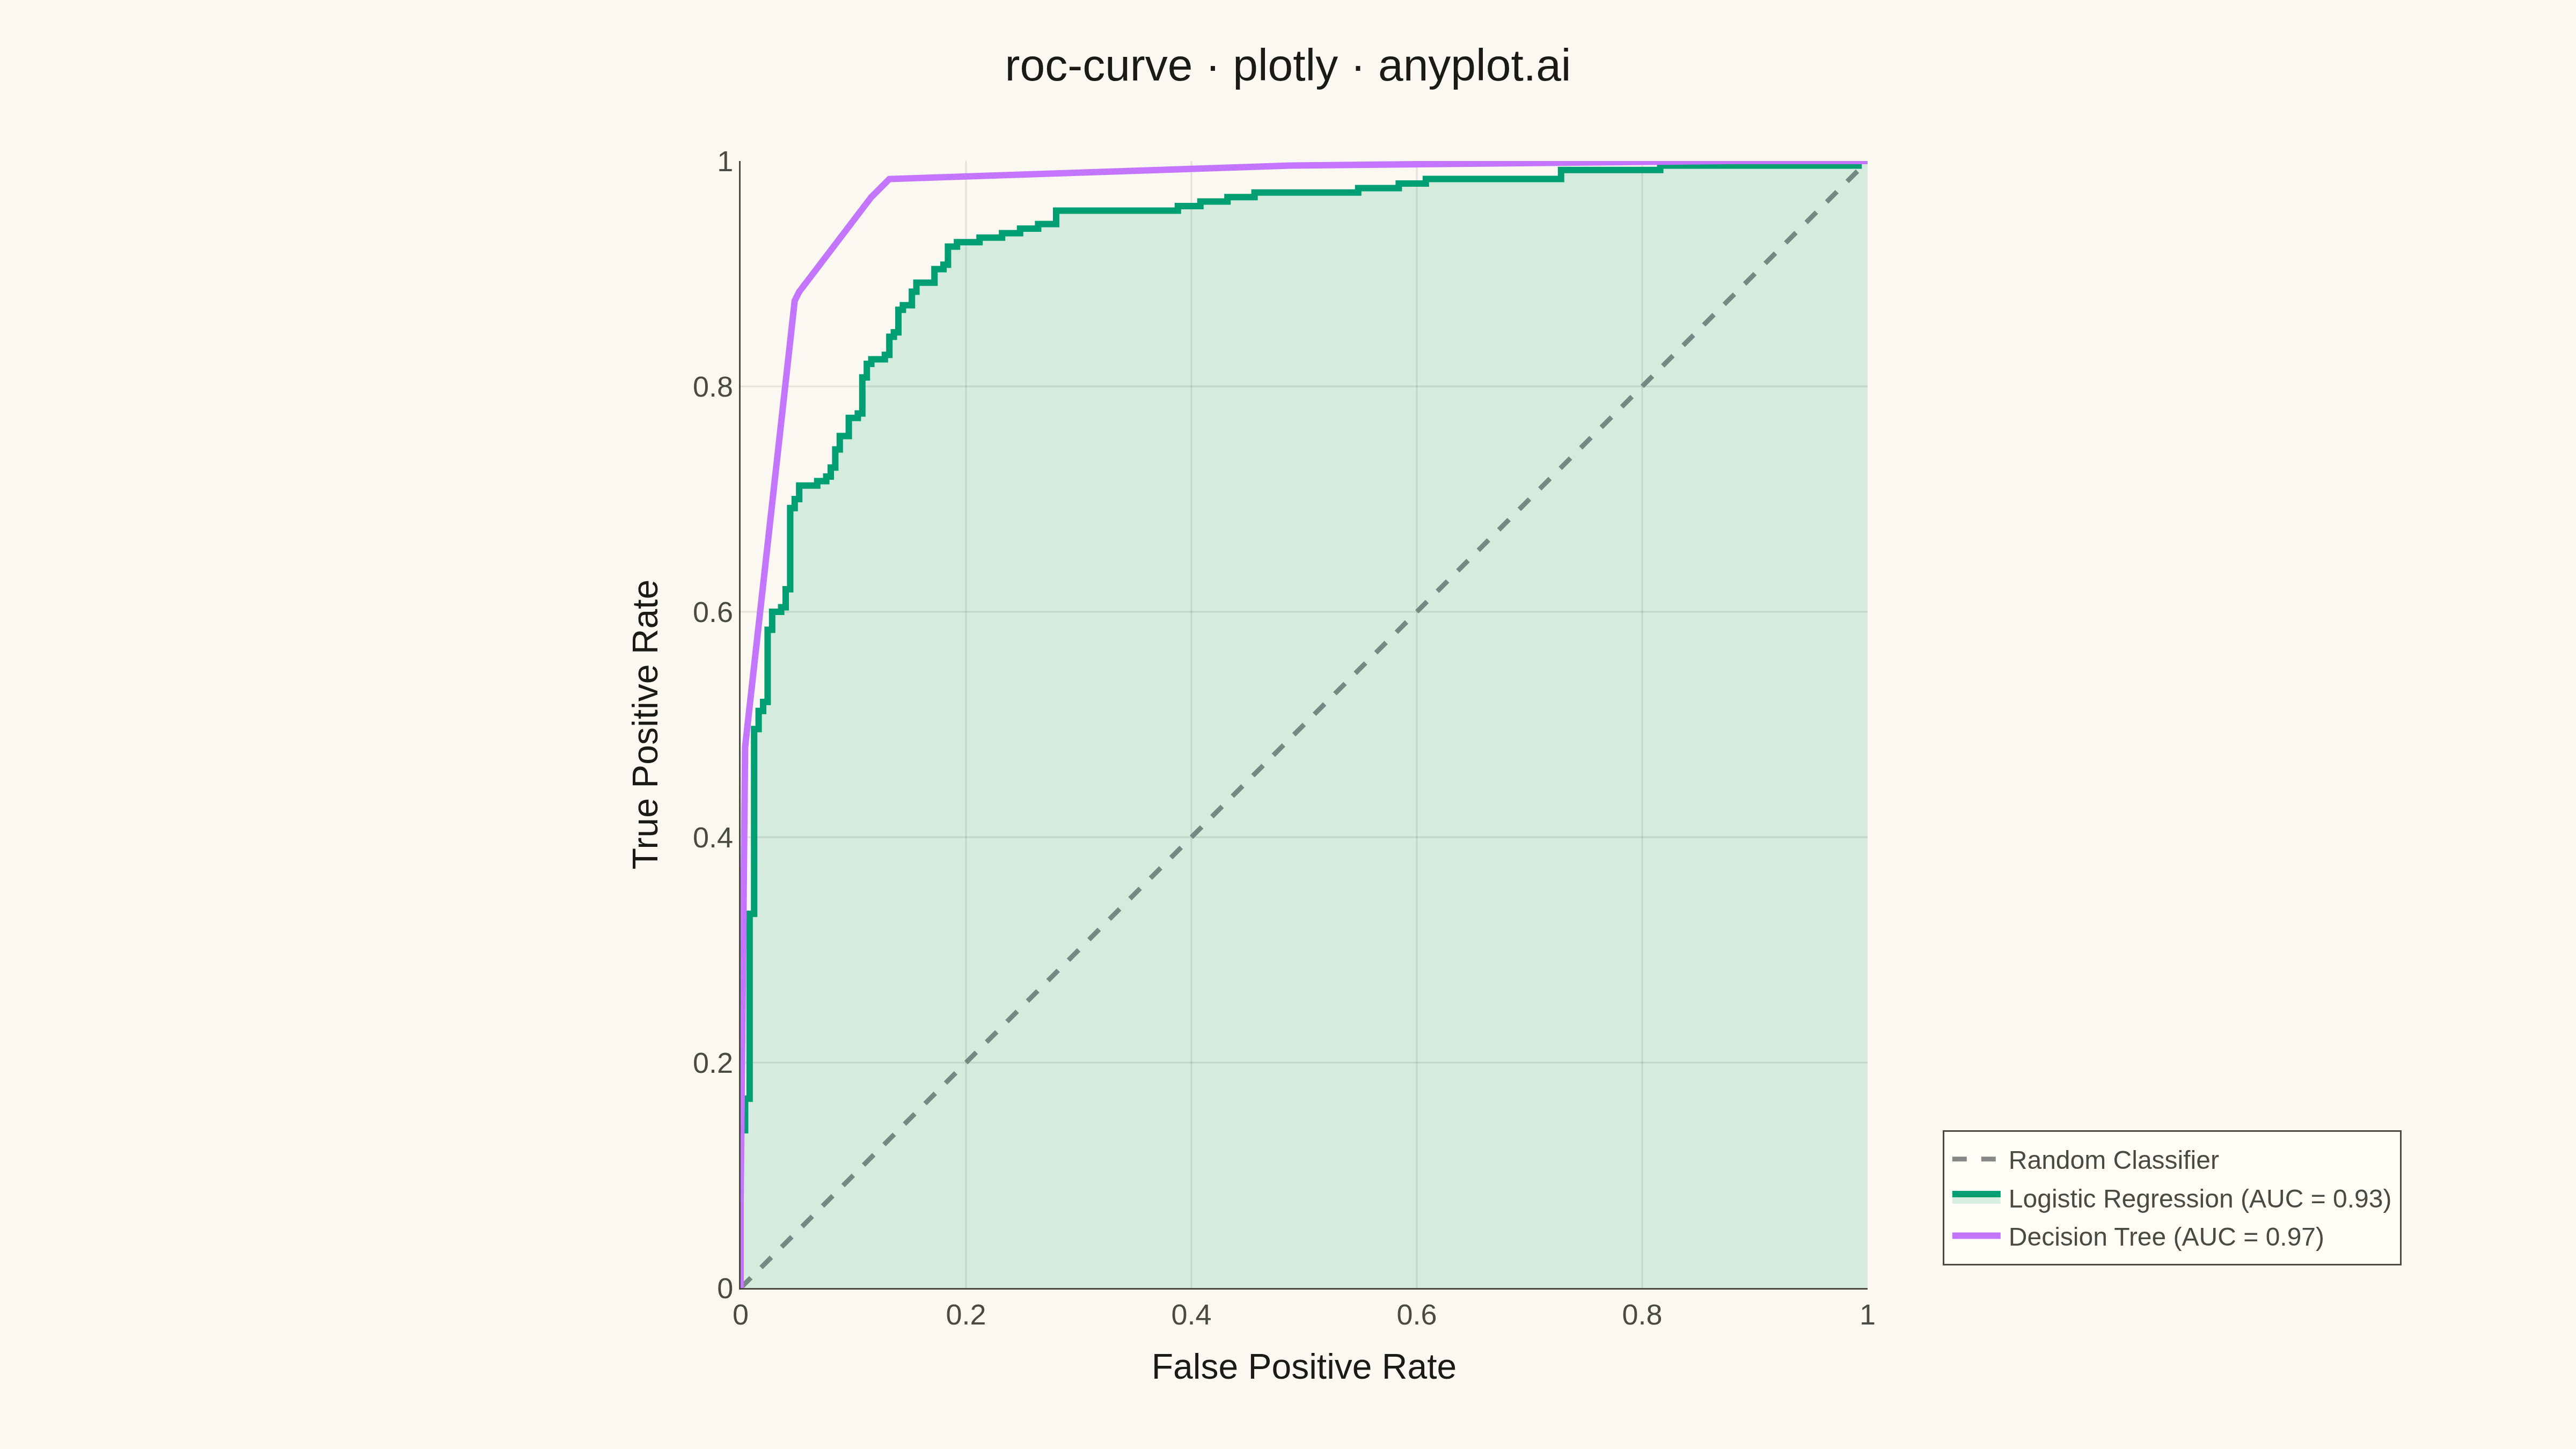
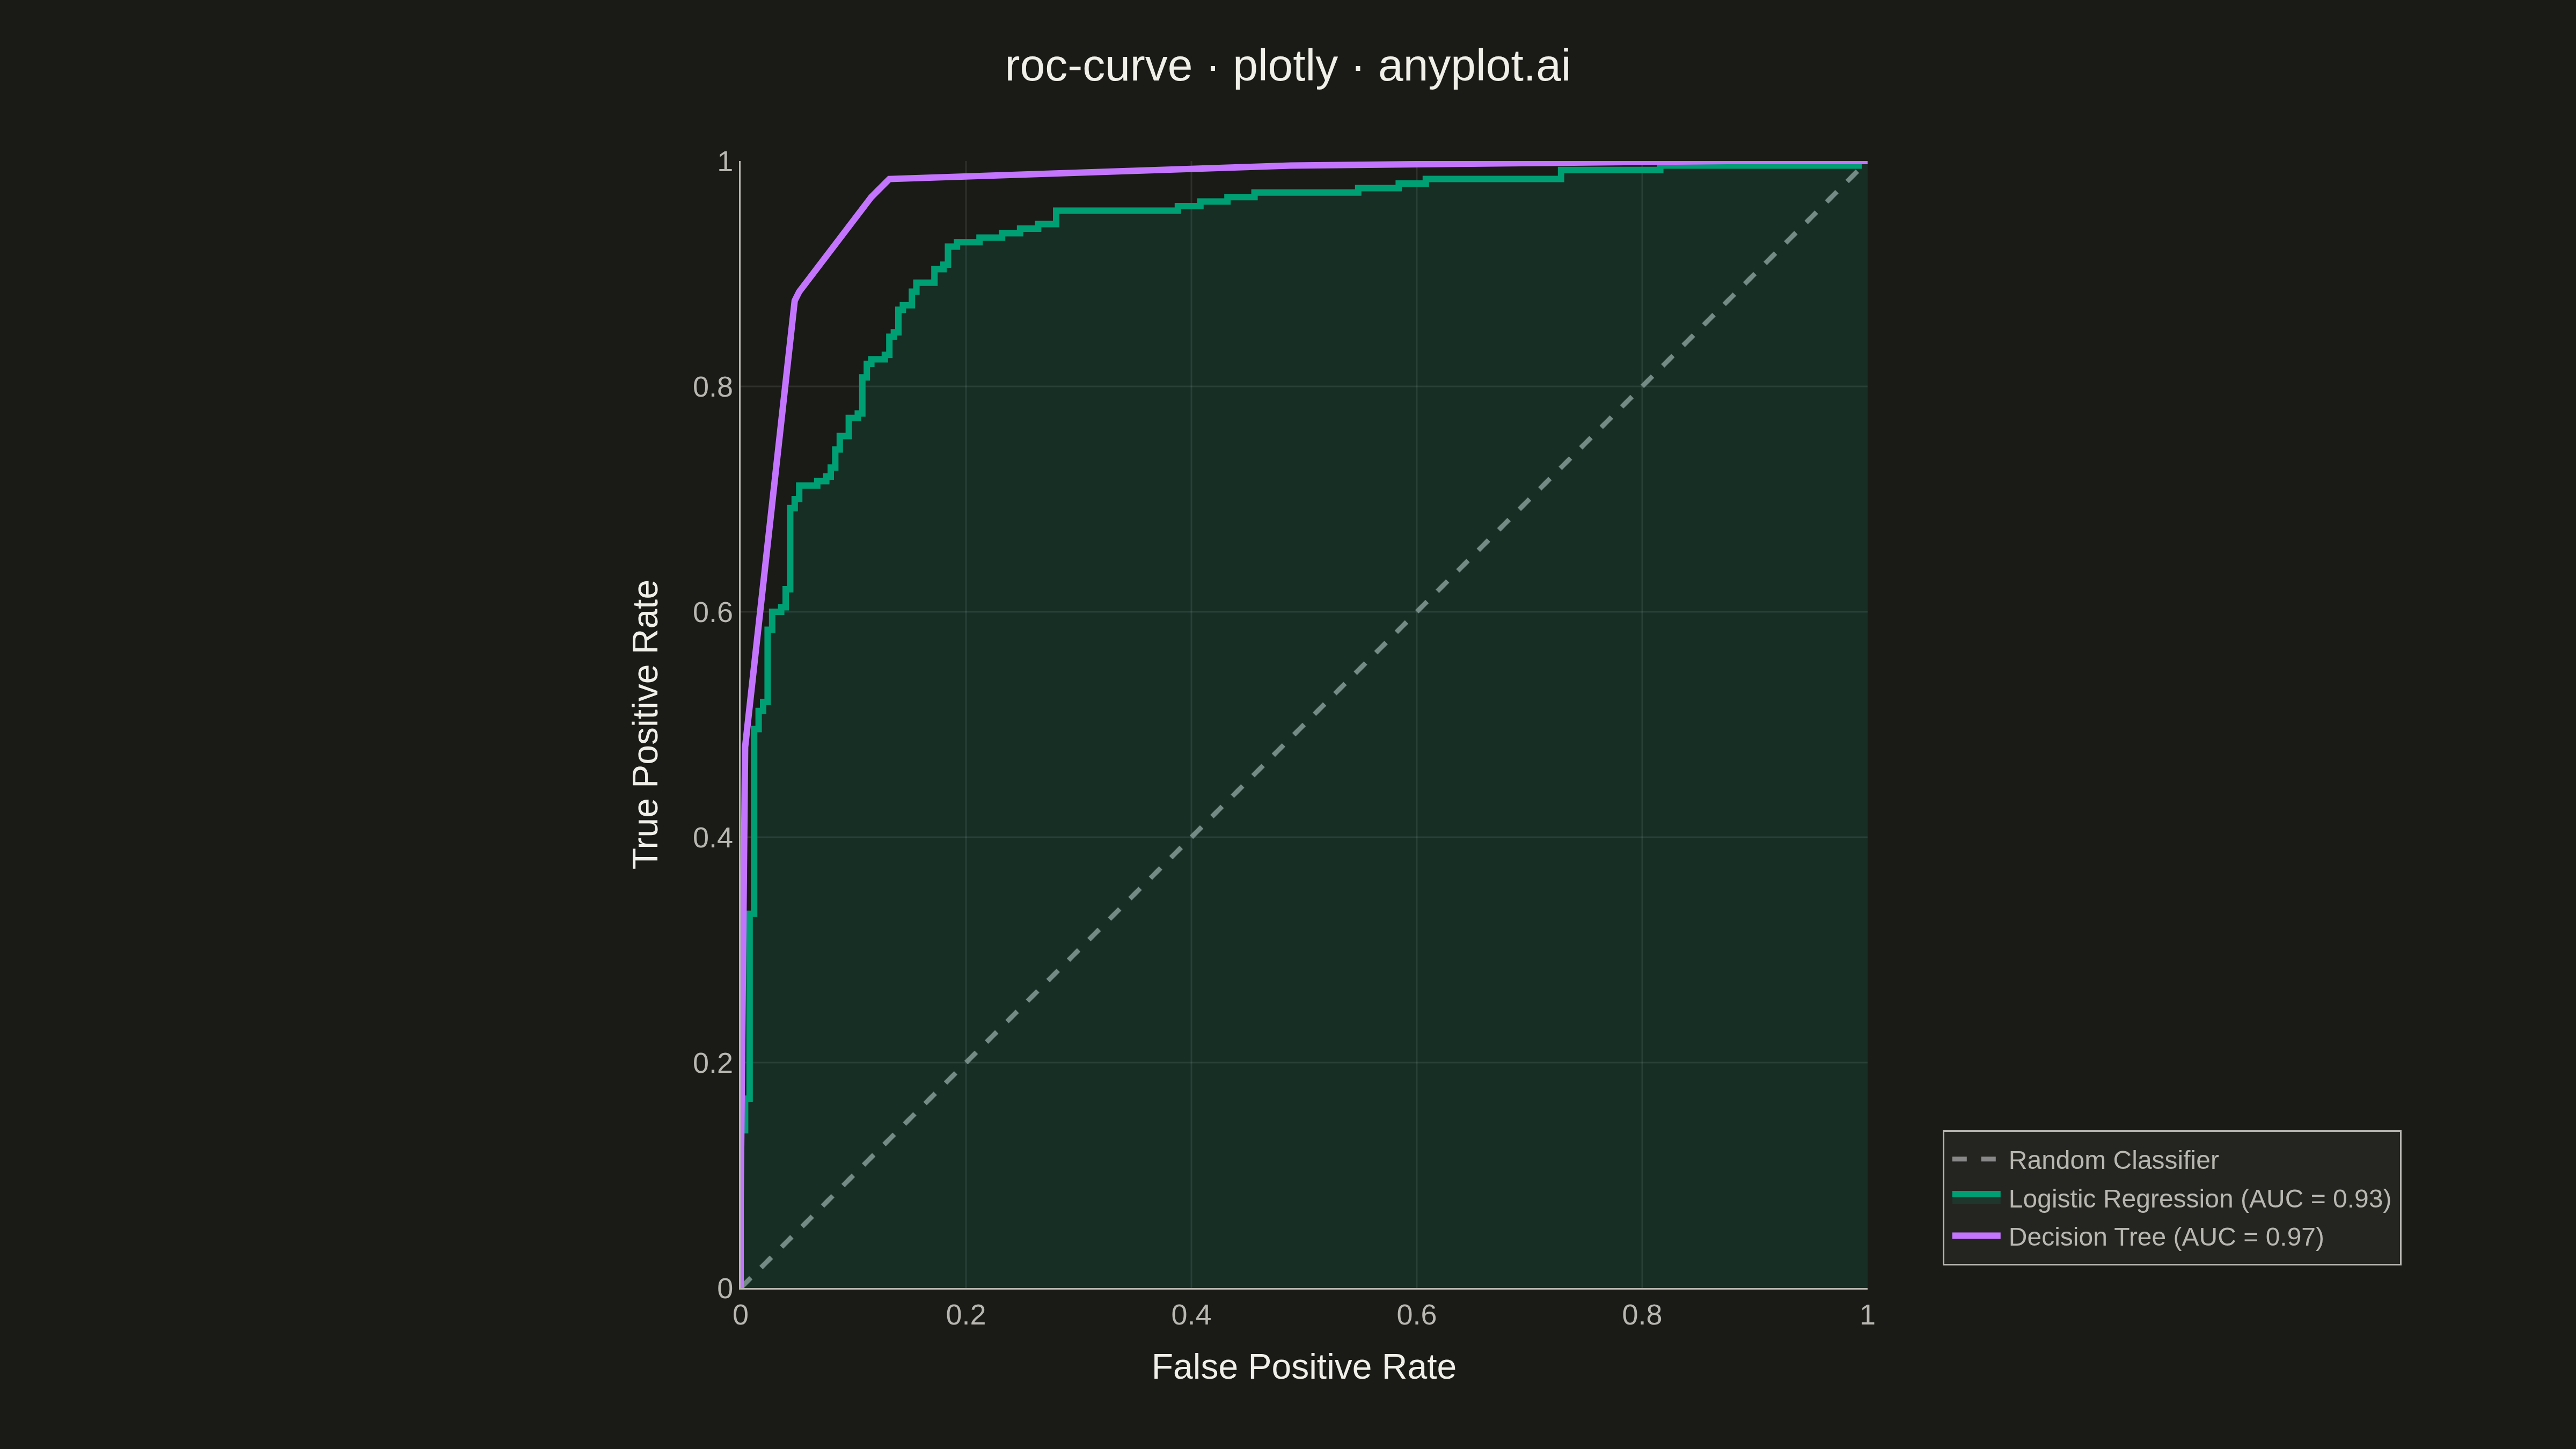
A Receiver Operating Characteristic (ROC) curve visualizes the performance of a binary classifier by plotting the True Positive Rate (TPR) against the False Positive Rate (FPR) at various classification thresholds. The Area Under the Curve (AUC) provides a single metric summarizing model performance, where 1.0 indicates perfect classification and 0.5 represents random guessing.
""" anyplot.ai
roc-curve: ROC Curve with AUC
Library: plotly 6.7.0 | Python 3.13.13
Quality: 92/100 | Updated: 2026-05-09
"""

import os

import numpy as np
import plotly.graph_objects as go
from sklearn.datasets import make_classification
from sklearn.linear_model import LogisticRegression
from sklearn.metrics import auc, roc_curve
from sklearn.tree import DecisionTreeClassifier


# Theme tokens
THEME = os.getenv("ANYPLOT_THEME", "light")
PAGE_BG = "#FAF8F1" if THEME == "light" else "#1A1A17"
ELEVATED_BG = "#FFFDF6" if THEME == "light" else "#242420"
INK = "#1A1A17" if THEME == "light" else "#F0EFE8"
INK_SOFT = "#4A4A44" if THEME == "light" else "#B8B7B0"
GRID = "rgba(26,26,23,0.10)" if THEME == "light" else "rgba(240,239,232,0.10)"

# Okabe-Ito palette
BRAND_1 = "#009E73"
BRAND_2 = "#C475FD"
NEUTRAL = "#888888"

# Generate classification data
np.random.seed(42)
X, y = make_classification(n_samples=500, n_features=10, n_informative=8, random_state=42, class_sep=1.5)

# Train two classifiers
lr = LogisticRegression(random_state=42, max_iter=1000)
lr.fit(X, y)
y_scores_lr = lr.predict_proba(X)[:, 1]

dt = DecisionTreeClassifier(random_state=42, max_depth=5)
dt.fit(X, y)
y_scores_dt = dt.predict_proba(X)[:, 1]

# Calculate ROC curves using sklearn
fpr_lr, tpr_lr, _ = roc_curve(y, y_scores_lr)
auc_lr = auc(fpr_lr, tpr_lr)

fpr_dt, tpr_dt, _ = roc_curve(y, y_scores_dt)
auc_dt = auc(fpr_dt, tpr_dt)

# Create plot
fig = go.Figure()

# Random classifier baseline
fig.add_trace(
    go.Scatter(
        x=[0, 1],
        y=[0, 1],
        mode="lines",
        name="Random Classifier",
        line={"color": NEUTRAL, "width": 3, "dash": "dash"},
        showlegend=True,
    )
)

# Logistic Regression ROC curve
fig.add_trace(
    go.Scatter(
        x=fpr_lr,
        y=tpr_lr,
        mode="lines",
        name=f"Logistic Regression (AUC = {auc_lr:.2f})",
        line={"color": BRAND_1, "width": 4},
        fill="tozeroy",
        fillcolor="rgba(0, 158, 115, 0.15)",
    )
)

# Decision Tree ROC curve
fig.add_trace(
    go.Scatter(
        x=fpr_dt,
        y=tpr_dt,
        mode="lines",
        name=f"Decision Tree (AUC = {auc_dt:.2f})",
        line={"color": BRAND_2, "width": 4},
    )
)

# Layout with theme-adaptive styling
fig.update_layout(
    title={
        "text": "roc-curve · plotly · anyplot.ai",
        "font": {"size": 28, "color": INK},
        "x": 0.5,
        "xanchor": "center",
    },
    xaxis={
        "title": {"text": "False Positive Rate", "font": {"size": 22, "color": INK}},
        "tickfont": {"size": 18, "color": INK_SOFT},
        "range": [0, 1],
        "dtick": 0.2,
        "showgrid": True,
        "gridcolor": GRID,
        "gridwidth": 1,
        "zeroline": False,
        "linecolor": INK_SOFT,
        "constrain": "domain",
    },
    yaxis={
        "title": {"text": "True Positive Rate", "font": {"size": 22, "color": INK}},
        "tickfont": {"size": 18, "color": INK_SOFT},
        "range": [0, 1],
        "dtick": 0.2,
        "showgrid": True,
        "gridcolor": GRID,
        "gridwidth": 1,
        "zeroline": False,
        "linecolor": INK_SOFT,
        "scaleanchor": "x",
        "scaleratio": 1,
        "constrain": "domain",
    },
    paper_bgcolor=PAGE_BG,
    plot_bgcolor=PAGE_BG,
    legend={
        "x": 0.98,
        "y": 0.02,
        "xanchor": "right",
        "yanchor": "bottom",
        "font": {"size": 16, "color": INK_SOFT},
        "bgcolor": ELEVATED_BG,
        "bordercolor": INK_SOFT,
        "borderwidth": 1,
    },
    margin={"l": 100, "r": 80, "t": 100, "b": 100},
)

# Save as PNG and HTML
fig.write_image(f"plot-{THEME}.png", width=1600, height=900, scale=3)
fig.write_html(f"plot-{THEME}.html", include_plotlyjs="cdn")
Runnable source as JSON, for any HTTP client: https://api.anyplot.ai/specs/roc-curve/plotly/code. Any spec id and library id listed in llms-full.txt fit the same URL shape; every URL below is complete and callable.
{
  "spec_id": "roc-curve",
  "language": "python",
  "library": "plotly",
  "page": "https://anyplot.ai/roc-curve/python/plotly",
  "hub": "https://anyplot.ai/roc-curve",
  "code_json": "https://api.anyplot.ai/specs/roc-curve/plotly/code",
  "spec_json": "https://api.anyplot.ai/specs/roc-curve",
  "render_light_png": "https://storage.googleapis.com/anyplot-images/plots/roc-curve/python/plotly/plot-light.png",
  "render_dark_png": "https://storage.googleapis.com/anyplot-images/plots/roc-curve/python/plotly/plot-dark.png",
  "interactive_light_html": "https://storage.googleapis.com/anyplot-images/plots/roc-curve/python/plotly/plot-light.html",
  "interactive_dark_html": "https://storage.googleapis.com/anyplot-images/plots/roc-curve/python/plotly/plot-dark.html",
  "quality_score": 92.0,
  "license": "MIT",
  "guide": "https://anyplot.ai/llms.txt"
}
Part of ROC Curve with AUC on anyplot.ai.