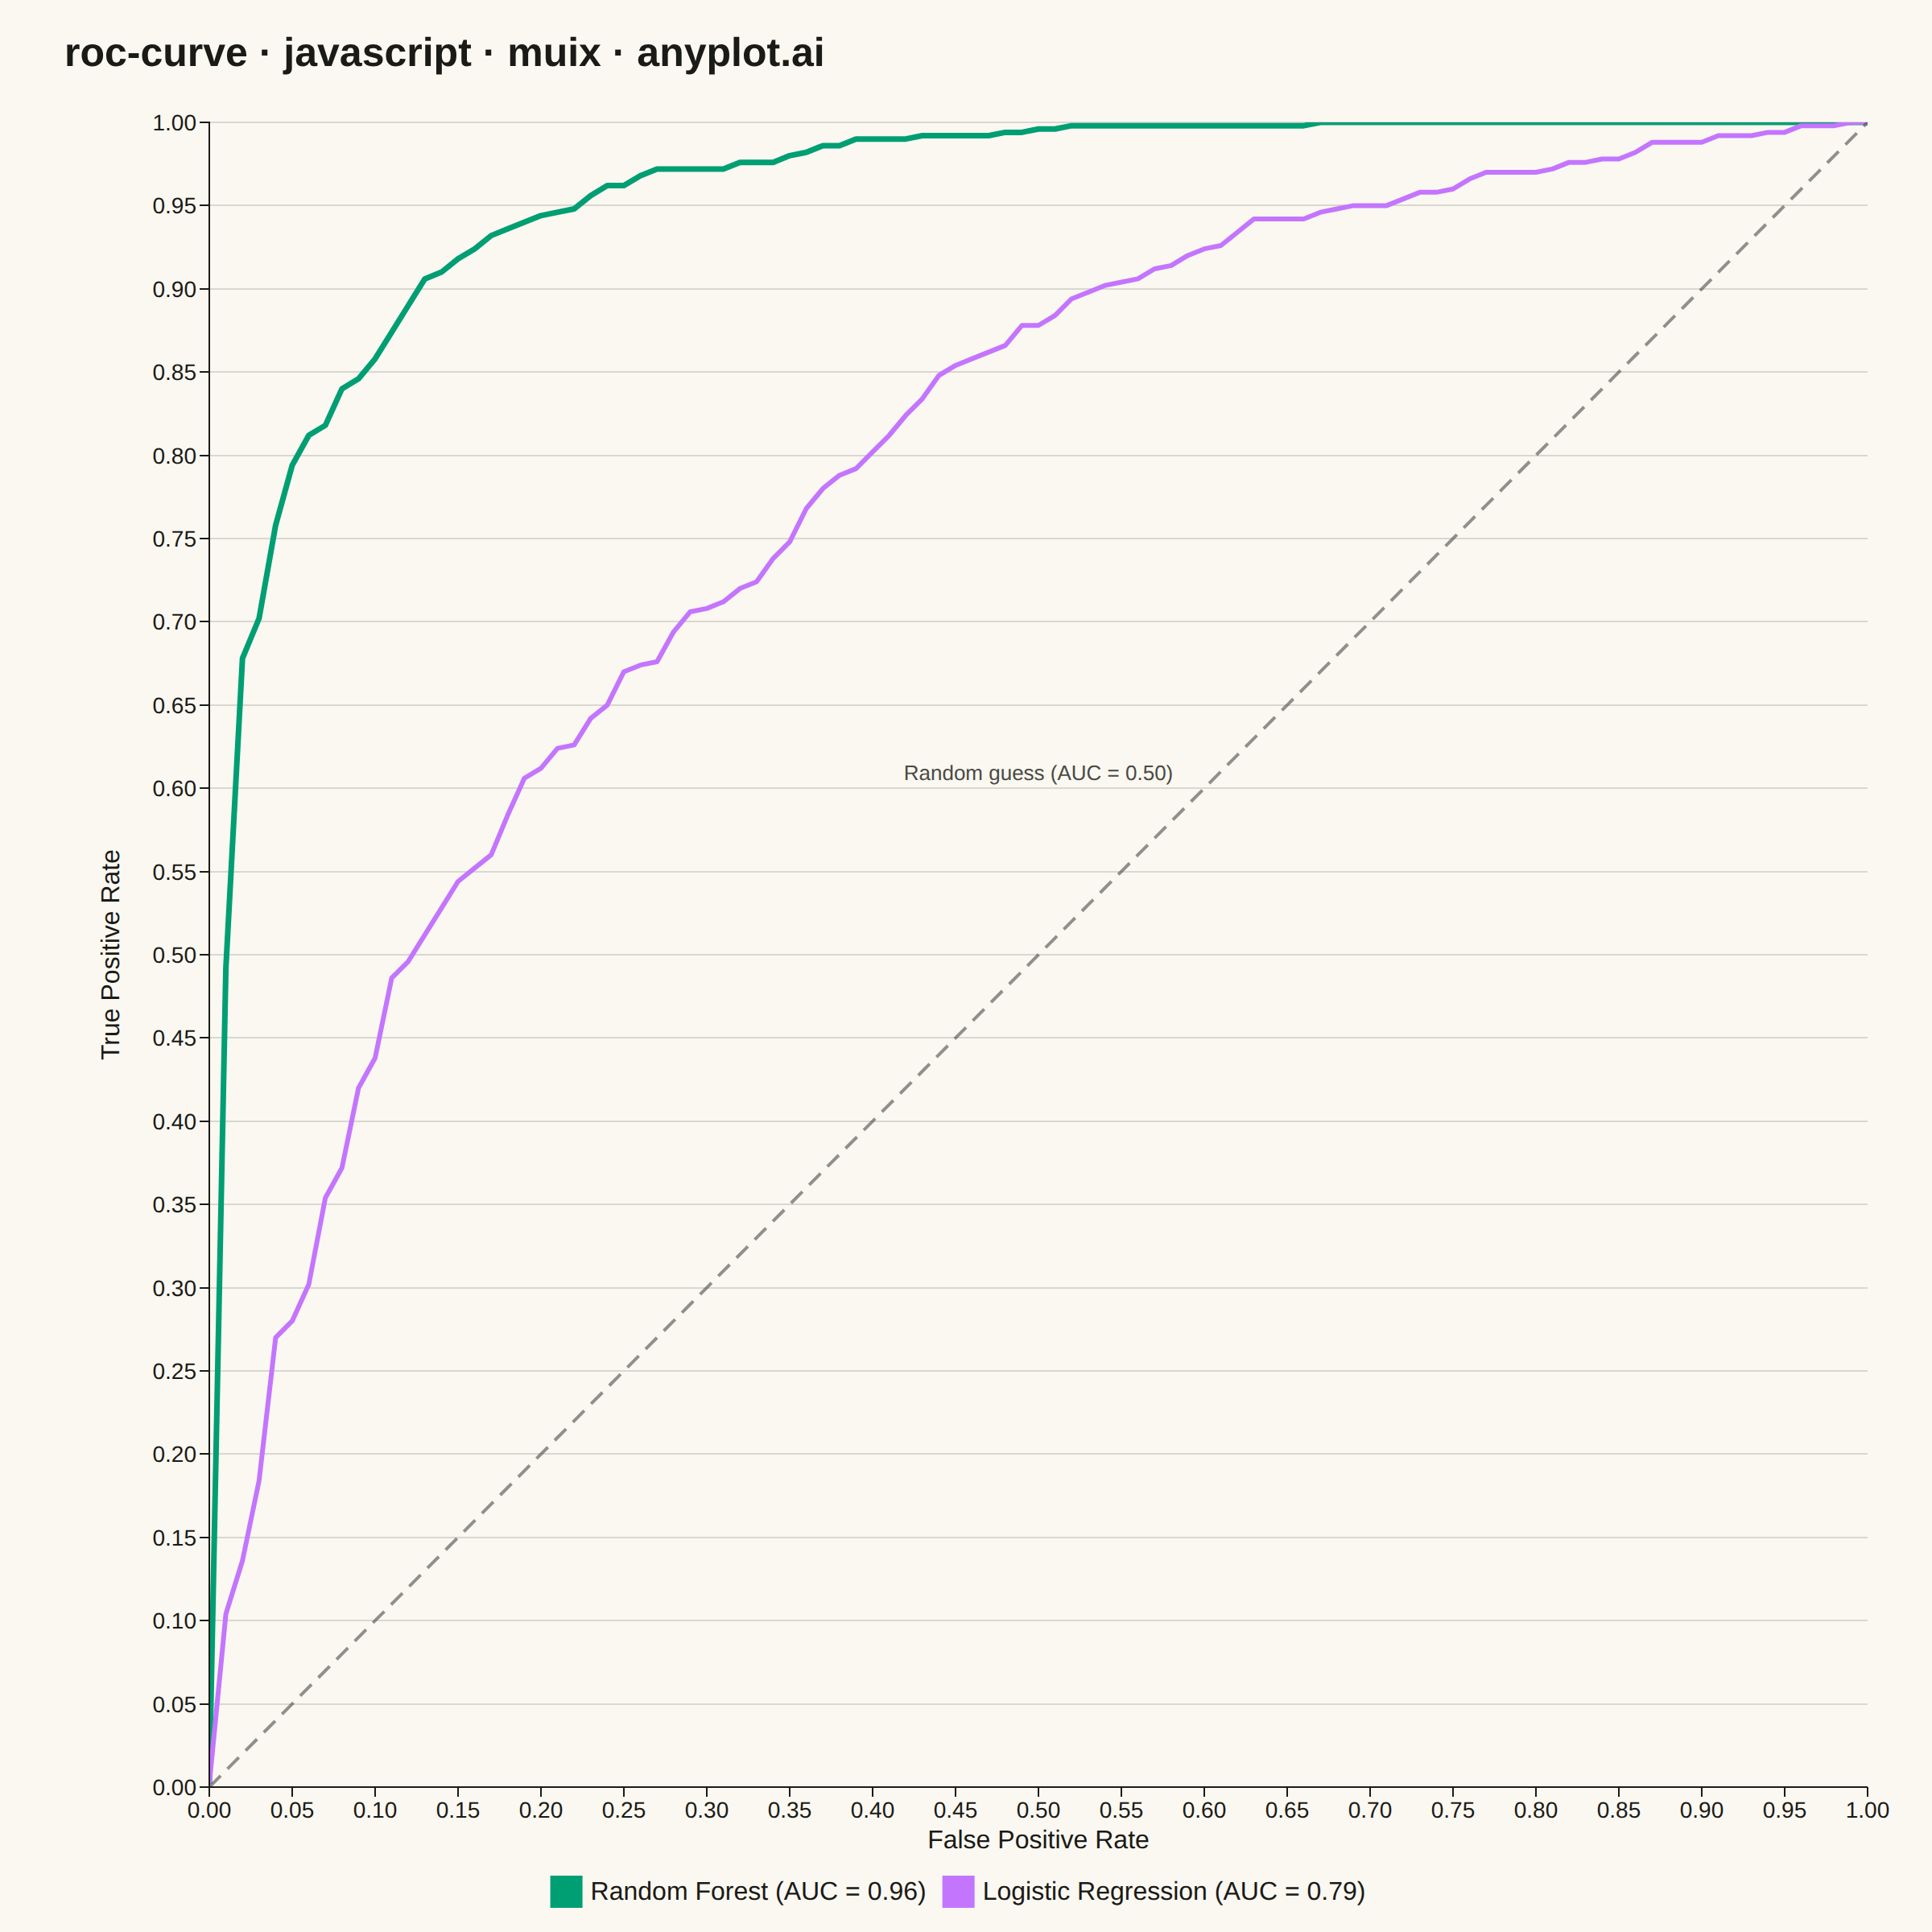
The same plot in 14 other libraries — JavaScript: Chart.js, D3.js, Apache ECharts, Highcharts; Python: Altair, Bokeh, lets-plot, Matplotlib, Plotly, plotnine, Pygal, Seaborn; R: ggplot2; Julia: Makie.jl. Compare all 15 side by side: ROC Curve with AUC in Python, R, Julia and JavaScript.
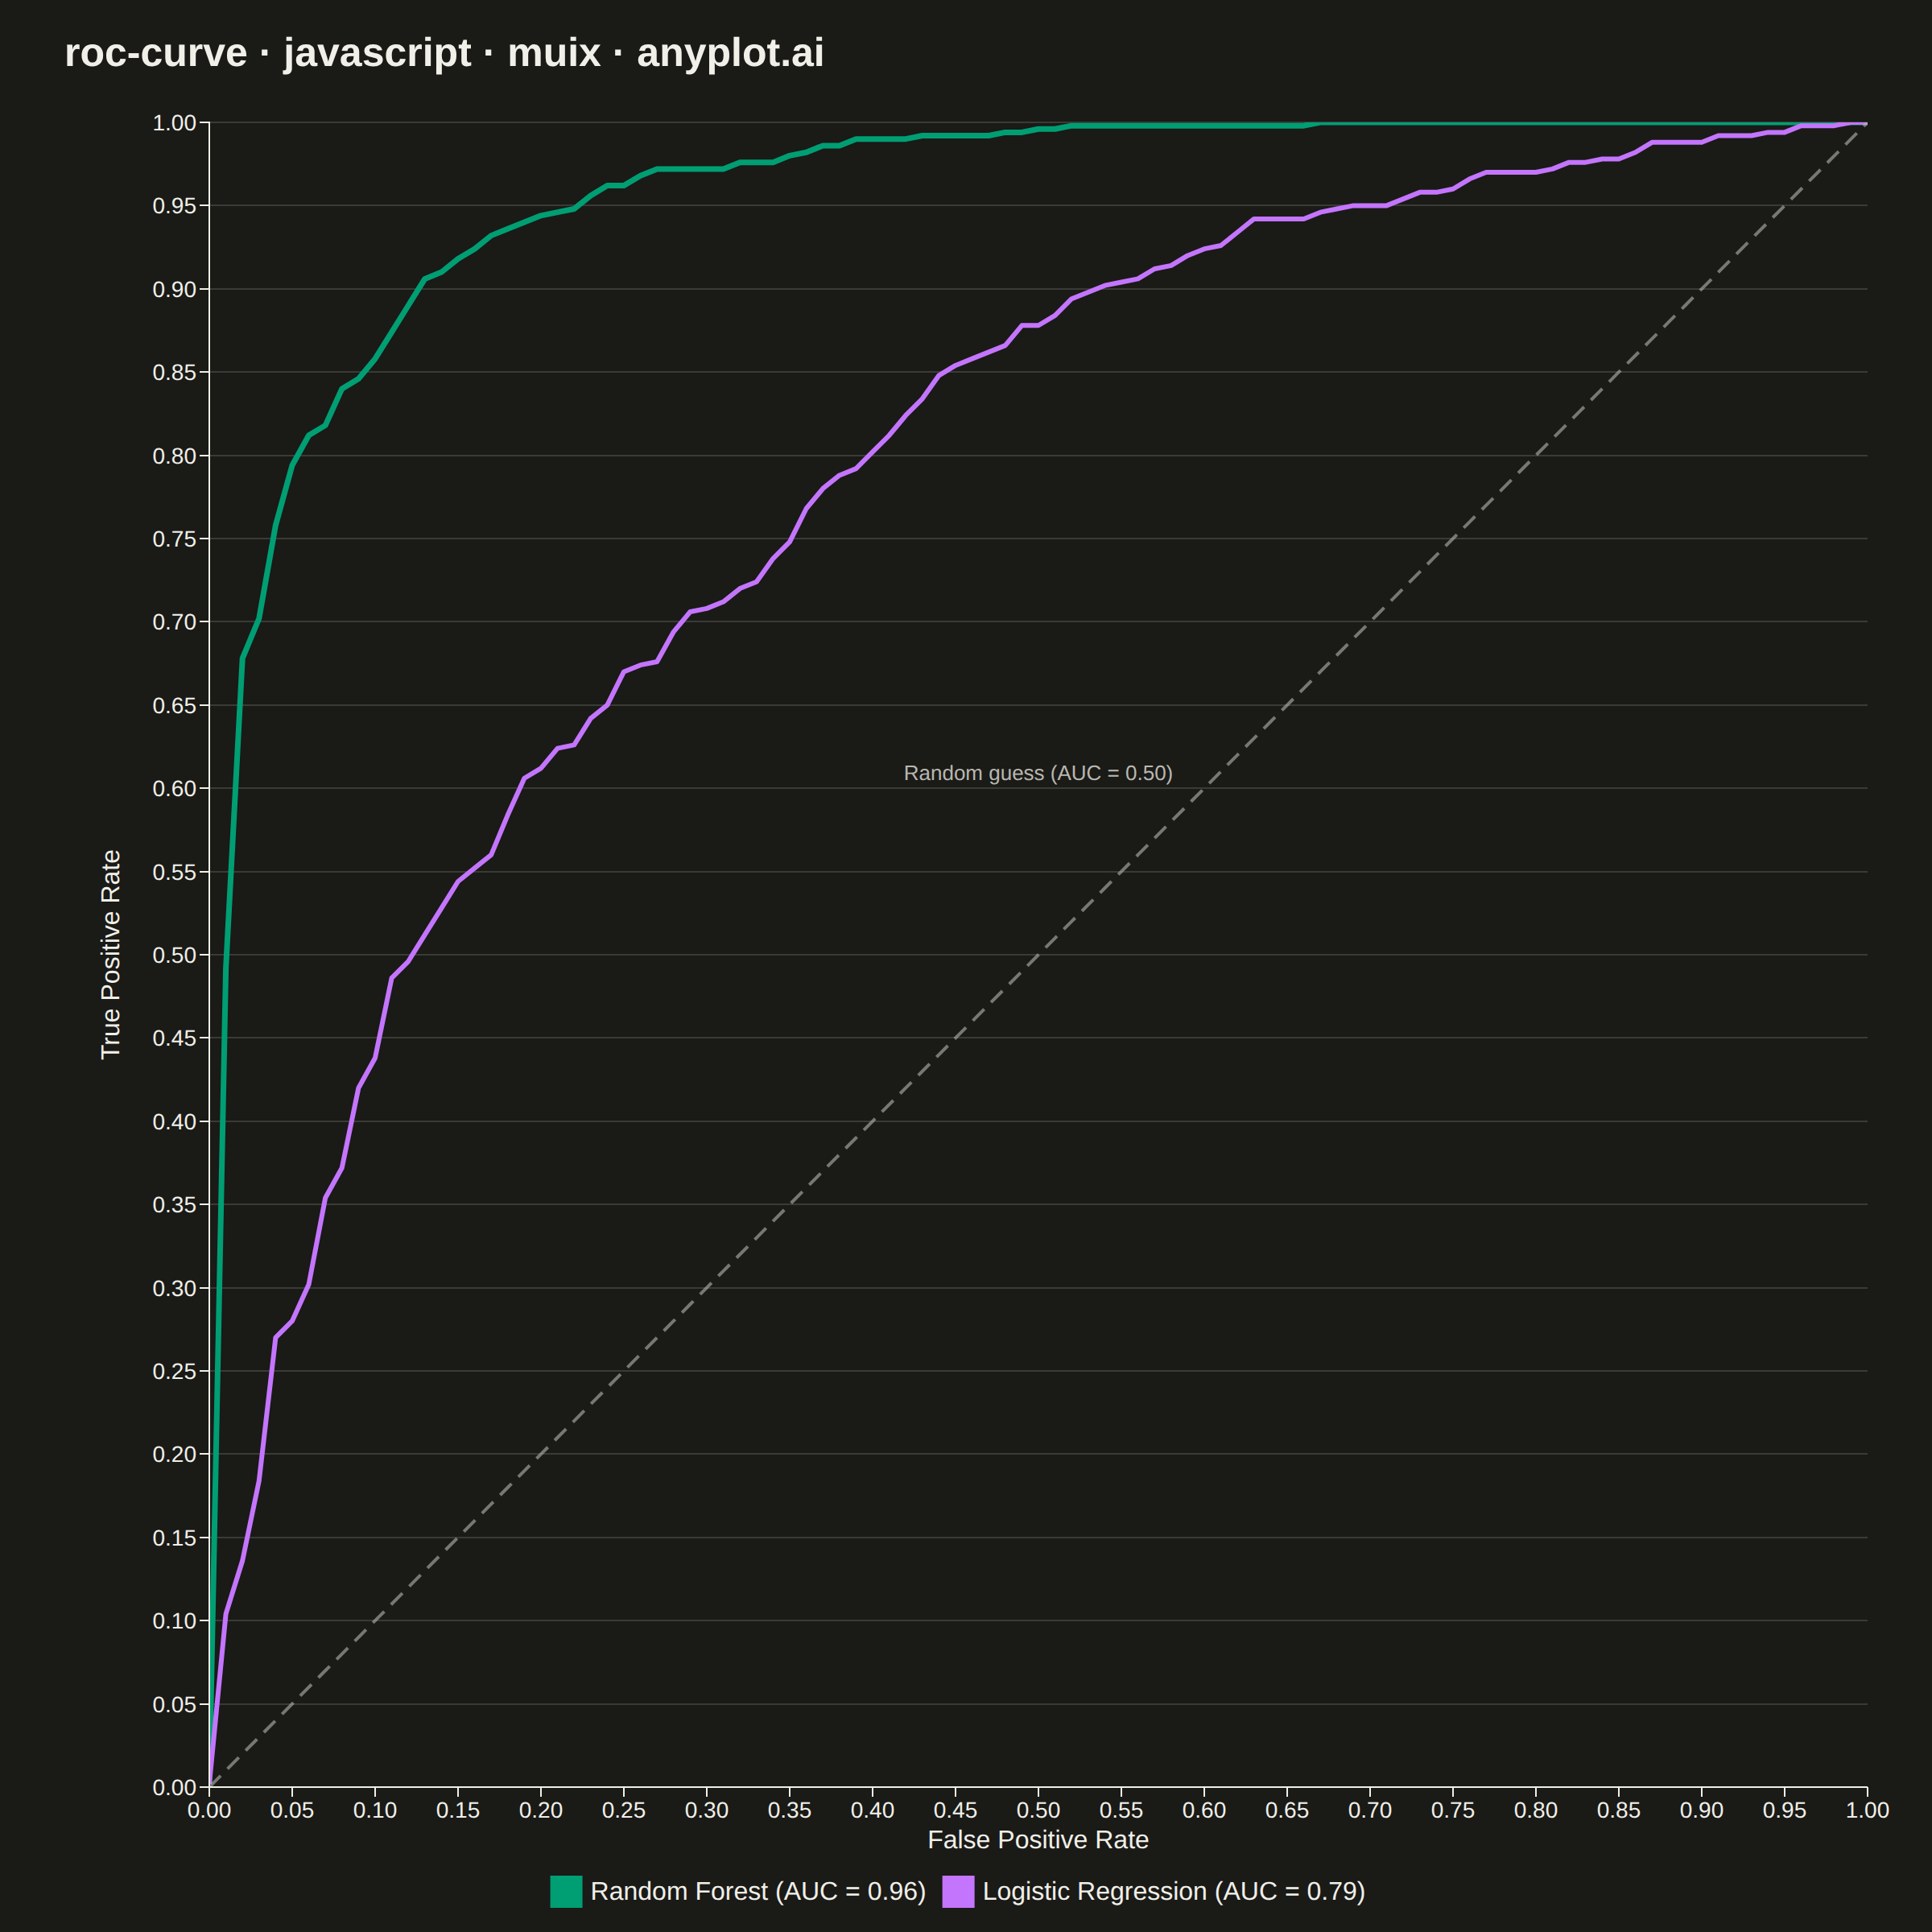
A Receiver Operating Characteristic (ROC) curve visualizes the performance of a binary classifier by plotting the True Positive Rate (TPR) against the False Positive Rate (FPR) at various classification thresholds. The Area Under the Curve (AUC) provides a single metric summarizing model performance, where 1.0 indicates perfect classification and 0.5 represents random guessing.
// anyplot.ai
// roc-curve: ROC Curve with AUC
// Library: muix 7.29.1 | JavaScript 22.23.2
// Quality: 91/100 | Created: 2026-09-05
//# anyplot-orientation: square
// anyplot.ai
// roc-curve: ROC Curve with AUC
// Library: muix 7.29.1 | JavaScript 22.23.2
// License: @mui/x-charts — MIT (community). Pro/Premium are out of scope.
// Quality: pending | Created: 2026-09-05
import { LineChart } from "@mui/x-charts/LineChart";
import { ChartsReferenceLine } from "@mui/x-charts/ChartsReferenceLine";
import Box from "@mui/material/Box";
import Typography from "@mui/material/Typography";

const t = window.ANYPLOT_TOKENS;

// --- Data (in-memory, deterministic) ----------------------------------------
// The ROC pipeline: lcg/randNormal synthesize classifier scores,
// rocFromScores sweeps every threshold into an empirical (fpr, tpr, auc)
// curve, and onGrid resamples that step function onto a shared FPR grid so
// both models plot against one xAxis.

// Tiny fixed-seed LCG — the browser has no seeded RNG
function lcg(seed: number) {
  let s = seed >>> 0;
  return () => {
    s = (Math.imul(1664525, s) + 1013904223) >>> 0;
    return s / 4294967295;
  };
}
const rand = lcg(42);

// Standard normal deviate via Box-Muller, driven by the LCG above.
function randNormal(mean: number, std: number) {
  const u1 = Math.max(rand(), 1e-9);
  const u2 = rand();
  const z = Math.sqrt(-2 * Math.log(u1)) * Math.cos(2 * Math.PI * u2);
  return mean + z * std;
}

// Simulate classifier scores for malignant (positive) vs. benign (negative)
// biopsy samples, then sweep every threshold to trace the empirical ROC
// curve — mirrors what sklearn.metrics.roc_curve produces from real
// predictions. AUC follows from the trapezoidal rule over the curve.
function rocFromScores(
  nPos: number,
  nNeg: number,
  meanPos: number,
  meanNeg: number,
  std: number,
) {
  const scored = [
    ...Array.from({ length: nPos }, () => ({
      s: randNormal(meanPos, std),
      label: 1,
    })),
    ...Array.from({ length: nNeg }, () => ({
      s: randNormal(meanNeg, std),
      label: 0,
    })),
  ].sort((a, b) => b.s - a.s);

  const fpr = [0];
  const tpr = [0];
  let tp = 0;
  let fp = 0;
  for (const { label } of scored) {
    if (label === 1) tp += 1;
    else fp += 1;
    fpr.push(fp / nNeg);
    tpr.push(tp / nPos);
  }

  let auc = 0;
  for (let i = 1; i < fpr.length; i++) {
    auc += ((fpr[i] - fpr[i - 1]) * (tpr[i] + tpr[i - 1])) / 2;
  }
  return { fpr, tpr, auc };
}

// Resample a step-function ROC curve onto a shared FPR grid so every series
// (both models plus the diagonal) can be plotted against one xAxis.
function onGrid(fpr: number[], tpr: number[], grid: number[]) {
  return grid.map((x) => {
    let i = 0;
    while (i < fpr.length - 1 && fpr[i + 1] < x) i += 1;
    const j = Math.min(i + 1, fpr.length - 1);
    if (fpr[j] === fpr[i]) return tpr[j];
    const frac = (x - fpr[i]) / (fpr[j] - fpr[i]);
    return tpr[i] + frac * (tpr[j] - tpr[i]);
  });
}

const N_SAMPLES = 500;
const GRID = Array.from({ length: 101 }, (_, i) => i / 100);

const forest = rocFromScores(N_SAMPLES, N_SAMPLES, 2.3, 0, 1);
const logistic = rocFromScores(N_SAMPLES, N_SAMPLES, 1.15, 0, 1);
const forestTpr = onGrid(forest.fpr, forest.tpr, GRID);
const logisticTpr = onGrid(logistic.fpr, logistic.tpr, GRID);

const TITLE = "roc-curve · javascript · muix · anyplot.ai";
const TITLE_H = 56;

// --- Chart (default-exported component — the harness mounts it) -----------

export default function Chart() {
  const { width, height } = window.ANYPLOT_SIZE;

  return (
    <Box
      sx={{
        width,
        height,
        bgcolor: t.pageBg,
        display: "flex",
        flexDirection: "column",
      }}
    >
      <Box
        sx={{
          height: TITLE_H,
          display: "flex",
          alignItems: "center",
          px: "40px",
          pt: "10px",
        }}
      >
        <Typography
          sx={{
            color: t.ink,
            fontSize: "25px",
            fontWeight: 600,
            lineHeight: 1,
          }}
        >
          {TITLE}
        </Typography>
      </Box>

      <LineChart
        width={width}
        height={height - TITLE_H}
        skipAnimation
        grid={{ horizontal: true }}
        xAxis={[
          {
            data: GRID,
            scaleType: "linear",
            min: 0,
            max: 1,
            label: "False Positive Rate",
            tickLabelStyle: { fontSize: 14 },
            labelStyle: { fontSize: 16 },
          },
        ]}
        yAxis={[
          {
            min: 0,
            max: 1,
            label: "True Positive Rate",
            // tickFontSize drives the auto-computed label offset (see MUI X
            // ChartsYAxis: labelRefPoint.x = -(tickFontSize + tickSize + 10));
            // set it wide enough to clear the "0.XX"-style tick text, while
            // tickLabelStyle.fontSize keeps the rendered tick size correct.
            tickFontSize: 40,
            tickLabelStyle: { fontSize: 14 },
            labelStyle: { fontSize: 16 },
          },
        ]}
        series={[
          {
            id: "forest",
            data: forestTpr,
            label: `Random Forest (AUC = ${forest.auc.toFixed(2)})`,
            color: t.palette[0],
            showMark: false,
            curve: "linear",
          },
          {
            id: "logistic",
            data: logisticTpr,
            label: `Logistic Regression (AUC = ${logistic.auc.toFixed(2)})`,
            color: t.palette[1],
            showMark: false,
            curve: "linear",
          },
          {
            // No `label`: this is the y=x reference, not a fitted model, so
            // it's excluded from the legend (see ChartsReferenceLine below,
            // which annotates it directly on the chart instead).
            id: "baseline",
            data: GRID,
            color: t.inkSoft,
            showMark: false,
            curve: "linear",
          },
        ]}
        margin={{ top: 20, bottom: 90, left: 130, right: 40 }}
        sx={{
          "& .MuiLineElement-series-forest": { strokeWidth: 3.5 },
          "& .MuiLineElement-series-logistic": { strokeWidth: 3 },
          "& .MuiLineElement-series-baseline": {
            strokeDasharray: "10 6",
            strokeWidth: 2,
            strokeOpacity: 0.6,
          },
          "& .MuiChartsGrid-line": { stroke: t.grid, strokeWidth: 1 },
        }}
        slotProps={{
          legend: {
            direction: "row",
            position: { vertical: "bottom", horizontal: "middle" },
          },
        }}
      >
        {/* Annotates the dashed "baseline" series in place of a legend
            entry — the reference line's own stroke is hidden (it would
            otherwise duplicate the horizontal gridline); only its label
            renders, horizontally centered above (FPR=0.5, TPR=0.5) where the
            diagonal data series crosses, clear of the line itself. */}
        <ChartsReferenceLine
          y={0.6}
          label="Random guess (AUC = 0.50)"
          lineStyle={{ stroke: "none" }}
          labelStyle={{ fill: t.inkSoft, fontSize: 13 }}
        />
      </LineChart>
    </Box>
  );
}
Runnable source as JSON, for any HTTP client: https://api.anyplot.ai/specs/roc-curve/muix/code. Any spec id and library id listed in llms-full.txt fit the same URL shape; every URL below is complete and callable.
{
  "spec_id": "roc-curve",
  "language": "javascript",
  "library": "muix",
  "page": "https://anyplot.ai/roc-curve/javascript/muix",
  "hub": "https://anyplot.ai/roc-curve",
  "code_json": "https://api.anyplot.ai/specs/roc-curve/muix/code",
  "spec_json": "https://api.anyplot.ai/specs/roc-curve",
  "render_light_png": "https://storage.googleapis.com/anyplot-images/plots/roc-curve/javascript/muix/plot-light.png",
  "render_dark_png": "https://storage.googleapis.com/anyplot-images/plots/roc-curve/javascript/muix/plot-dark.png",
  "interactive_light_html": "https://storage.googleapis.com/anyplot-images/plots/roc-curve/javascript/muix/plot-light.html",
  "interactive_dark_html": "https://storage.googleapis.com/anyplot-images/plots/roc-curve/javascript/muix/plot-dark.html",
  "quality_score": 91.0,
  "license": "MIT",
  "guide": "https://anyplot.ai/llms.txt"
}
Part of ROC Curve with AUC on anyplot.ai.