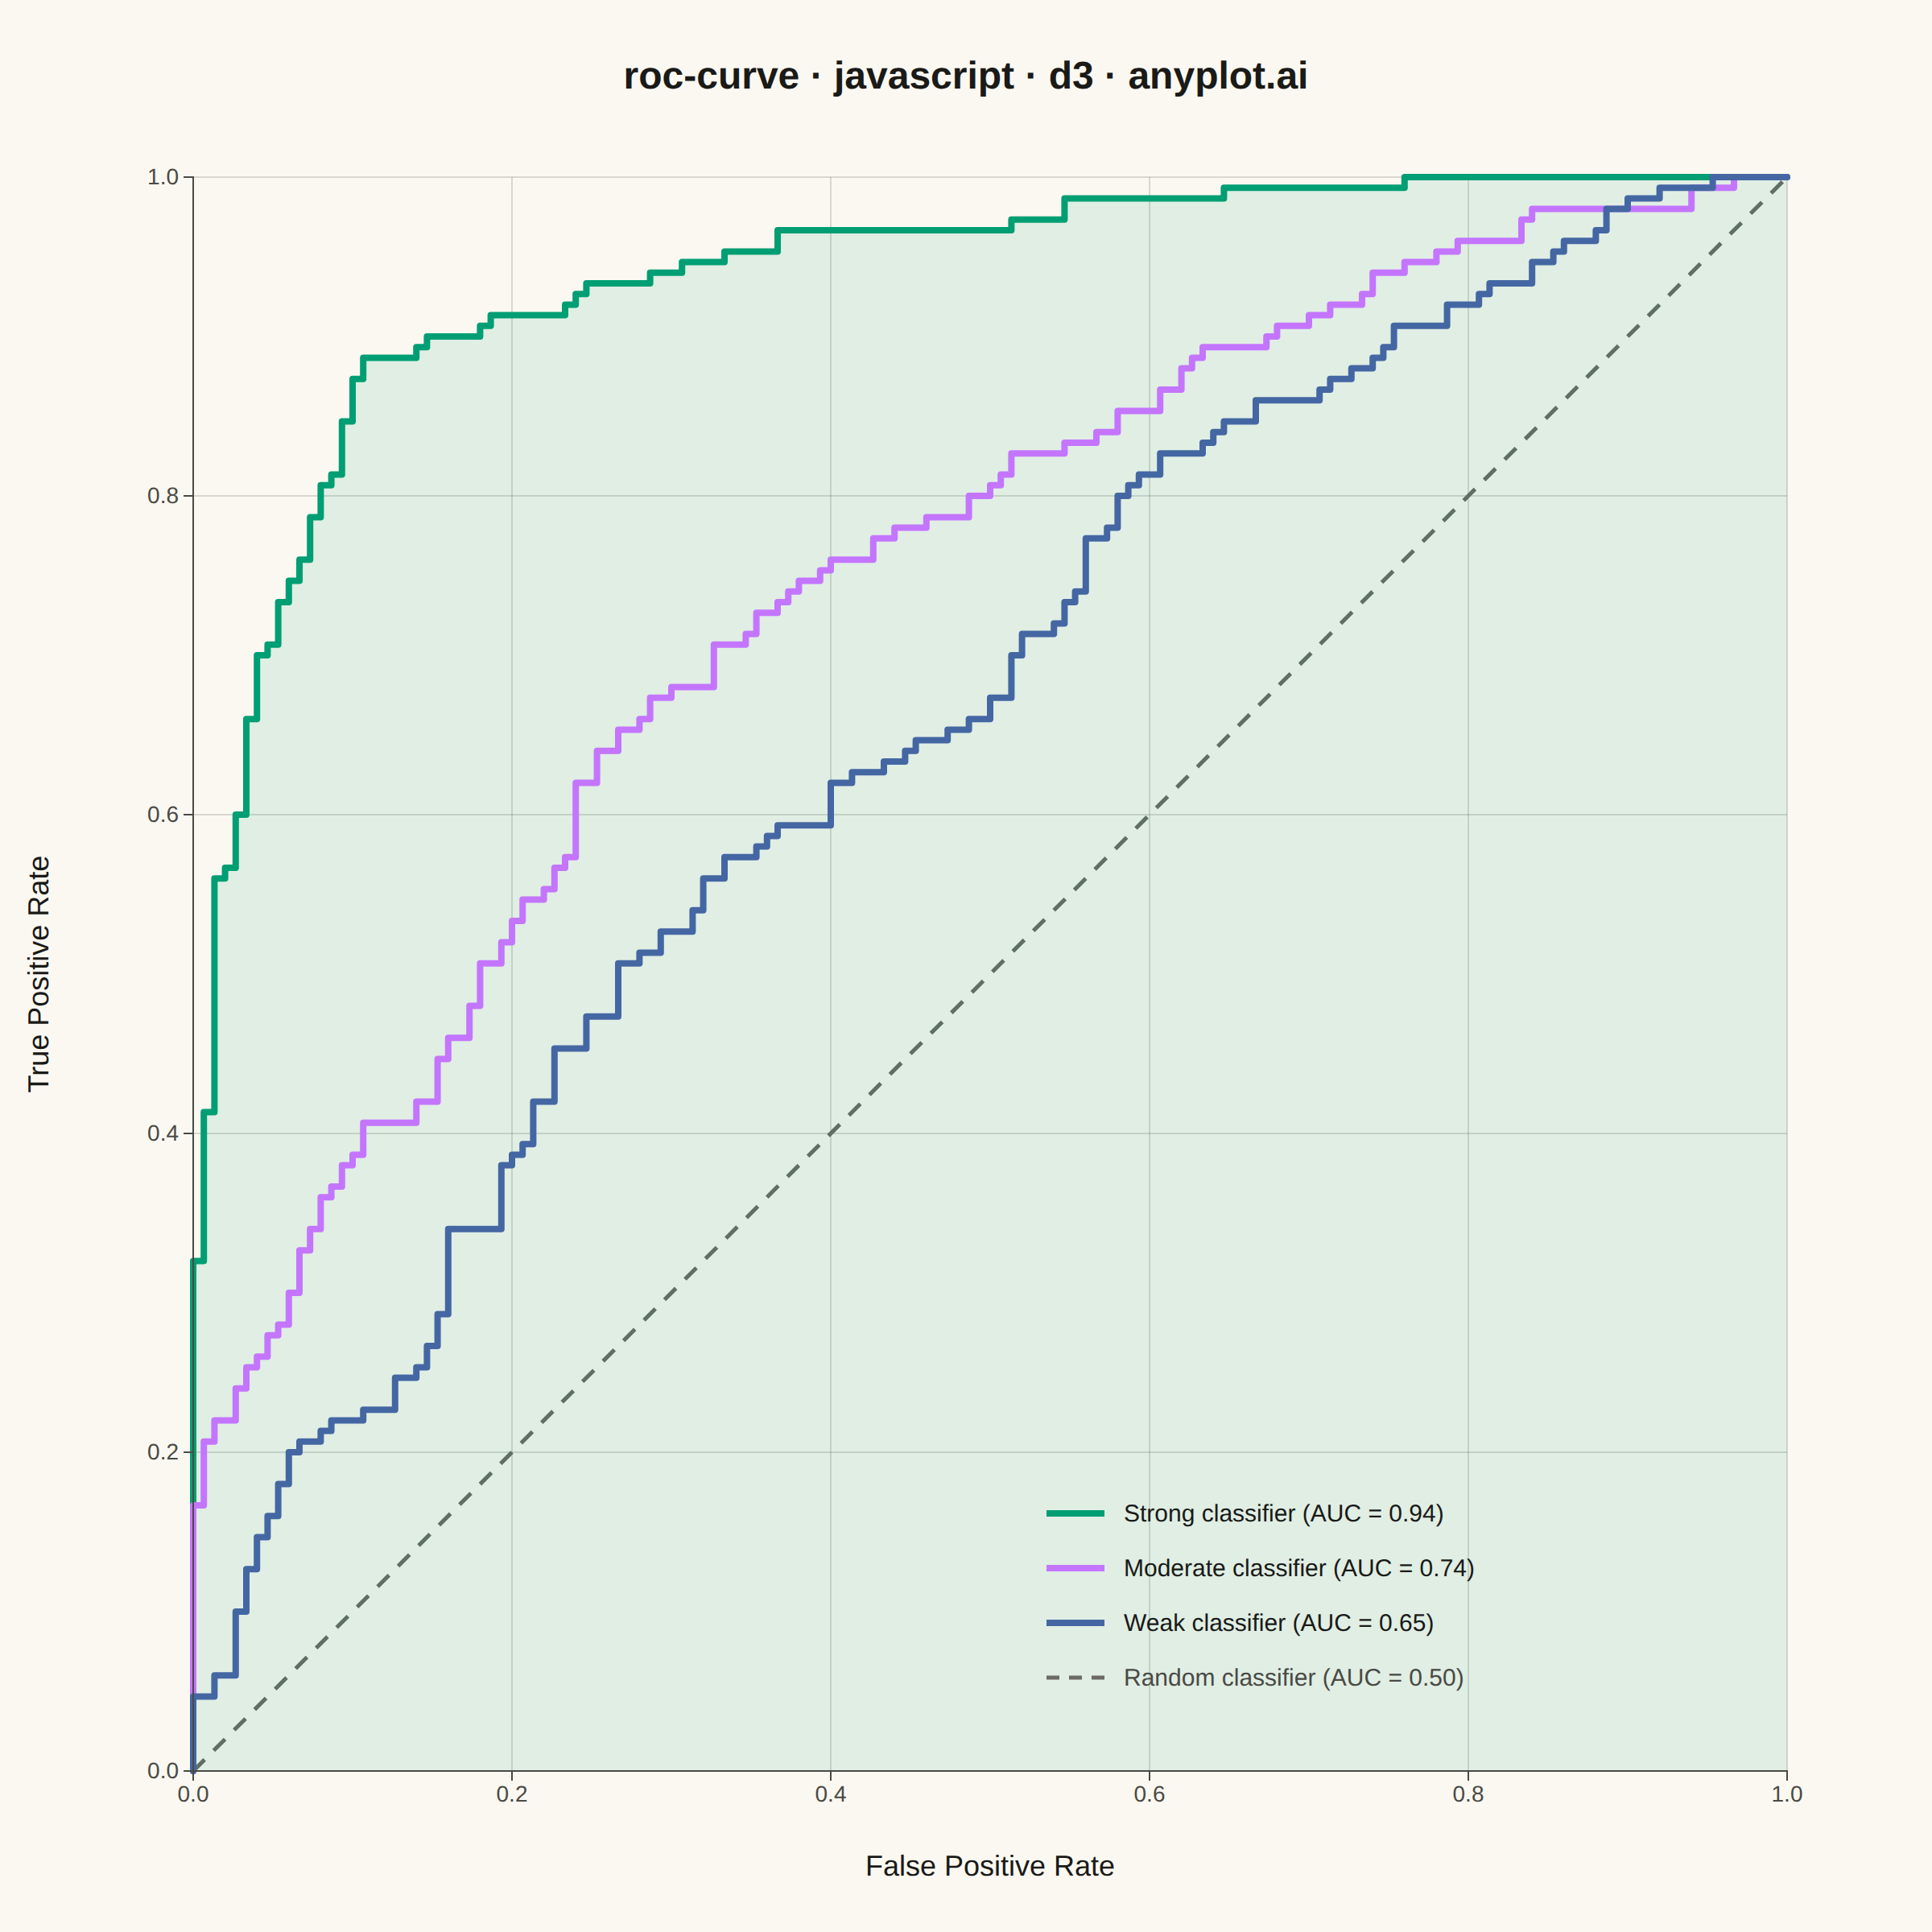
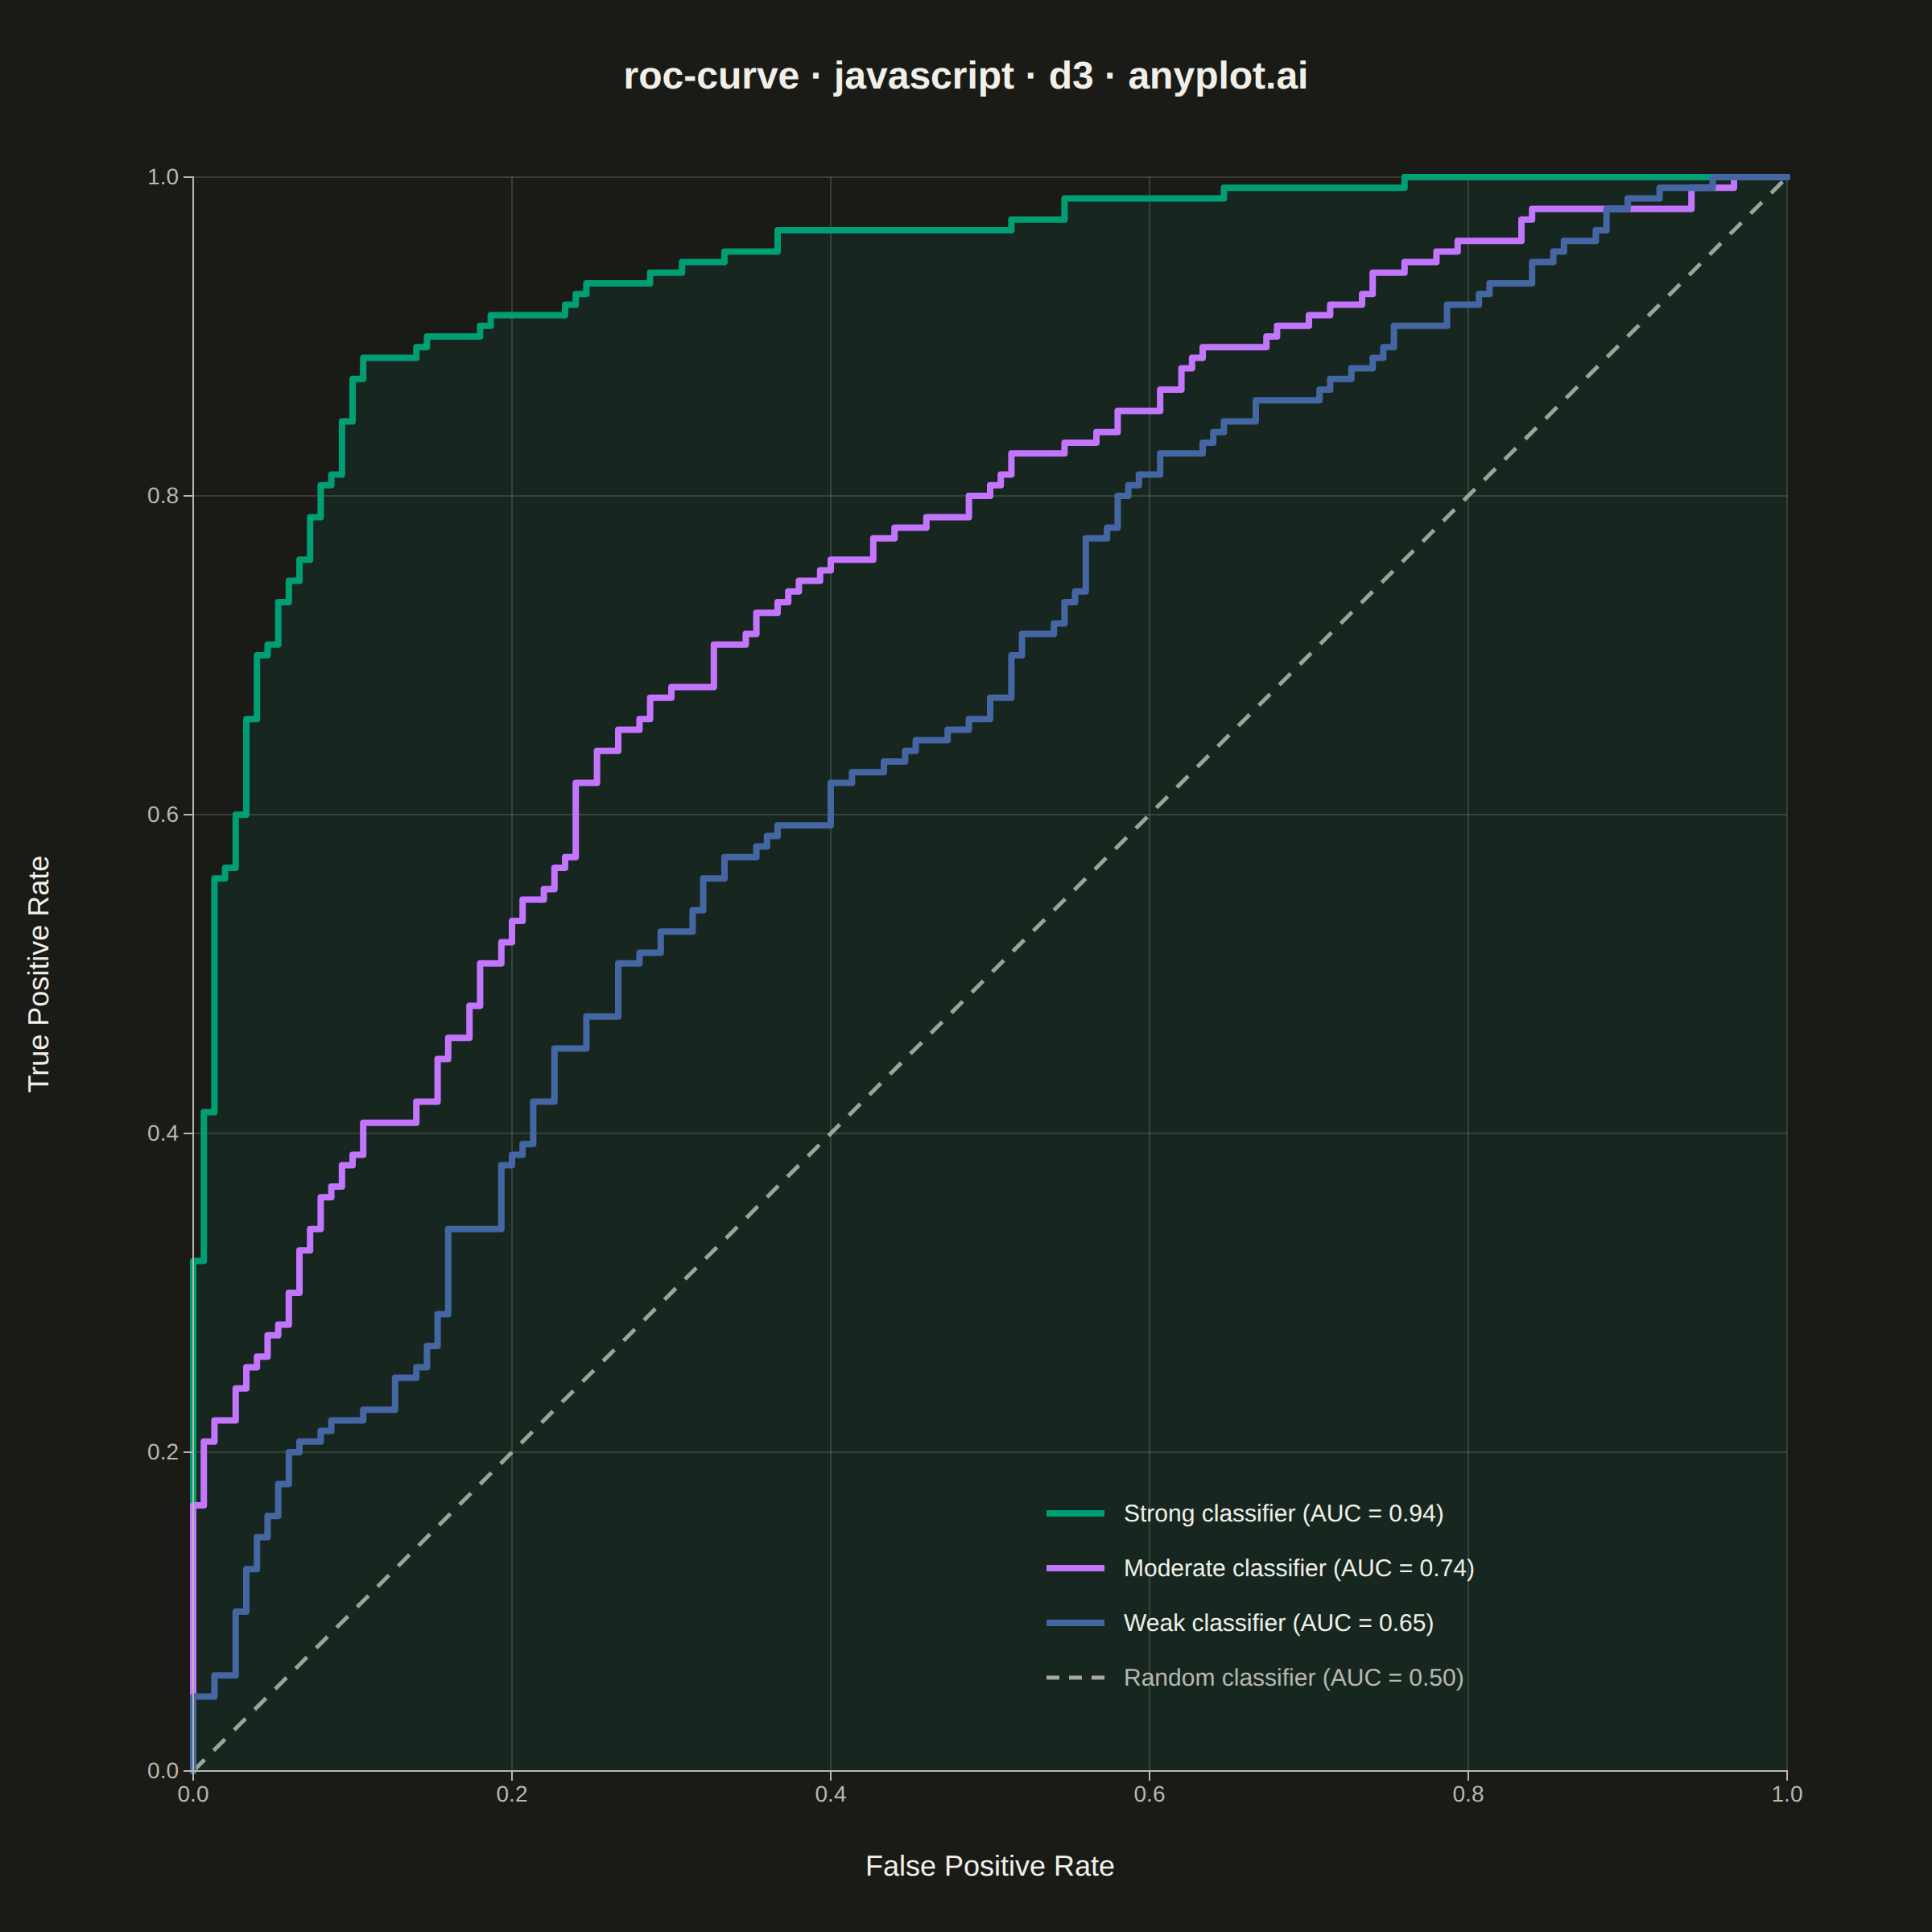
The same plot in 14 other libraries — JavaScript: Chart.js, Apache ECharts, Highcharts, MUI X Charts; Python: Altair, Bokeh, lets-plot, Matplotlib, Plotly, plotnine, Pygal, Seaborn; R: ggplot2; Julia: Makie.jl. Compare all 15 side by side: ROC Curve with AUC in Python, R, Julia and JavaScript.
A Receiver Operating Characteristic (ROC) curve visualizes the performance of a binary classifier by plotting the True Positive Rate (TPR) against the False Positive Rate (FPR) at various classification thresholds. The Area Under the Curve (AUC) provides a single metric summarizing model performance, where 1.0 indicates perfect classification and 0.5 represents random guessing.
// anyplot.ai
// roc-curve: ROC Curve with AUC
// Library: d3 7.9.0 | JavaScript 22.23.2
// Quality: 91/100 | Created: 2026-09-05
//# anyplot-orientation: square

const t = window.ANYPLOT_TOKENS;
const isDark = window.ANYPLOT_THEME === "dark";
const muted = isDark ? "#A8A79F" : "#6B6A63"; // Imprint semantic anchor: muted
const { width, height } = window.ANYPLOT_SIZE;
const margin = { top: 110, right: 90, bottom: 100, left: 120 };
const iw = width - margin.left - margin.right;
const ih = height - margin.top - margin.bottom;

// --- Data: three synthetic diagnostic-test classifiers of varying skill, each
// built from a deterministic LCG (own seed per model, so runs stay reproducible
// and independent of each other) ---------------------------------------------
function makeLcg(seed) {
  let state = seed >>> 0;
  return () => {
    state = (state * 1664525 + 1013904223) >>> 0;
    return state / 4294967296;
  };
}
const clamp01 = (v) => Math.min(1, Math.max(0, v));

function buildRoc({ seed, muDiseased, muHealthy, sd }) {
  const rand = makeLcg(seed);
  function randNormal() {
    const u1 = Math.max(rand(), 1e-9);
    const u2 = rand();
    return Math.sqrt(-2 * Math.log(u1)) * Math.cos(2 * Math.PI * u2);
  }

  const nDiseased = 150;
  const nHealthy = 150;
  const diseasedScores = Array.from({ length: nDiseased }, () => clamp01(muDiseased + sd * randNormal()));
  const healthyScores = Array.from({ length: nHealthy }, () => clamp01(muHealthy + sd * randNormal()));

  const labeledScores = [
    ...diseasedScores.map((score) => ({ score, isDiseased: true })),
    ...healthyScores.map((score) => ({ score, isDiseased: false })),
  ].sort((a, b) => b.score - a.score);

  // Sweep the decision threshold from high to low, accumulating hits/misses —
  // the same construction sklearn.metrics.roc_curve uses on predicted scores.
  let truePositives = 0;
  let falsePositives = 0;
  const points = [{ fpr: 0, tpr: 0 }];
  for (const { isDiseased } of labeledScores) {
    if (isDiseased) truePositives += 1;
    else falsePositives += 1;
    points.push({ fpr: falsePositives / nHealthy, tpr: truePositives / nDiseased });
  }

  let auc = 0;
  for (let i = 1; i < points.length; i++) {
    const a = points[i - 1];
    const b = points[i];
    auc += ((b.fpr - a.fpr) * (a.tpr + b.tpr)) / 2;
  }
  return { points, auc };
}

const models = [
  { name: "Strong classifier", seed: 42, muDiseased: 0.66, muHealthy: 0.34, sd: 0.16 },
  { name: "Moderate classifier", seed: 7, muDiseased: 0.6, muHealthy: 0.4, sd: 0.2 },
  { name: "Weak classifier", seed: 99, muDiseased: 0.56, muHealthy: 0.44, sd: 0.24 },
].map((spec) => ({ ...spec, ...buildRoc(spec) }));

const color = d3
  .scaleOrdinal()
  .domain(models.map((m) => m.name))
  .range(t.palette);

// --- SVG mount ---------------------------------------------------------------
const svg = d3.select("#container").append("svg").attr("width", width).attr("height", height);
const g = svg.append("g").attr("transform", `translate(${margin.left},${margin.top})`);

// --- Scales — equal-aspect: iw === ih so an FPR unit spans the same pixels
// as a TPR unit, per the spec's "equal aspect ratio preferred" note ---------
const x = d3.scaleLinear().domain([0, 1]).range([0, iw]);
const y = d3.scaleLinear().domain([0, 1]).range([ih, 0]);

// --- Gridlines -----------------------------------------------------------
g.append("g")
  .selectAll("line")
  .data(x.ticks(5))
  .join("line")
  .attr("x1", (d) => x(d))
  .attr("x2", (d) => x(d))
  .attr("y1", 0)
  .attr("y2", ih)
  .attr("stroke", t.grid);
g.append("g")
  .selectAll("line")
  .data(y.ticks(5))
  .join("line")
  .attr("x1", 0)
  .attr("x2", iw)
  .attr("y1", (d) => y(d))
  .attr("y2", (d) => y(d))
  .attr("stroke", t.grid);

// --- Diagonal reference line (random classifier, y = x) ---------------------
g.append("line")
  .attr("x1", x(0))
  .attr("y1", y(0))
  .attr("x2", x(1))
  .attr("y2", y(1))
  .attr("stroke", muted)
  .attr("stroke-width", 2.5)
  .attr("stroke-dasharray", "10,8");

// --- Area fill under the strongest curve only, to keep a single focal point,
// then the ROC curve for each model in its own Imprint color -----------------
const area = d3
  .area()
  .x((d) => x(d.fpr))
  .y0(ih)
  .y1((d) => y(d.tpr));
g.append("path").datum(models[0].points).attr("fill", color(models[0].name)).attr("opacity", 0.1).attr("d", area);

const line = d3
  .line()
  .x((d) => x(d.fpr))
  .y((d) => y(d.tpr));
g.selectAll(".roc-line")
  .data(models)
  .join("path")
  .attr("class", "roc-line")
  .attr("fill", "none")
  .attr("stroke", (d) => color(d.name))
  .attr("stroke-width", 4)
  .attr("stroke-linejoin", "round")
  .attr("stroke-linecap", "round")
  .attr("d", (d) => line(d.points));

// --- Axes -------------------------------------------------------------------
const xAxis = g
  .append("g")
  .attr("transform", `translate(0,${ih})`)
  .call(d3.axisBottom(x).ticks(5).tickFormat(d3.format(".1f")));
const yAxis = g.append("g").call(d3.axisLeft(y).ticks(5).tickFormat(d3.format(".1f")));
for (const ax of [xAxis, yAxis]) {
  ax.selectAll("text").attr("fill", t.inkSoft).style("font-size", "14px");
  ax.selectAll("line").attr("stroke", t.inkSoft);
  ax.select(".domain").attr("stroke", t.inkSoft);
}

// --- Axis labels --------------------------------------------------------------
g.append("text")
  .attr("x", iw / 2)
  .attr("y", ih + 65)
  .attr("text-anchor", "middle")
  .attr("fill", t.ink)
  .style("font-size", "18px")
  .text("False Positive Rate");
g.append("text")
  .attr("transform", "rotate(-90)")
  .attr("x", -ih / 2)
  .attr("y", -90)
  .attr("text-anchor", "middle")
  .attr("fill", t.ink)
  .style("font-size", "18px")
  .text("True Positive Rate");

// --- Legend (bottom-right — every ROC curve stays at/above the diagonal, so
// the low-TPR/high-FPR corner below it stays clear of the data) --------------
const legendEntries = [
  ...models.map((m) => ({ label: `${m.name} (AUC = ${m.auc.toFixed(2)})`, stroke: color(m.name), dash: null })),
  { label: "Random classifier (AUC = 0.50)", stroke: muted, dash: "8,6" },
];
const legend = g.append("g").attr("transform", `translate(${iw - 460}, ${ih - 160})`);
const rows = legend
  .selectAll(".legend-row")
  .data(legendEntries)
  .join("g")
  .attr("class", "legend-row")
  .attr("transform", (_, i) => `translate(0, ${i * 34})`);
rows
  .append("line")
  .attr("x1", 0)
  .attr("x2", 36)
  .attr("y1", 0)
  .attr("y2", 0)
  .attr("stroke", (d) => d.stroke)
  .attr("stroke-width", (d) => (d.dash ? 2.5 : 4))
  .attr("stroke-dasharray", (d) => d.dash);
rows
  .append("text")
  .attr("x", 48)
  .attr("y", 5)
  .attr("fill", (d, i) => (i === legendEntries.length - 1 ? t.inkSoft : t.ink))
  .style("font-size", "15px")
  .text((d) => d.label);

// --- Title --------------------------------------------------------------------
svg
  .append("text")
  .attr("x", width / 2)
  .attr("y", 55)
  .attr("text-anchor", "middle")
  .attr("fill", t.ink)
  .style("font-size", "24px")
  .style("font-weight", "600")
  .text("roc-curve · javascript · d3 · anyplot.ai");
Runnable source as JSON, for any HTTP client: https://api.anyplot.ai/specs/roc-curve/d3/code. Any spec id and library id listed in llms-full.txt fit the same URL shape; every URL below is complete and callable.
{
  "spec_id": "roc-curve",
  "language": "javascript",
  "library": "d3",
  "page": "https://anyplot.ai/roc-curve/javascript/d3",
  "hub": "https://anyplot.ai/roc-curve",
  "code_json": "https://api.anyplot.ai/specs/roc-curve/d3/code",
  "spec_json": "https://api.anyplot.ai/specs/roc-curve",
  "render_light_png": "https://storage.googleapis.com/anyplot-images/plots/roc-curve/javascript/d3/plot-light.png",
  "render_dark_png": "https://storage.googleapis.com/anyplot-images/plots/roc-curve/javascript/d3/plot-dark.png",
  "interactive_light_html": "https://storage.googleapis.com/anyplot-images/plots/roc-curve/javascript/d3/plot-light.html",
  "interactive_dark_html": "https://storage.googleapis.com/anyplot-images/plots/roc-curve/javascript/d3/plot-dark.html",
  "quality_score": 91.0,
  "license": "MIT",
  "guide": "https://anyplot.ai/llms.txt"
}
Part of ROC Curve with AUC on anyplot.ai.