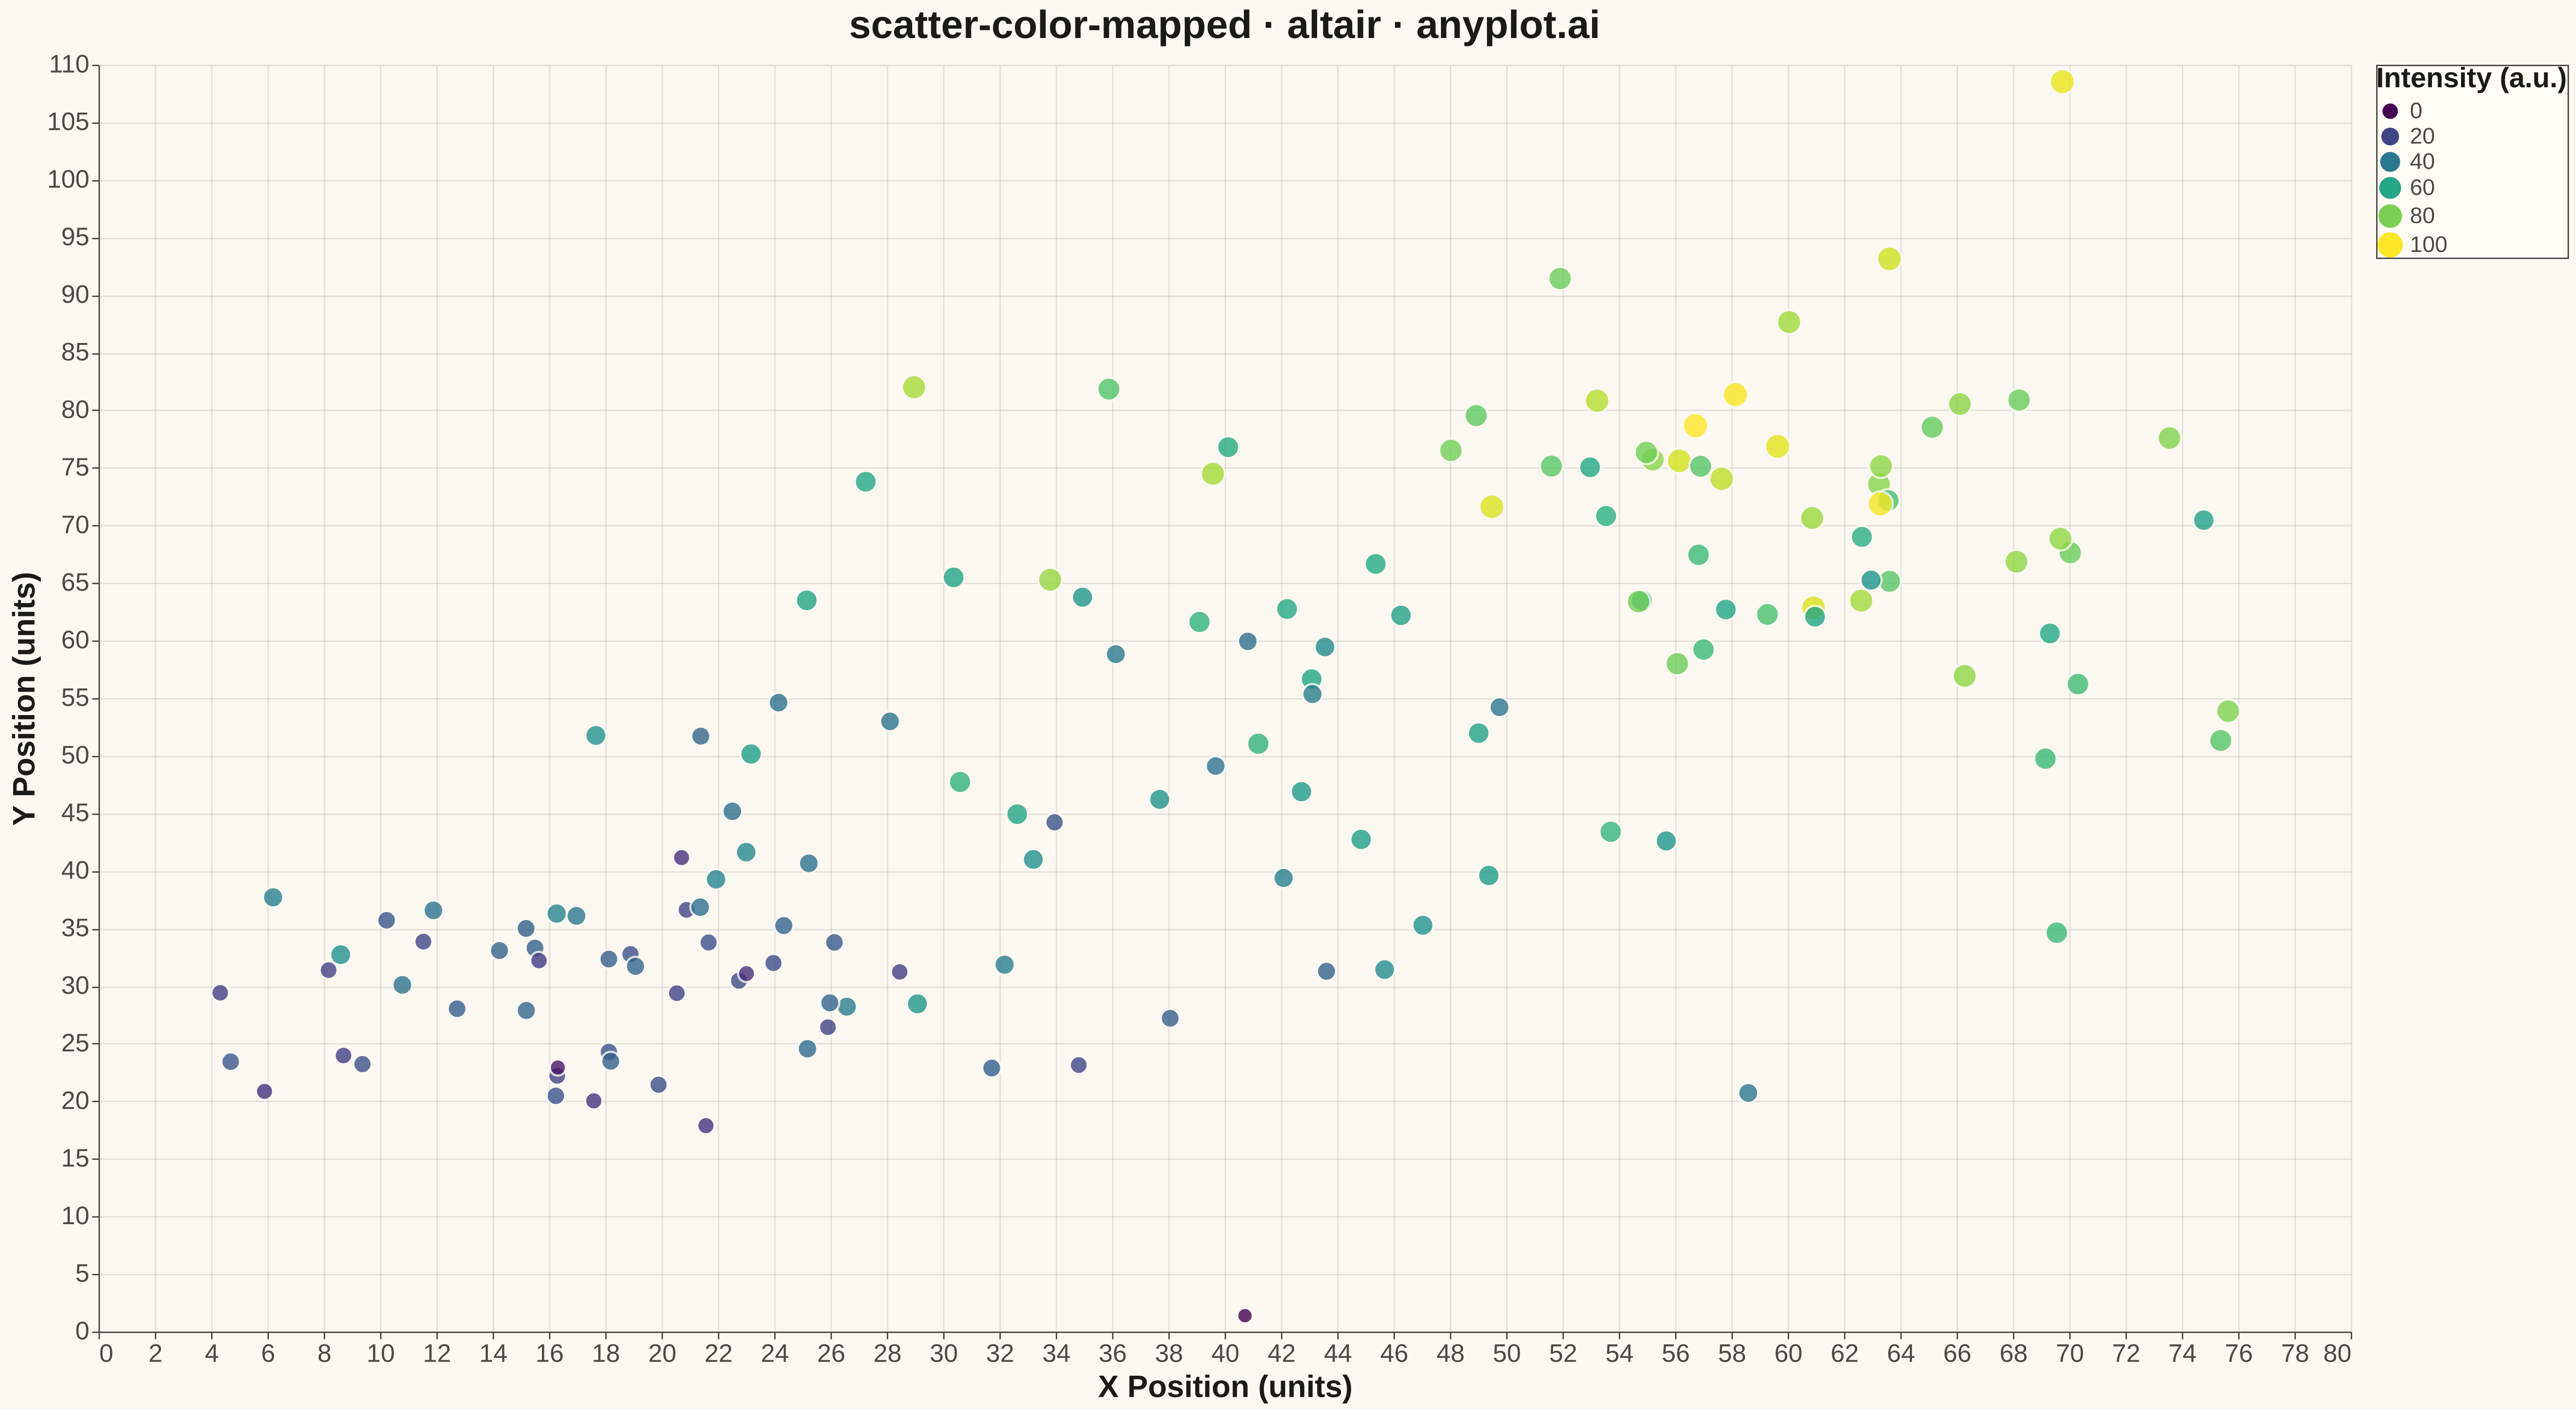
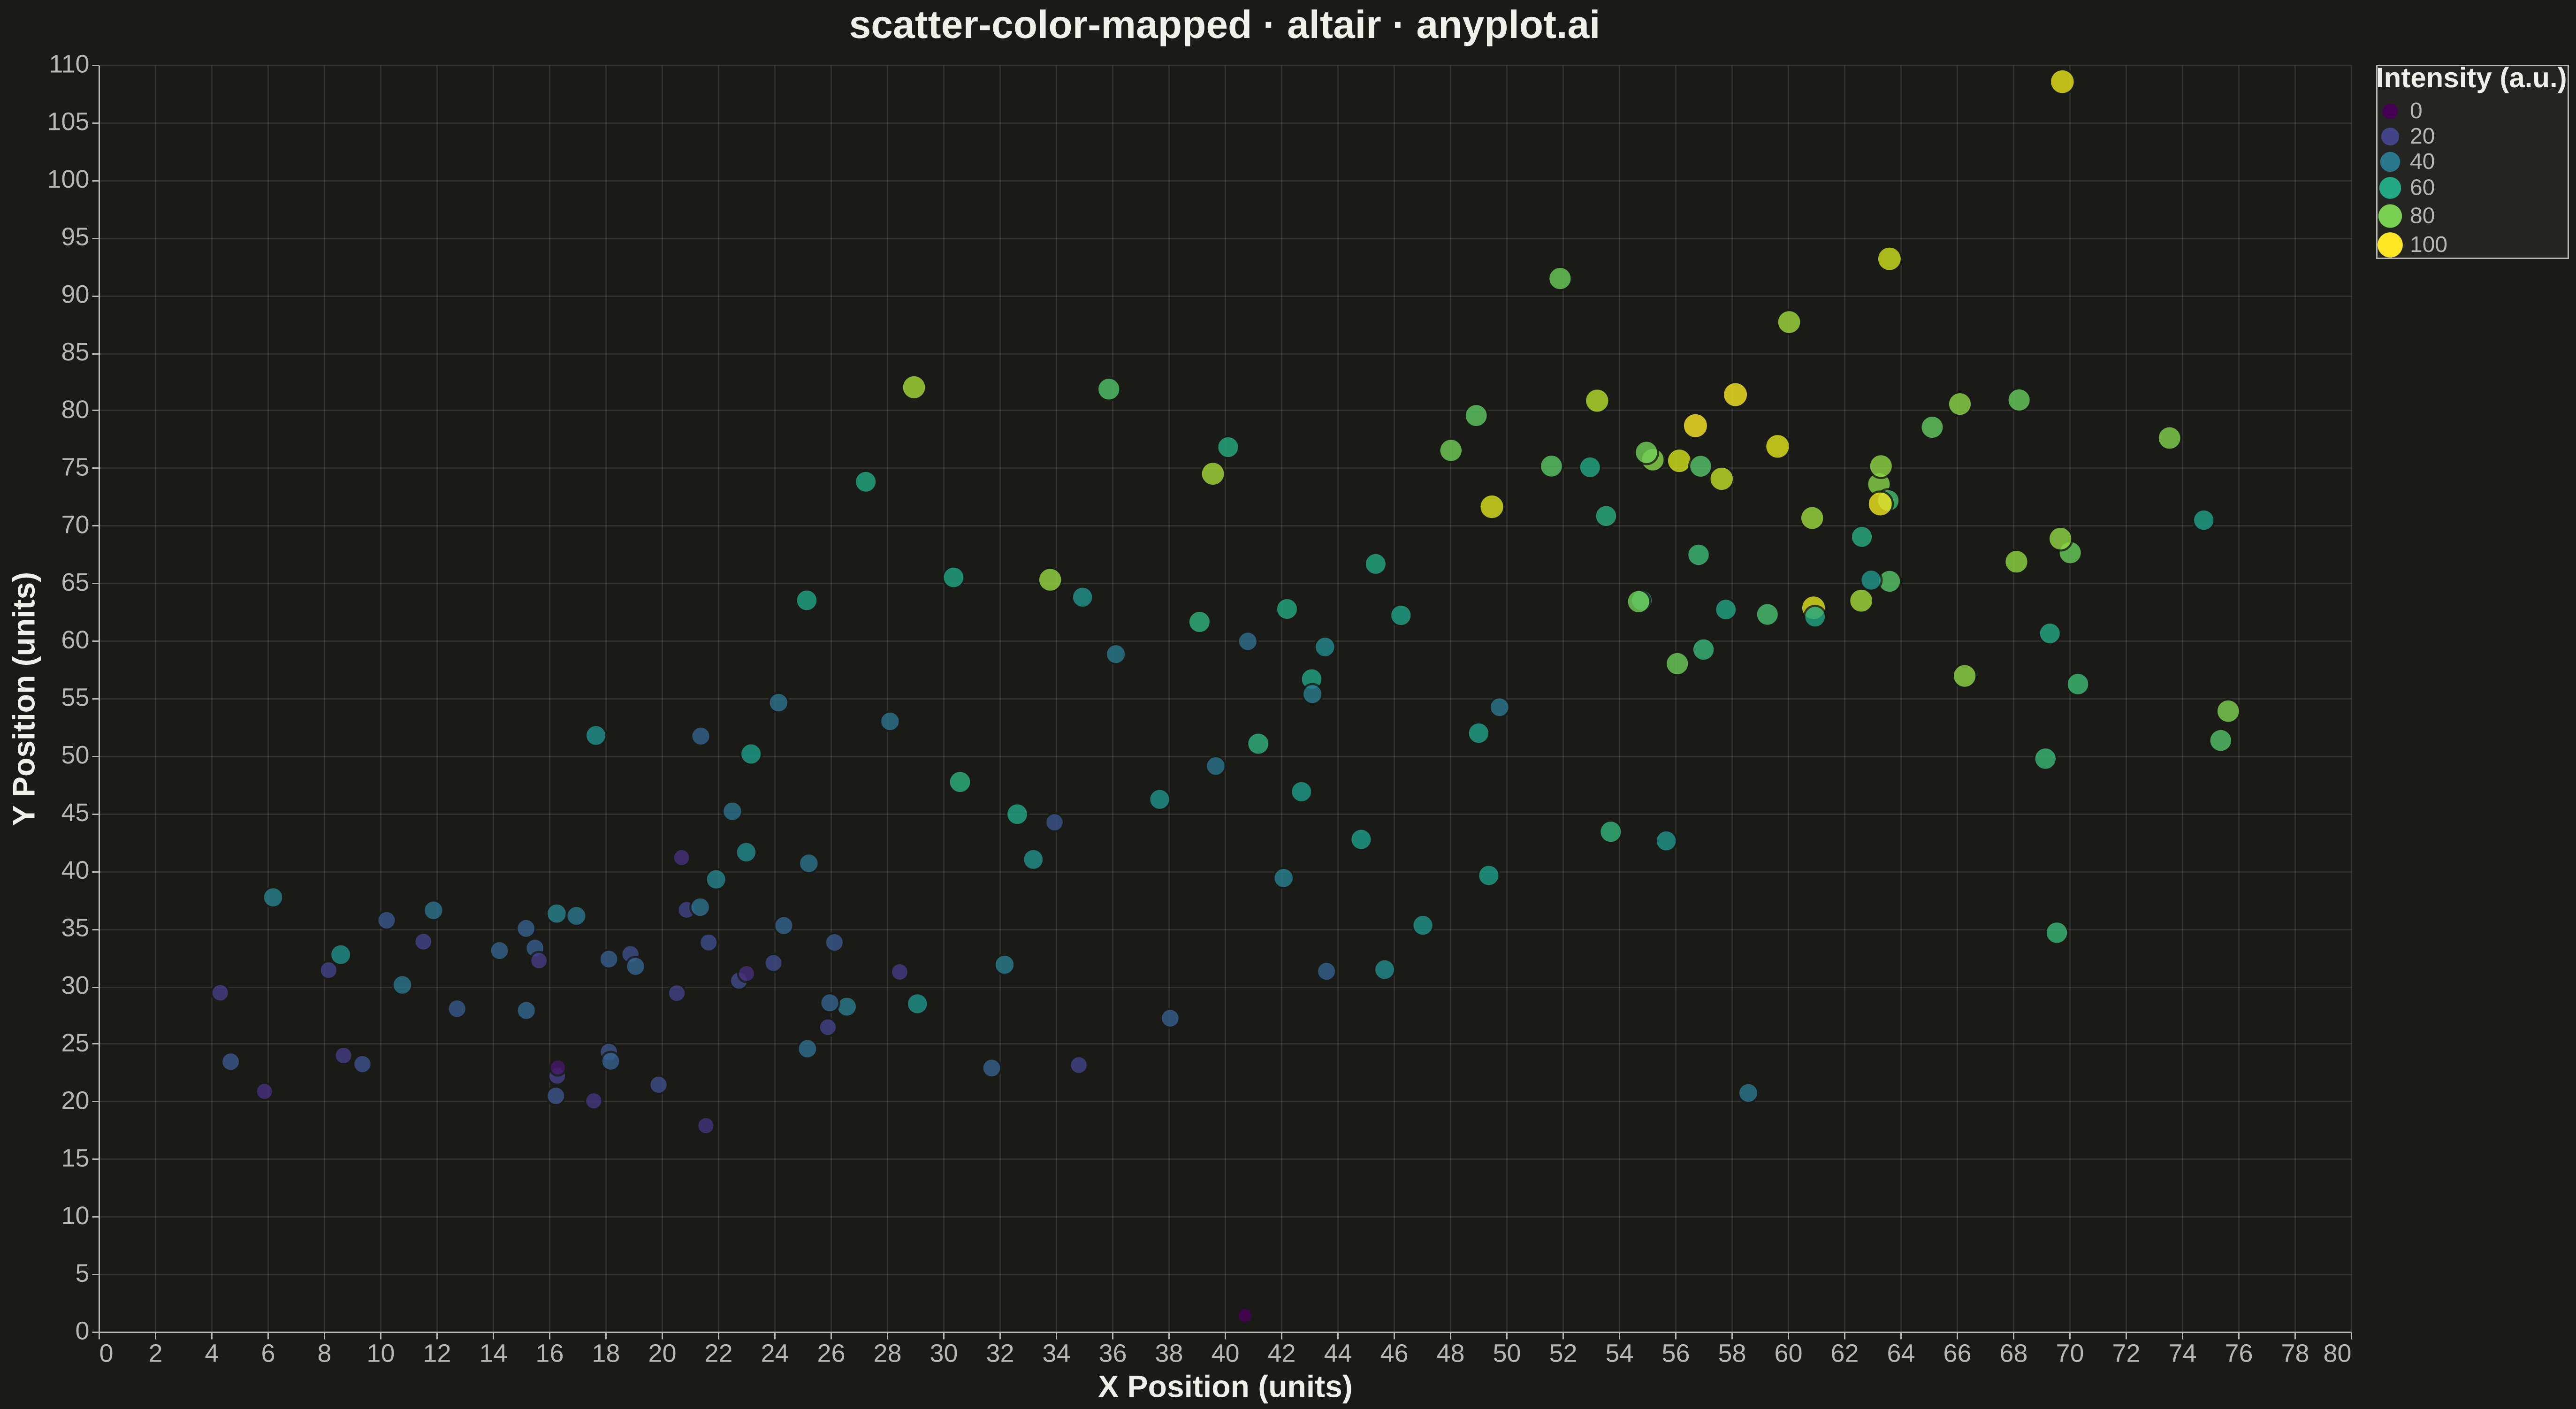
A scatter plot that encodes a third continuous variable using a colormap, allowing visualization of three dimensions on a 2D plane. This visualization is essential for exploring multivariate relationships where the third variable represents intensity, magnitude, or any continuous measurement. A colorbar provides a reference scale for interpreting the color values.
Preview render from the Altair implementation.