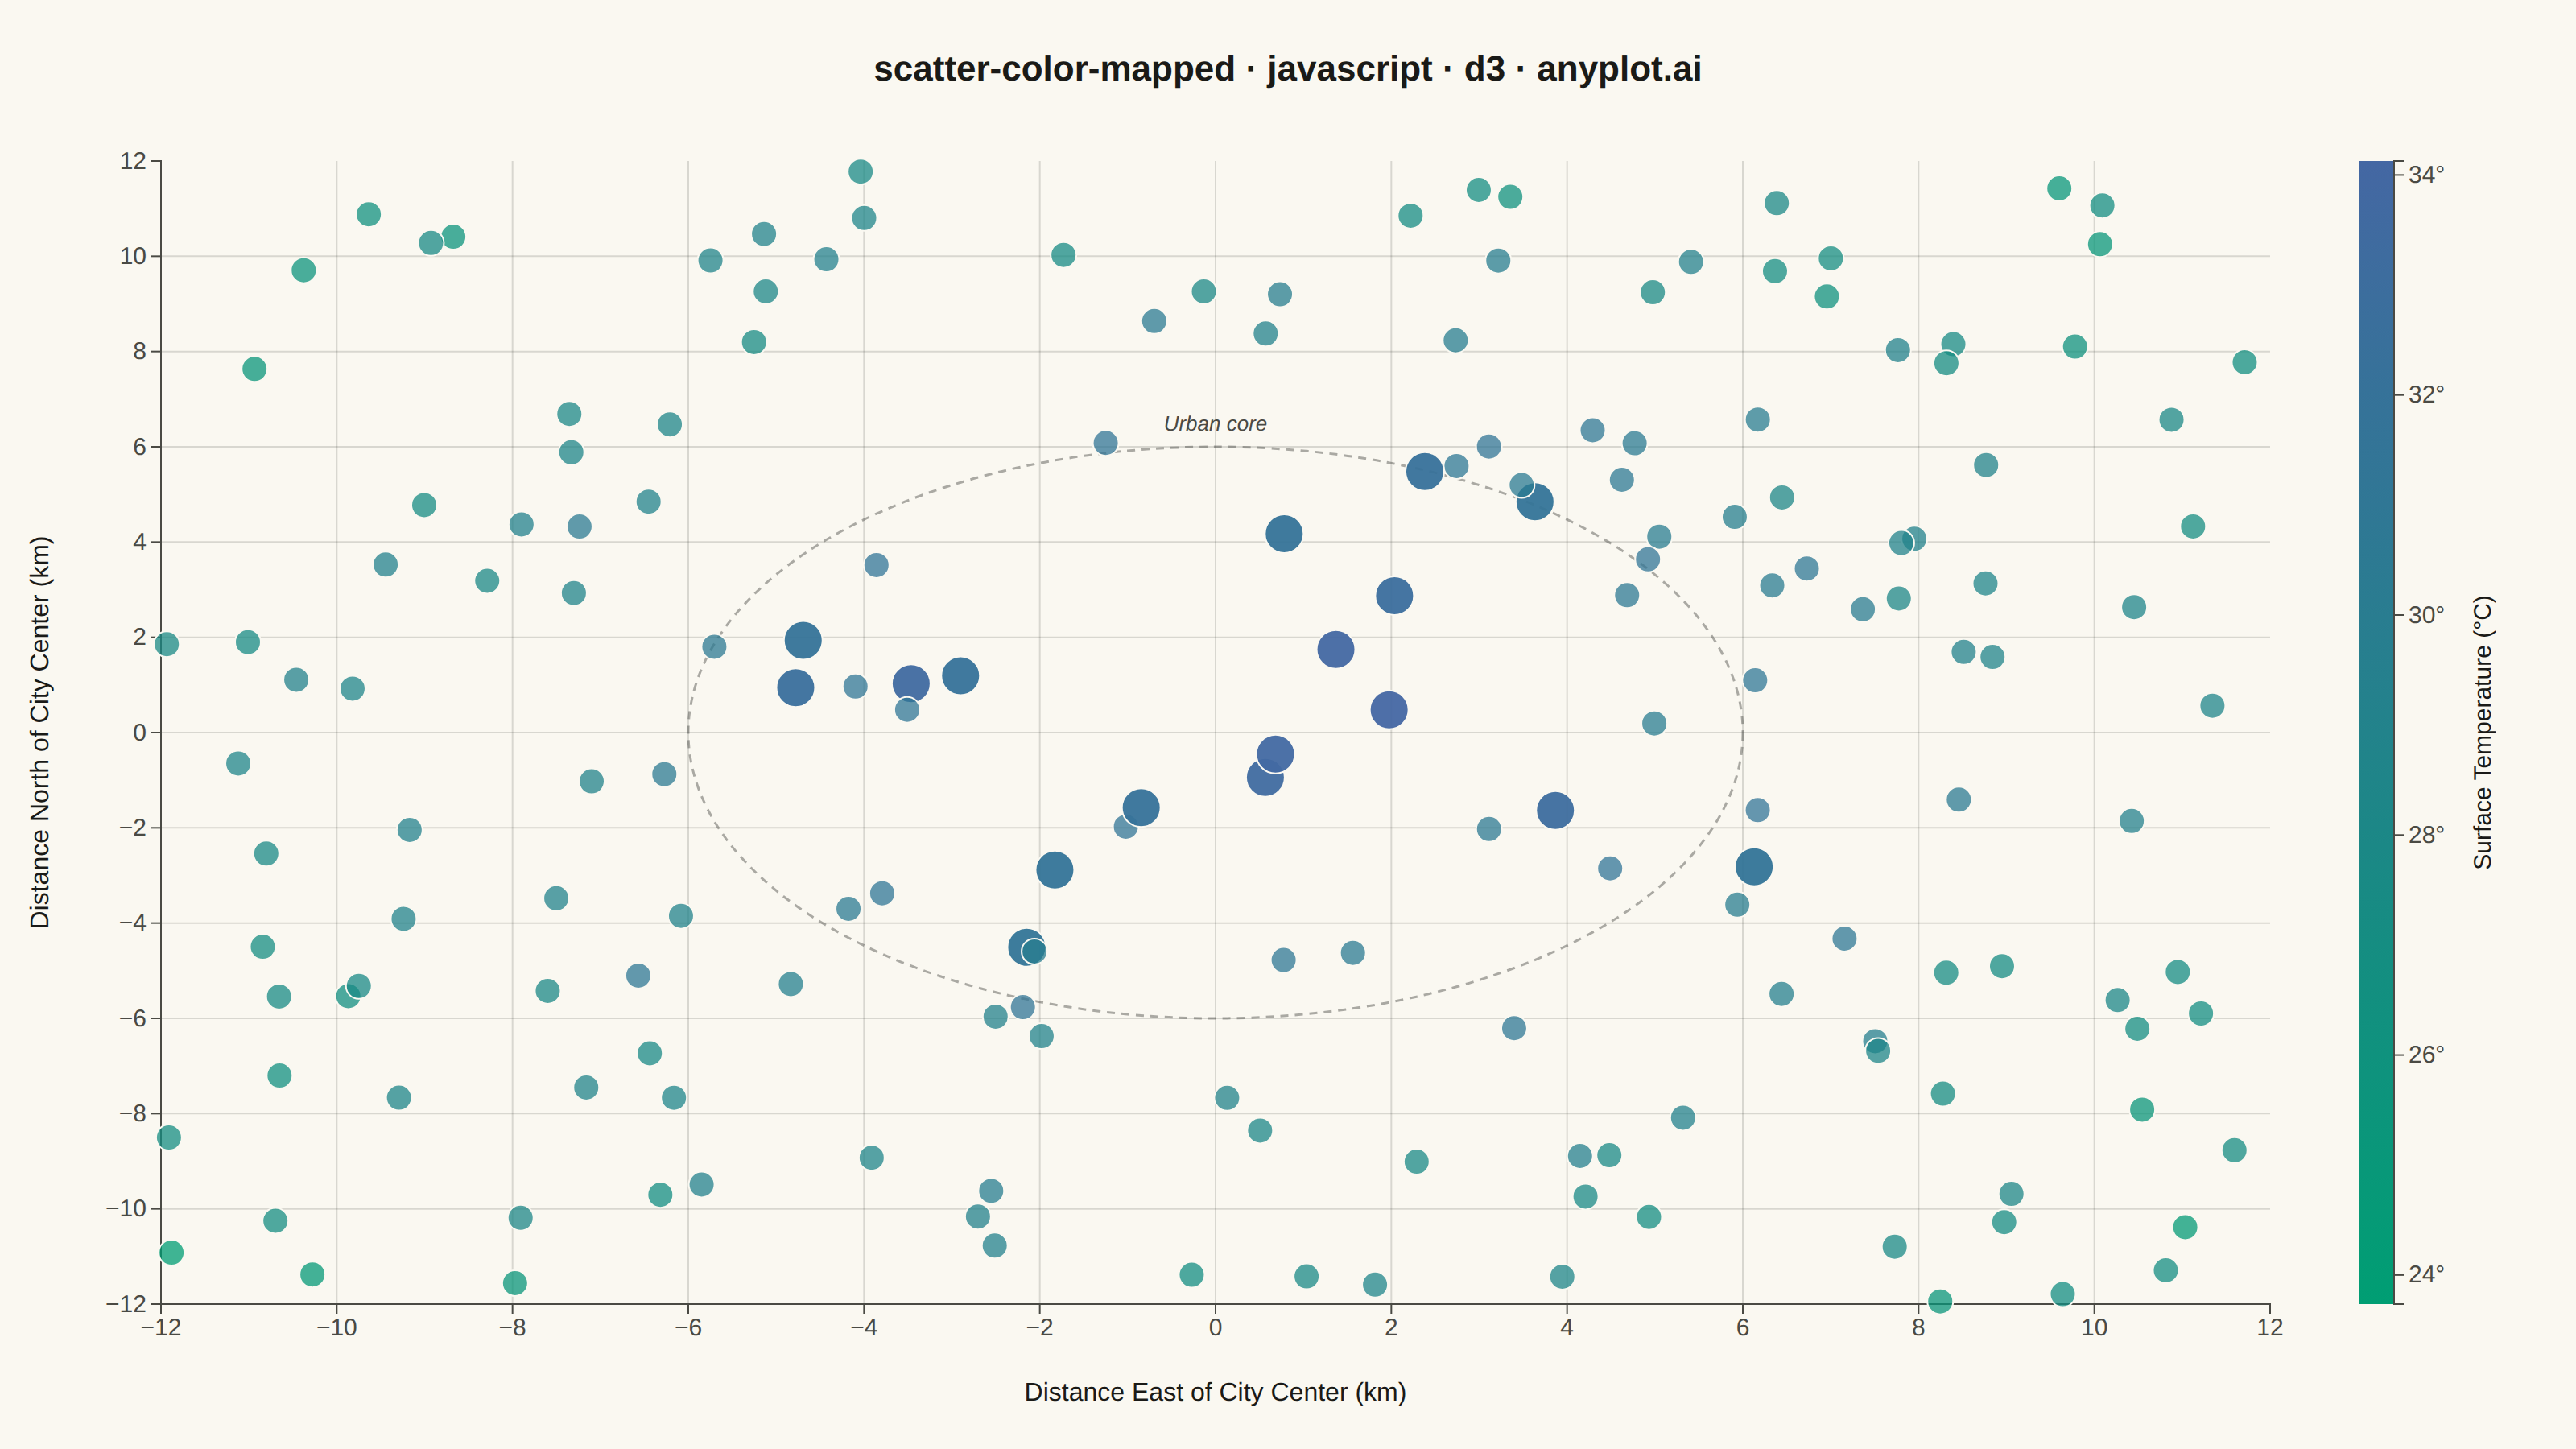
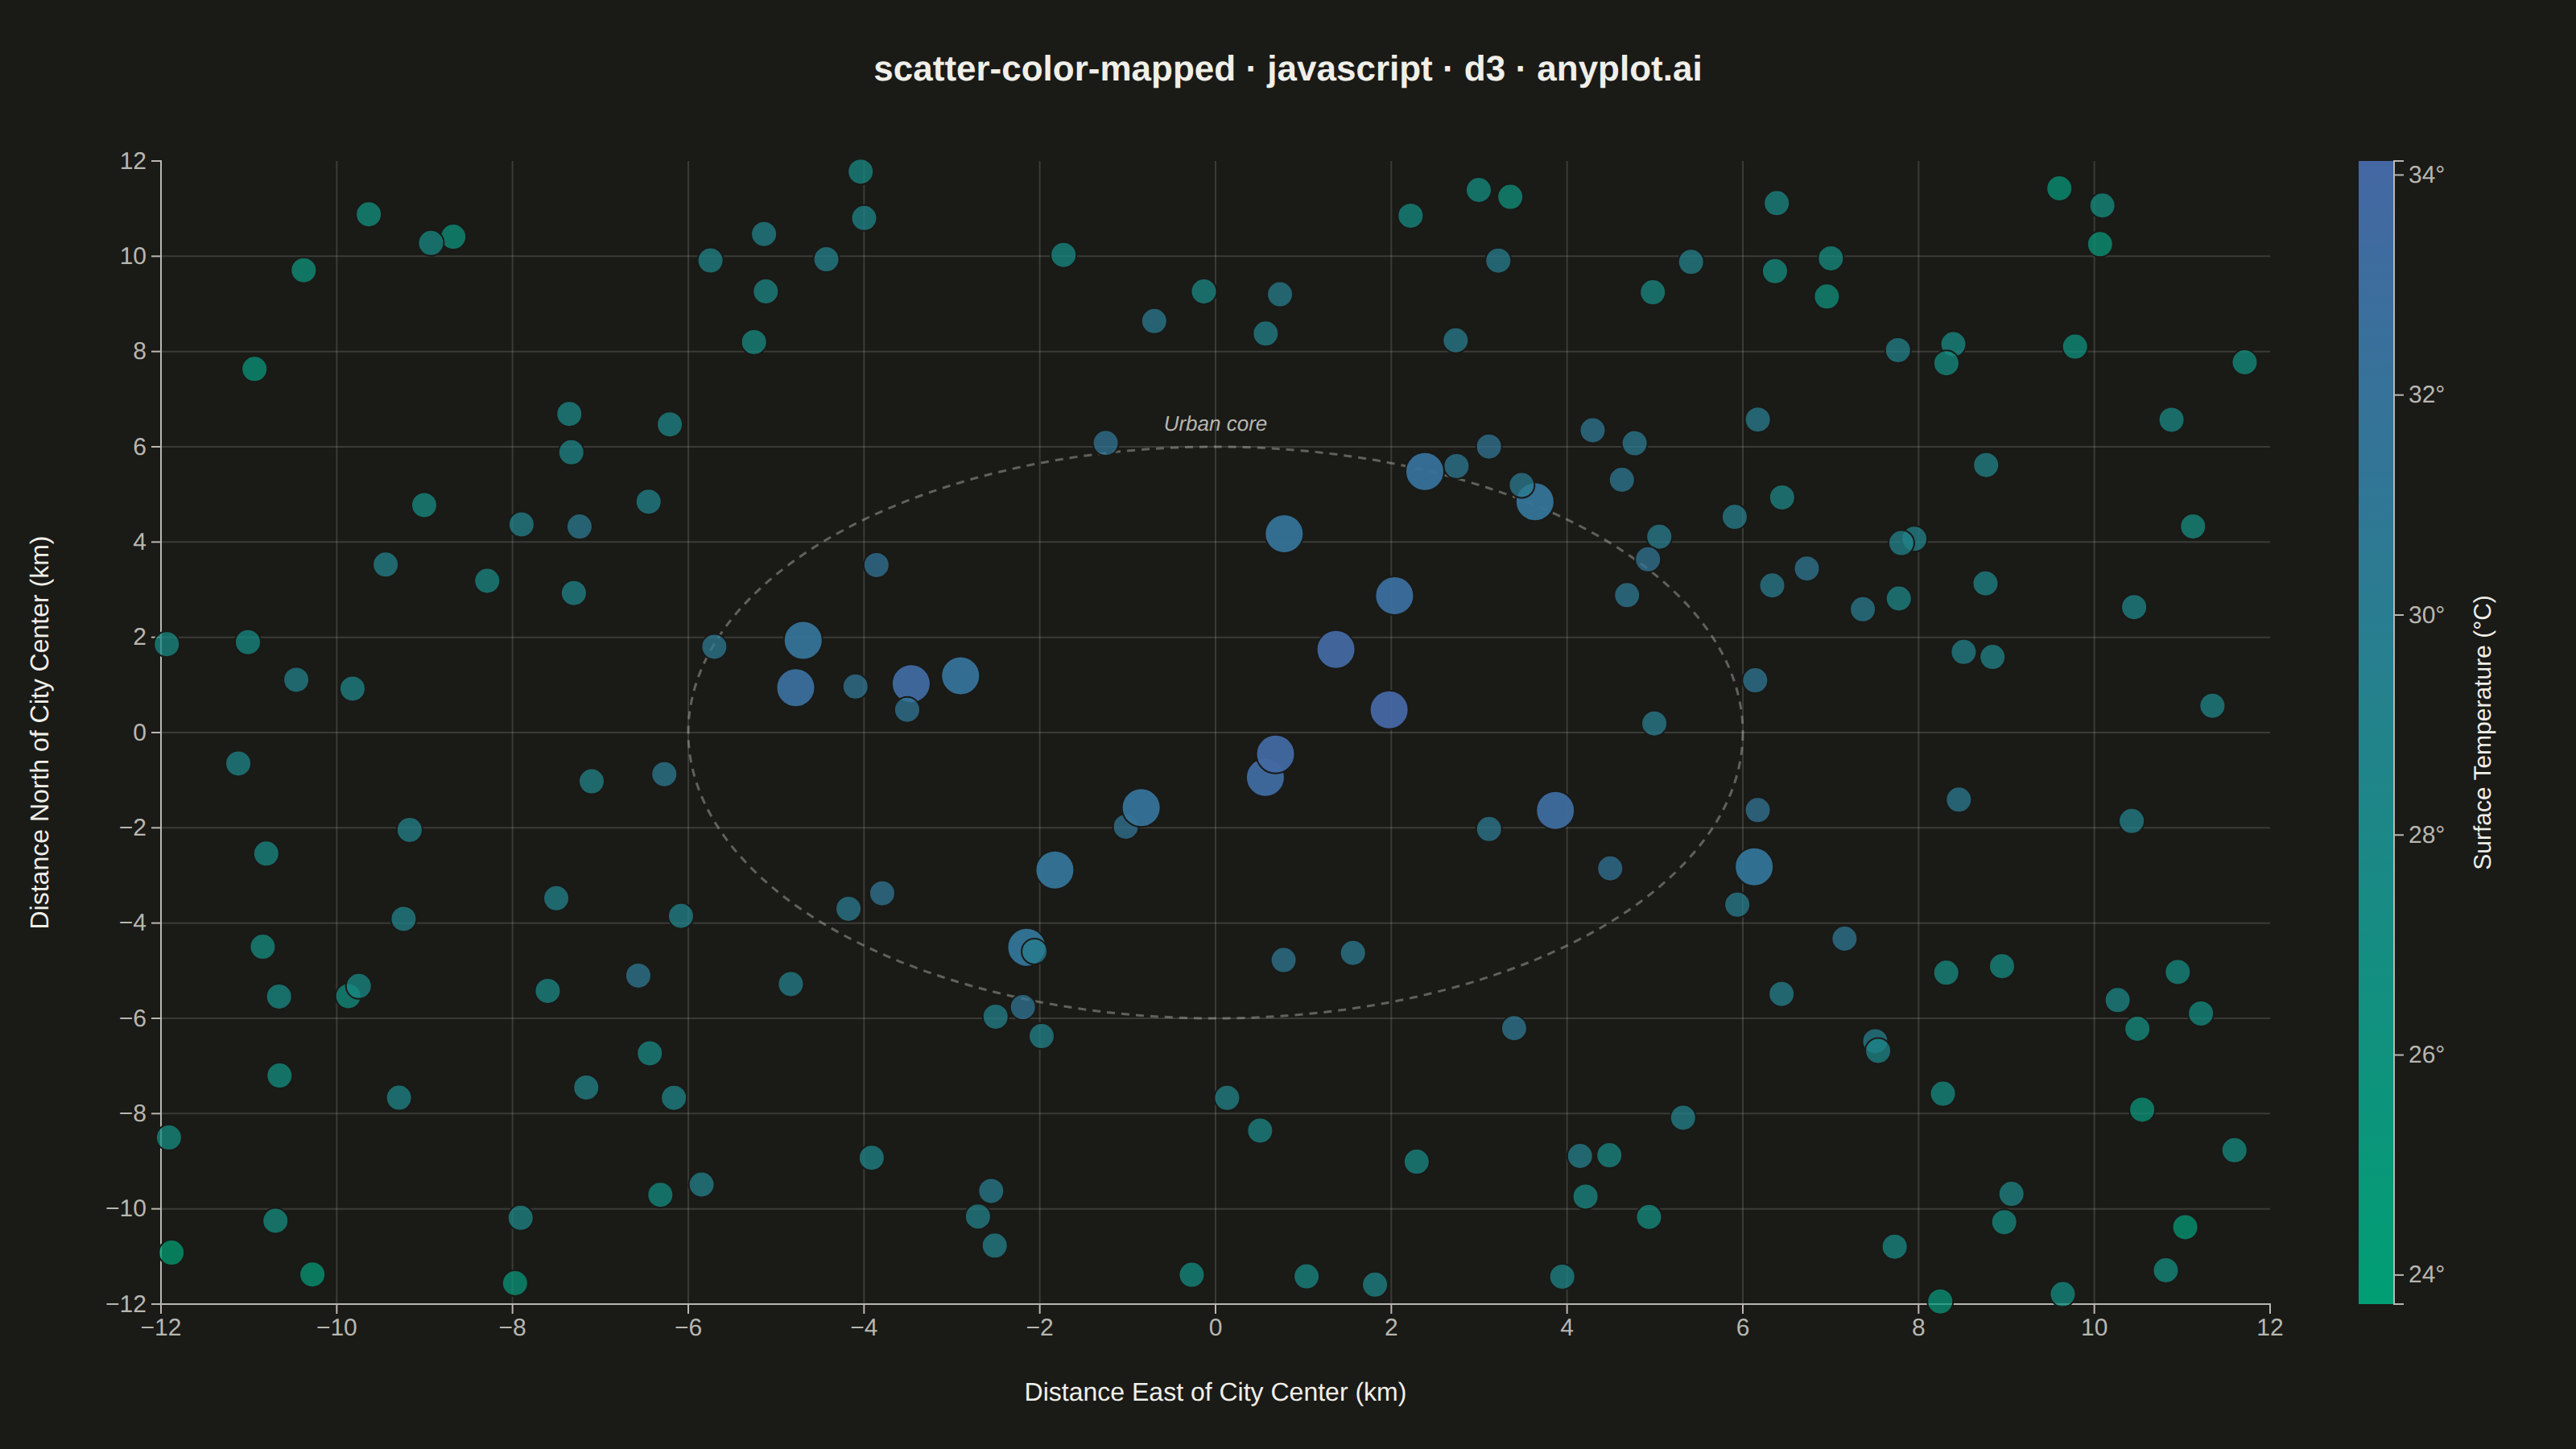
The same plot in 14 other libraries — JavaScript: Chart.js, Apache ECharts, Highcharts, MUI X Charts; Python: Altair, Bokeh, lets-plot, Matplotlib, Plotly, plotnine, Pygal, Seaborn; R: ggplot2; Julia: Makie.jl. Compare all 15 side by side: Color-Mapped Scatter Plot in Python, R, Julia and JavaScript.
A scatter plot that encodes a third continuous variable using a colormap, allowing visualization of three dimensions on a 2D plane. This visualization is essential for exploring multivariate relationships where the third variable represents intensity, magnitude, or any continuous measurement. A colorbar provides a reference scale for interpreting the color values.
// anyplot.ai
// scatter-color-mapped: Color-Mapped Scatter Plot
// Library: d3 7.9.0 | JavaScript 22.23.2
// Quality: 89/100 | Created: 2026-09-05

const t = window.ANYPLOT_TOKENS;
const { width, height } = window.ANYPLOT_SIZE;
const margin = { top: 100, right: 190, bottom: 90, left: 100 };
const iw = width - margin.left - margin.right;
const ih = height - margin.top - margin.bottom;

// --- Data (in-memory, deterministic LCG) ------------------------------------
// Urban heat island study: surface temperature recorded at monitoring
// stations scattered around a city center.
let seed = 42;
function nextRandom() {
  seed = (seed * 1103515245 + 12345) & 0x7fffffff;
  return seed / 0x7fffffff;
}

const stationCount = 180;
const stations = [];
for (let i = 0; i < stationCount; i++) {
  const distanceEast = (nextRandom() - 0.5) * 24;
  const distanceNorth = (nextRandom() - 0.5) * 24;
  const distanceFromCenter = Math.sqrt(distanceEast ** 2 + distanceNorth ** 2);
  const surfaceTemp = 34 - distanceFromCenter * 0.55 + (nextRandom() - 0.5) * 3;
  stations.push({ distanceEast, distanceNorth, surfaceTemp });
}

// --- Scales -------------------------------------------------------------
const x = d3.scaleLinear().domain(d3.extent(stations, (d) => d.distanceEast)).nice().range([0, iw]);
const y = d3.scaleLinear().domain(d3.extent(stations, (d) => d.distanceNorth)).nice().range([ih, 0]);
const [tempMin, tempMax] = d3.extent(stations, (d) => d.surfaceTemp);
const color = d3.scaleSequential(d3.interpolateRgbBasis(t.seq)).domain([tempMin, tempMax]);

// --- SVG mount ------------------------------------------------------------
const svg = d3.select("#container").append("svg").attr("width", width).attr("height", height);
const g = svg.append("g").attr("transform", `translate(${margin.left},${margin.top})`);

// --- Gridlines (both axes, L-shaped: skip the domain-extreme ticks so the
// gridlines don't double up with the axis lines and form a full box-frame) --
const [xDomainMin, xDomainMax] = x.domain();
const [yDomainMin, yDomainMax] = y.domain();

g.append("g")
  .selectAll("line")
  .data(x.ticks(8).filter((d) => d > xDomainMin && d < xDomainMax))
  .join("line")
  .attr("x1", (d) => x(d))
  .attr("x2", (d) => x(d))
  .attr("y1", 0)
  .attr("y2", ih)
  .attr("stroke", t.grid);

g.append("g")
  .selectAll("line")
  .data(y.ticks(8).filter((d) => d > yDomainMin && d < yDomainMax))
  .join("line")
  .attr("y1", (d) => y(d))
  .attr("y2", (d) => y(d))
  .attr("x1", 0)
  .attr("x2", iw)
  .attr("stroke", t.grid);

// --- Axes -------------------------------------------------------------------
const xAxis = g.append("g").attr("transform", `translate(0,${ih})`).call(d3.axisBottom(x).ticks(8));
const yAxis = g.append("g").call(d3.axisLeft(y).ticks(8));
for (const ax of [xAxis, yAxis]) {
  ax.selectAll("text").attr("fill", t.inkSoft).style("font-size", "15px");
  ax.selectAll("line").attr("stroke", t.inkSoft);
  ax.select(".domain").attr("stroke", t.inkSoft);
}

// --- Axis labels --------------------------------------------------------
g.append("text")
  .attr("x", iw / 2)
  .attr("y", ih + 60)
  .attr("text-anchor", "middle")
  .attr("fill", t.ink)
  .style("font-size", "16px")
  .text("Distance East of City Center (km)");

g.append("text")
  .attr("transform", "rotate(-90)")
  .attr("x", -ih / 2)
  .attr("y", -70)
  .attr("text-anchor", "middle")
  .attr("fill", t.ink)
  .style("font-size", "16px")
  .text("Distance North of City Center (km)");

// --- Urban-core focal annotation (data storytelling) -----------------------
// A dashed reference ring around the city center draws the eye to where the
// heat-island effect should be strongest, before the points render on top.
const coreRadiusKm = 6;
const coreRx = Math.abs(x(coreRadiusKm) - x(0));
const coreRy = Math.abs(y(0) - y(coreRadiusKm));
g.append("ellipse")
  .attr("cx", x(0))
  .attr("cy", y(0))
  .attr("rx", coreRx)
  .attr("ry", coreRy)
  .attr("fill", "none")
  .attr("stroke", t.inkSoft)
  .attr("stroke-width", 1.5)
  .attr("stroke-dasharray", "5,4")
  .attr("opacity", 0.45);

g.append("text")
  .attr("x", x(0))
  .attr("y", y(0) - coreRy - 10)
  .attr("text-anchor", "middle")
  .attr("fill", t.inkSoft)
  .style("font-size", "13px")
  .style("font-style", "italic")
  .text("Urban core");

// --- Points -----------------------------------------------------------------
// Warmest stations (top quartile) render larger and more opaque, creating a
// focal point that surfaces the heat-island clustering near the city center.
const hotThreshold = tempMin + (tempMax - tempMin) * 0.75;
g.selectAll("circle.station")
  .data(stations)
  .join("circle")
  .attr("class", "station")
  .attr("cx", (d) => x(d.distanceEast))
  .attr("cy", (d) => y(d.distanceNorth))
  .attr("r", (d) => (d.surfaceTemp >= hotThreshold ? 12 : 8))
  .attr("fill", (d) => color(d.surfaceTemp))
  .attr("fill-opacity", (d) => (d.surfaceTemp >= hotThreshold ? 0.95 : 0.75))
  .attr("stroke", t.pageBg)
  .attr("stroke-width", 1);

// --- Colorbar (Imprint sequential scale) -----------------------------------
const barWidth = 22;
const barX = iw + 55;

const gradient = svg
  .append("defs")
  .append("linearGradient")
  .attr("id", "temperature-gradient")
  .attr("x1", "0%")
  .attr("x2", "0%")
  .attr("y1", "100%")
  .attr("y2", "0%");
d3.range(0, 1.0001, 0.1).forEach((stop) => {
  gradient
    .append("stop")
    .attr("offset", `${stop * 100}%`)
    .attr("stop-color", color(tempMin + stop * (tempMax - tempMin)));
});

g.append("rect")
  .attr("x", barX)
  .attr("y", 0)
  .attr("width", barWidth)
  .attr("height", ih)
  .attr("fill", "url(#temperature-gradient)");

const barScale = d3.scaleLinear().domain([tempMin, tempMax]).range([ih, 0]);
const barAxis = g
  .append("g")
  .attr("transform", `translate(${barX + barWidth},0)`)
  .call(
    d3
      .axisRight(barScale)
      .ticks(6)
      .tickFormat((d) => `${d.toFixed(0)}°`),
  );
barAxis.selectAll("text").attr("fill", t.inkSoft).style("font-size", "15px");
barAxis.selectAll("line").attr("stroke", t.inkSoft);
barAxis.select(".domain").attr("stroke", t.inkSoft);

g.append("text")
  .attr("transform", "rotate(-90)")
  .attr("x", -ih / 2)
  .attr("y", barX + barWidth + 60)
  .attr("text-anchor", "middle")
  .attr("fill", t.ink)
  .style("font-size", "15px")
  .text("Surface Temperature (°C)");

// --- Title ------------------------------------------------------------------
svg
  .append("text")
  .attr("x", width / 2)
  .attr("y", 50)
  .attr("text-anchor", "middle")
  .attr("fill", t.ink)
  .style("font-size", "22px")
  .style("font-weight", "600")
  .text("scatter-color-mapped · javascript · d3 · anyplot.ai");
Runnable source as JSON, for any HTTP client: https://api.anyplot.ai/specs/scatter-color-mapped/d3/code. Any spec id and library id listed in llms-full.txt fit the same URL shape; every URL below is complete and callable.
{
  "spec_id": "scatter-color-mapped",
  "language": "javascript",
  "library": "d3",
  "page": "https://anyplot.ai/scatter-color-mapped/javascript/d3",
  "hub": "https://anyplot.ai/scatter-color-mapped",
  "code_json": "https://api.anyplot.ai/specs/scatter-color-mapped/d3/code",
  "spec_json": "https://api.anyplot.ai/specs/scatter-color-mapped",
  "render_light_png": "https://storage.googleapis.com/anyplot-images/plots/scatter-color-mapped/javascript/d3/plot-light.png",
  "render_dark_png": "https://storage.googleapis.com/anyplot-images/plots/scatter-color-mapped/javascript/d3/plot-dark.png",
  "interactive_light_html": "https://storage.googleapis.com/anyplot-images/plots/scatter-color-mapped/javascript/d3/plot-light.html",
  "interactive_dark_html": "https://storage.googleapis.com/anyplot-images/plots/scatter-color-mapped/javascript/d3/plot-dark.html",
  "quality_score": 89.0,
  "license": "MIT",
  "guide": "https://anyplot.ai/llms.txt"
}
Part of Color-Mapped Scatter Plot on anyplot.ai.