The same plot in 14 other libraries — JavaScript: D3.js, Apache ECharts, Highcharts, MUI X Charts; Python: Altair, Bokeh, lets-plot, Matplotlib, Plotly, plotnine, Pygal, Seaborn; R: ggplot2; Julia: Makie.jl. Compare all 15 side by side: Color-Mapped Scatter Plot in Python, R, Julia and JavaScript.
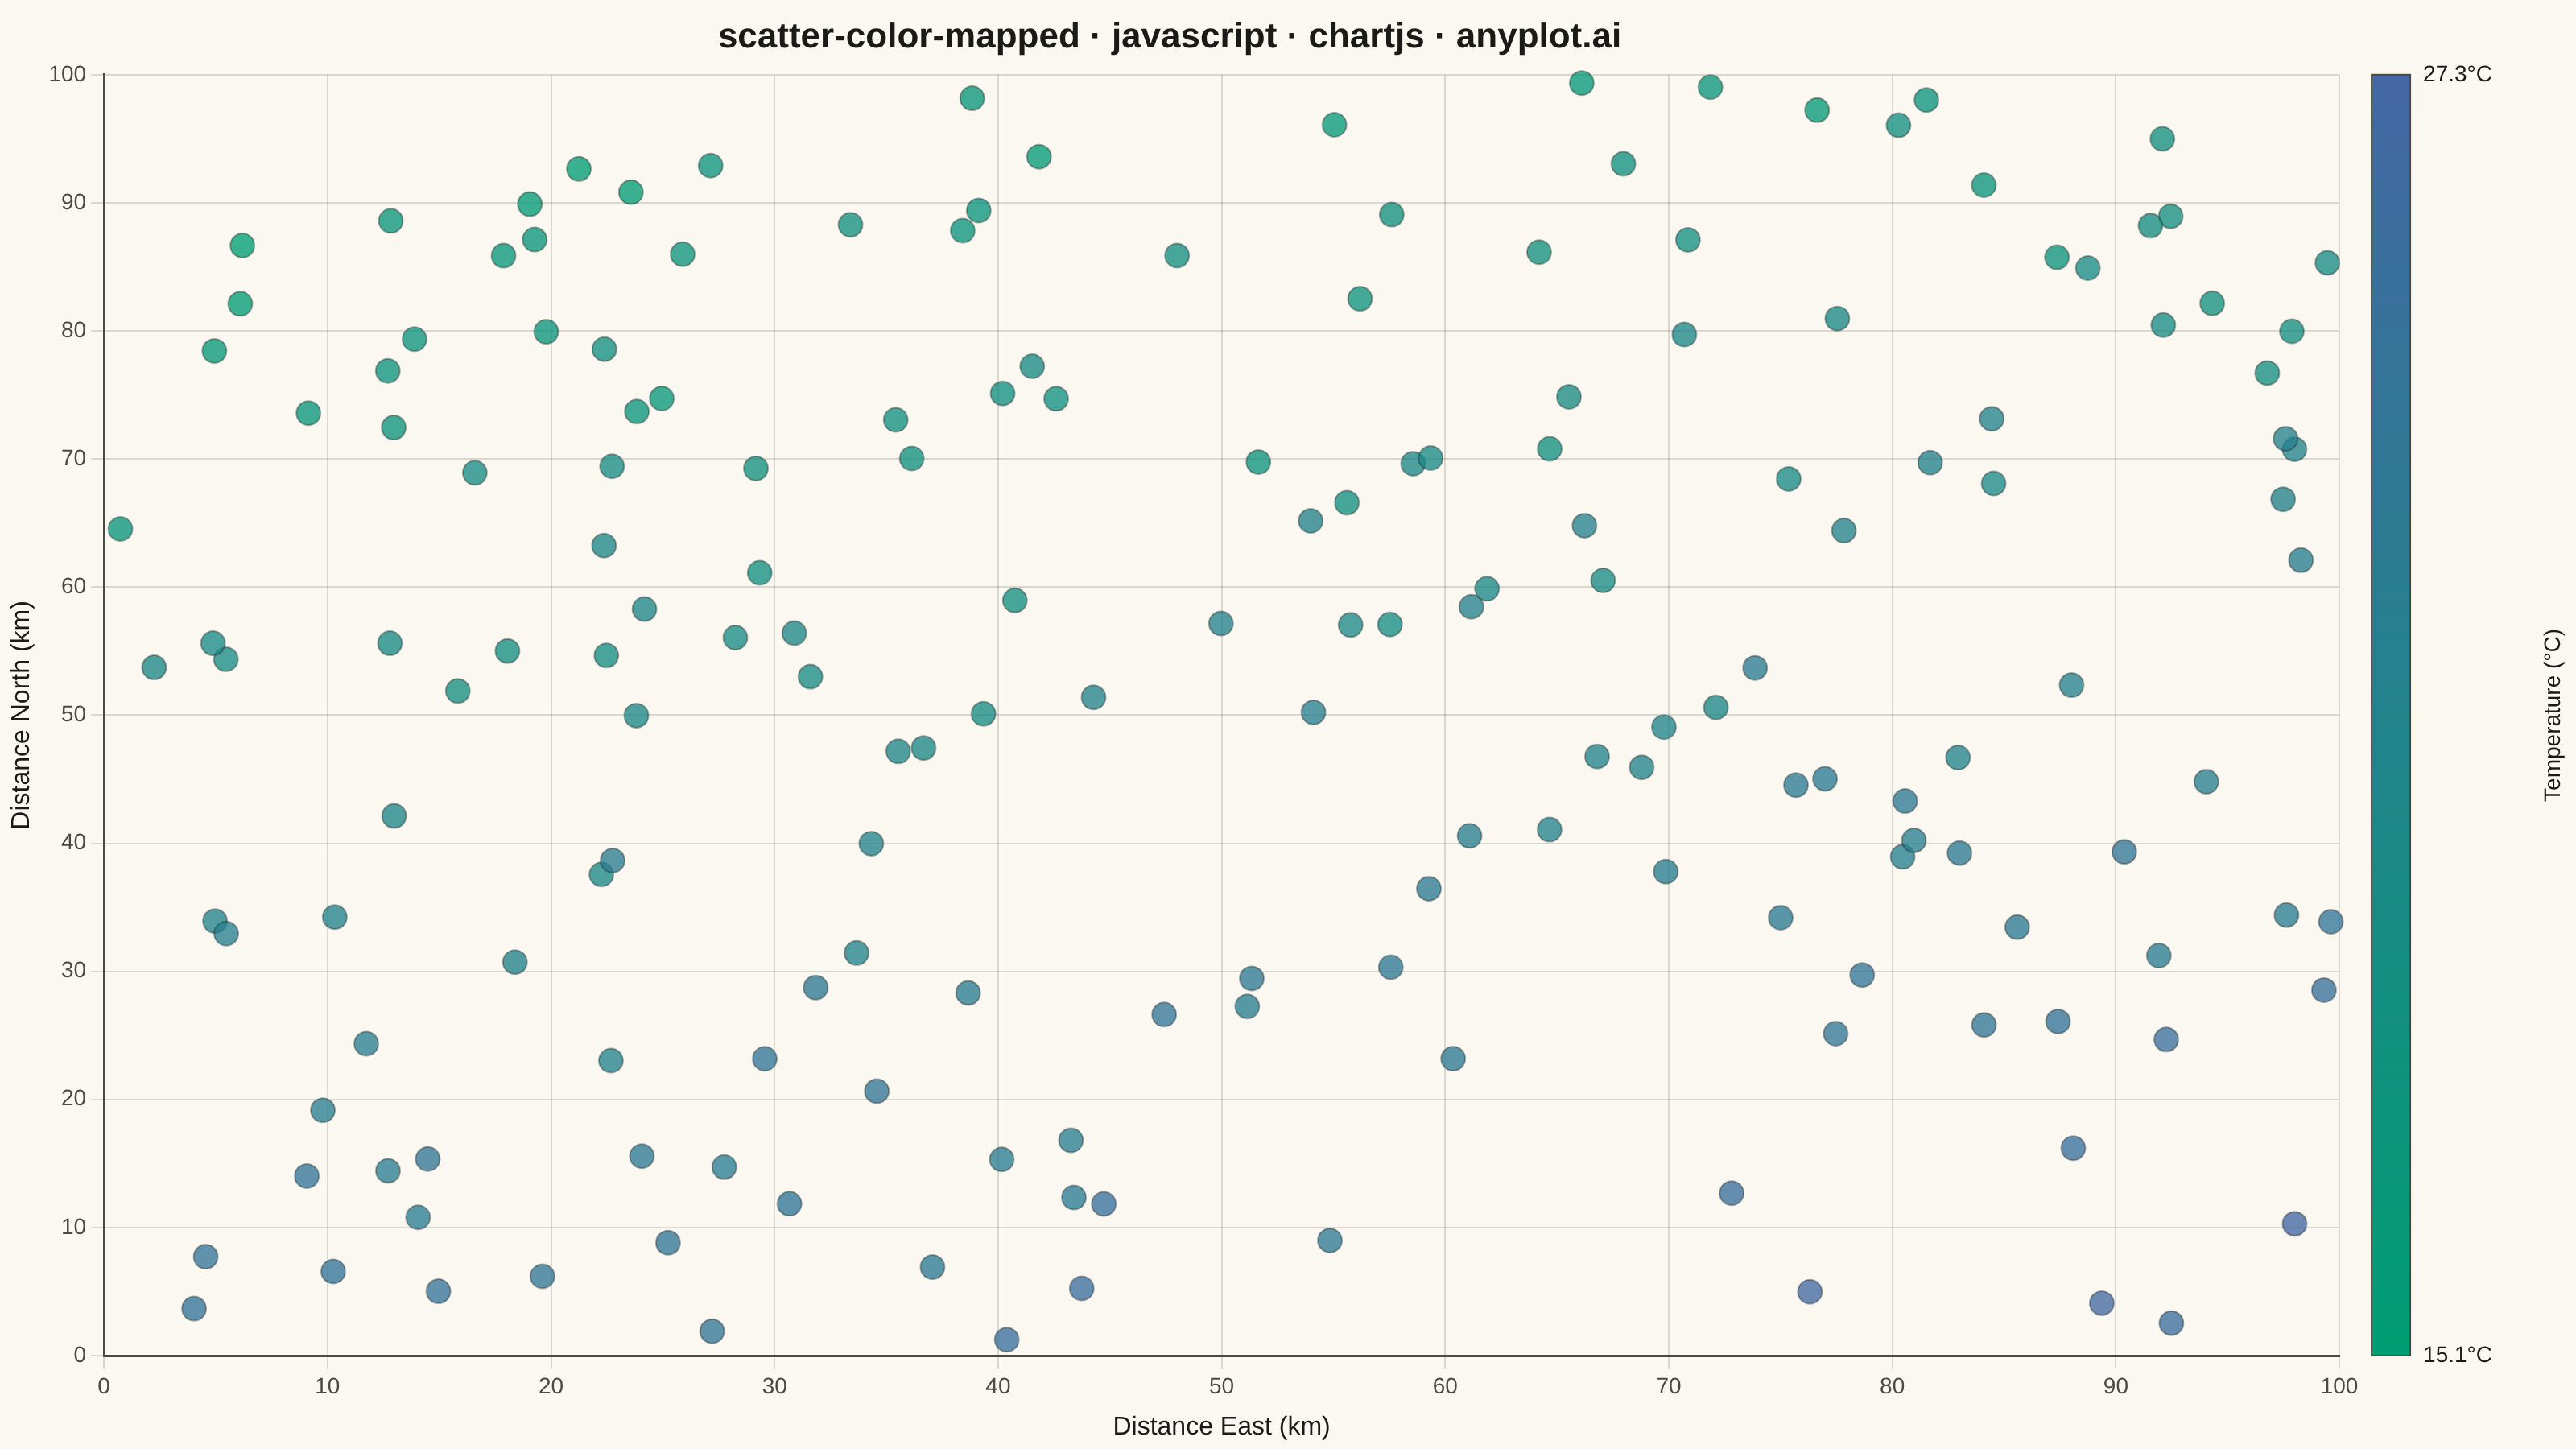
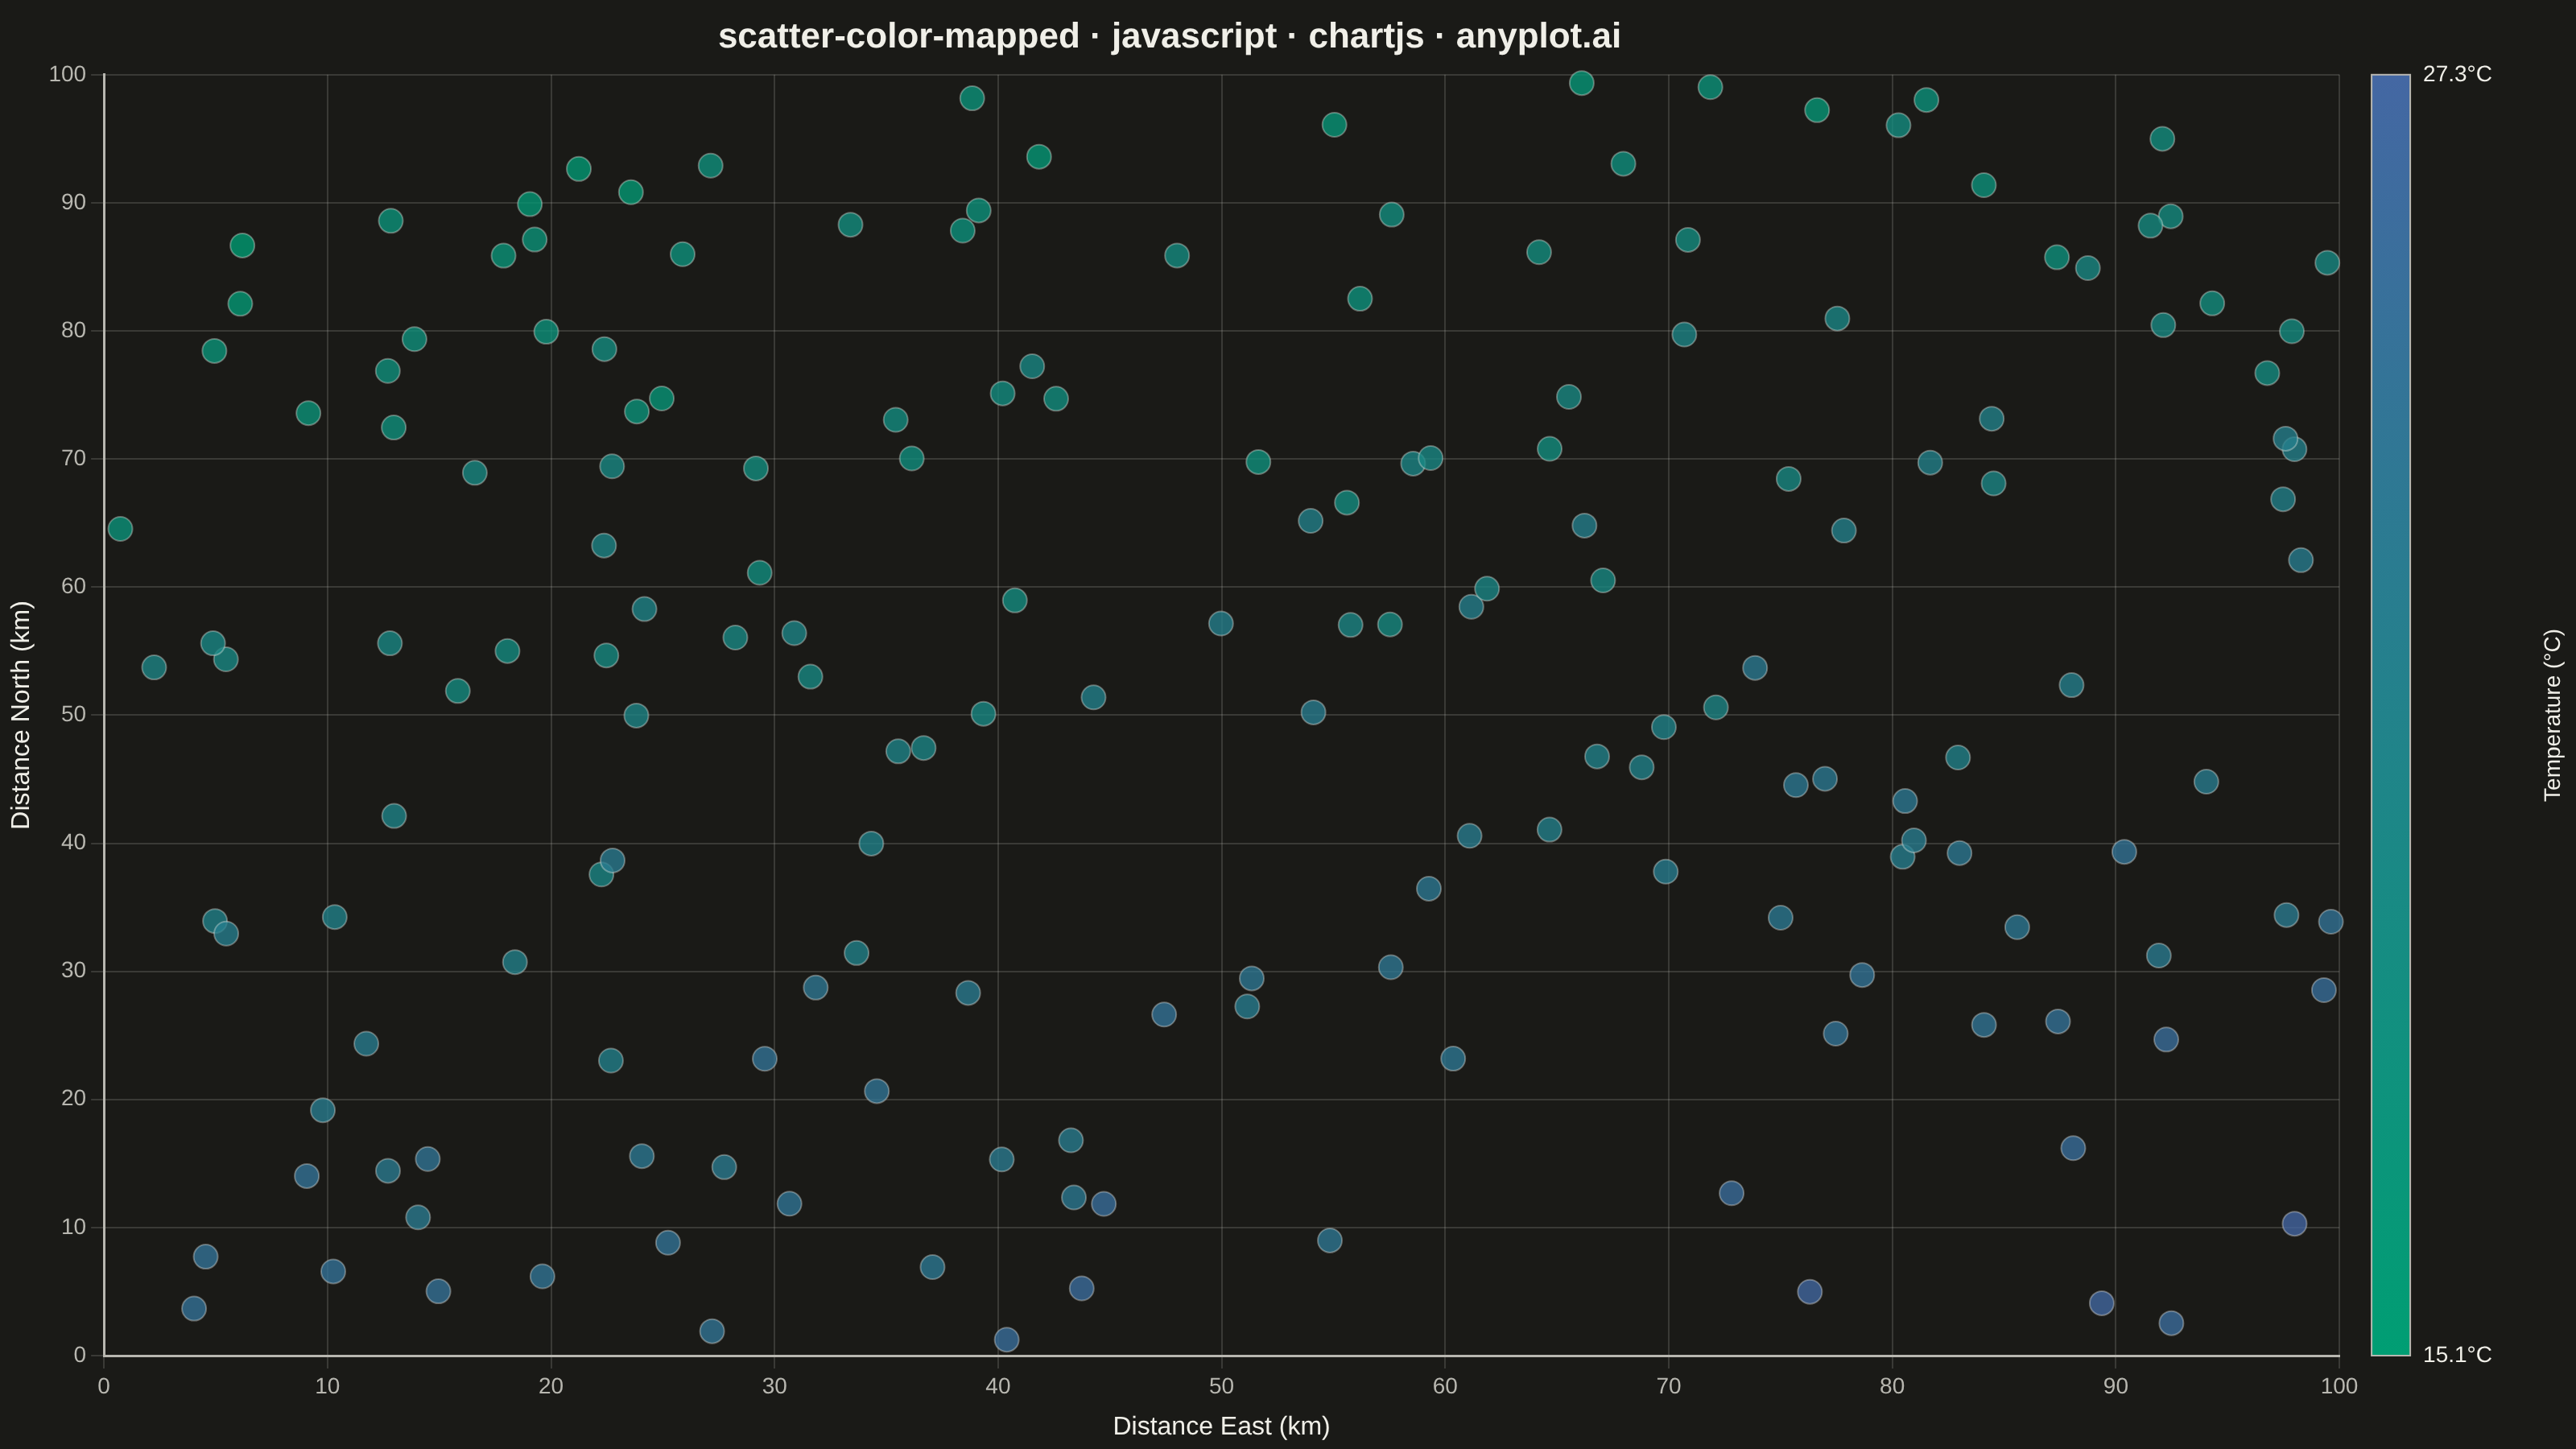
A scatter plot that encodes a third continuous variable using a colormap, allowing visualization of three dimensions on a 2D plane. This visualization is essential for exploring multivariate relationships where the third variable represents intensity, magnitude, or any continuous measurement. A colorbar provides a reference scale for interpreting the color values.
// anyplot.ai
// scatter-color-mapped: Color-Mapped Scatter Plot
// Library: chartjs 4.4.7 | JavaScript 22.23.2
// Quality: 87/100 | Created: 2026-09-05

//# anyplot-orientation: landscape
const t = window.ANYPLOT_TOKENS;

// --- Data: simulated sensor readings across a monitoring grid ---------------
// Temperature drifts cooler to the north and warmer to the east, plus noise.
function lcg(seed) {
  let state = seed;
  return () => {
    state = (state * 1664525 + 1013904223) % 4294967296;
    return state / 4294967296;
  };
}
const rand = lcg(42);

const n = 180;
const readings = [];
for (let i = 0; i < n; i++) {
  const distanceEast = rand() * 100;
  const distanceNorth = rand() * 100;
  const temperature =
    24 - 0.09 * distanceNorth + 0.03 * distanceEast + (rand() - 0.5) * 3;
  readings.push({ x: distanceEast, y: distanceNorth, temperature });
}

const temperatures = readings.map((r) => r.temperature);
const tempMin = Math.min(...temperatures);
const tempMax = Math.max(...temperatures);

// --- Color mapping: imprint_seq (brand green -> blue), single-polarity data
function hexToRgb(hex) {
  const value = parseInt(hex.slice(1), 16);
  return [(value >> 16) & 255, (value >> 8) & 255, value & 255];
}
const seqLow = hexToRgb(t.seq[0]);
const seqHigh = hexToRgb(t.seq[1]);
const inkRgb = hexToRgb(t.ink);

function colorForTemperature(value) {
  const ratio = (value - tempMin) / (tempMax - tempMin);
  const r = Math.round(seqLow[0] + ratio * (seqHigh[0] - seqLow[0]));
  const g = Math.round(seqLow[1] + ratio * (seqHigh[1] - seqLow[1]));
  const b = Math.round(seqLow[2] + ratio * (seqHigh[2] - seqLow[2]));
  return `rgba(${r}, ${g}, ${b}, 0.78)`;
}

const pointColors = readings.map((r) => colorForTemperature(r.temperature));

// --- Mount -------------------------------------------------------------------
const canvas = document.createElement("canvas");
document.getElementById("container").appendChild(canvas);

// --- Colorbar sizing: measure the tick labels up front so the layout's
// right padding hugs the colorbar instead of leaving guessed-at dead space ---
const colorbarFont = "14px sans-serif";
const measureCtx = canvas.getContext("2d");
measureCtx.font = colorbarFont;
const tickLabels = [`${tempMax.toFixed(1)}°C`, `${tempMin.toFixed(1)}°C`];
const maxTickWidth = Math.max(
  ...tickLabels.map((label) => measureCtx.measureText(label).width),
);
const barGap = 20;
const barWidth = 24;
const tickLabelGap = 8;
const axisLabelGap = 18;
const rightMargin = 14;
const axisLabelOffset = barGap + barWidth + tickLabelGap + maxTickWidth + axisLabelGap;
// colorbarSpace reserves layout.padding.right; it must include barGap because
// barX is measured from chartArea.right (= canvasWidth - colorbarSpace), not
// from canvasWidth itself, or the rotated label's anchor lands past the edge.
const colorbarSpace = barGap + axisLabelOffset + rightMargin;

// --- Colorbar plugin: draws the imprint_seq gradient as a reference scale ---
const colorbarPlugin = {
  id: "colorbar",
  afterDraw(chart) {
    const { ctx, chartArea } = chart;
    const { top, bottom, right } = chartArea;
    const barX = right + barGap;

    const gradient = ctx.createLinearGradient(0, bottom, 0, top);
    gradient.addColorStop(0, t.seq[0]);
    gradient.addColorStop(1, t.seq[1]);

    ctx.save();
    ctx.fillStyle = gradient;
    ctx.fillRect(barX, top, barWidth, bottom - top);
    ctx.strokeStyle = t.inkSoft;
    ctx.lineWidth = 1;
    ctx.strokeRect(barX, top, barWidth, bottom - top);

    ctx.fillStyle = t.ink;
    ctx.font = colorbarFont;
    ctx.textBaseline = "middle";
    ctx.textAlign = "left";
    ctx.fillText(tickLabels[0], barX + barWidth + tickLabelGap, top);
    ctx.fillText(tickLabels[1], barX + barWidth + tickLabelGap, bottom);

    ctx.translate(barX + axisLabelOffset, (top + bottom) / 2);
    ctx.rotate(-Math.PI / 2);
    ctx.textAlign = "center";
    ctx.fillText("Temperature (°C)", 0, 0);
    ctx.restore();
  },
};

// --- Chart -------------------------------------------------------------------
new Chart(canvas, {
  type: "scatter",
  data: {
    datasets: [
      {
        label: "Sensor reading",
        data: readings,
        backgroundColor: pointColors,
        borderColor: `rgba(${inkRgb[0]}, ${inkRgb[1]}, ${inkRgb[2]}, 0.35)`,
        borderWidth: 1,
        pointRadius: 7.5,
        pointHoverRadius: 7.5,
      },
    ],
  },
  options: {
    responsive: true,
    maintainAspectRatio: false,
    animation: false,
    layout: { padding: { right: colorbarSpace } },
    plugins: {
      title: {
        display: true,
        text: "scatter-color-mapped · javascript · chartjs · anyplot.ai",
        color: t.ink,
        font: { size: 22 },
      },
      legend: { display: false },
    },
    scales: {
      x: {
        title: { display: true, text: "Distance East (km)", color: t.ink, font: { size: 16 } },
        ticks: { color: t.inkSoft, font: { size: 14 } },
        grid: { color: t.grid },
        border: { color: t.inkSoft, width: 1.5 },
      },
      y: {
        title: { display: true, text: "Distance North (km)", color: t.ink, font: { size: 16 } },
        ticks: { color: t.inkSoft, font: { size: 14 } },
        grid: { color: t.grid },
        border: { color: t.inkSoft, width: 1.5 },
      },
    },
  },
  plugins: [colorbarPlugin],
});
Runnable source as JSON, for any HTTP client: https://api.anyplot.ai/specs/scatter-color-mapped/chartjs/code. Any spec id and library id listed in llms-full.txt fit the same URL shape; every URL below is complete and callable.
{
  "spec_id": "scatter-color-mapped",
  "language": "javascript",
  "library": "chartjs",
  "page": "https://anyplot.ai/scatter-color-mapped/javascript/chartjs",
  "hub": "https://anyplot.ai/scatter-color-mapped",
  "code_json": "https://api.anyplot.ai/specs/scatter-color-mapped/chartjs/code",
  "spec_json": "https://api.anyplot.ai/specs/scatter-color-mapped",
  "render_light_png": "https://storage.googleapis.com/anyplot-images/plots/scatter-color-mapped/javascript/chartjs/plot-light.png",
  "render_dark_png": "https://storage.googleapis.com/anyplot-images/plots/scatter-color-mapped/javascript/chartjs/plot-dark.png",
  "interactive_light_html": "https://storage.googleapis.com/anyplot-images/plots/scatter-color-mapped/javascript/chartjs/plot-light.html",
  "interactive_dark_html": "https://storage.googleapis.com/anyplot-images/plots/scatter-color-mapped/javascript/chartjs/plot-dark.html",
  "quality_score": 87.0,
  "license": "MIT",
  "guide": "https://anyplot.ai/llms.txt"
}
Part of Color-Mapped Scatter Plot on anyplot.ai.