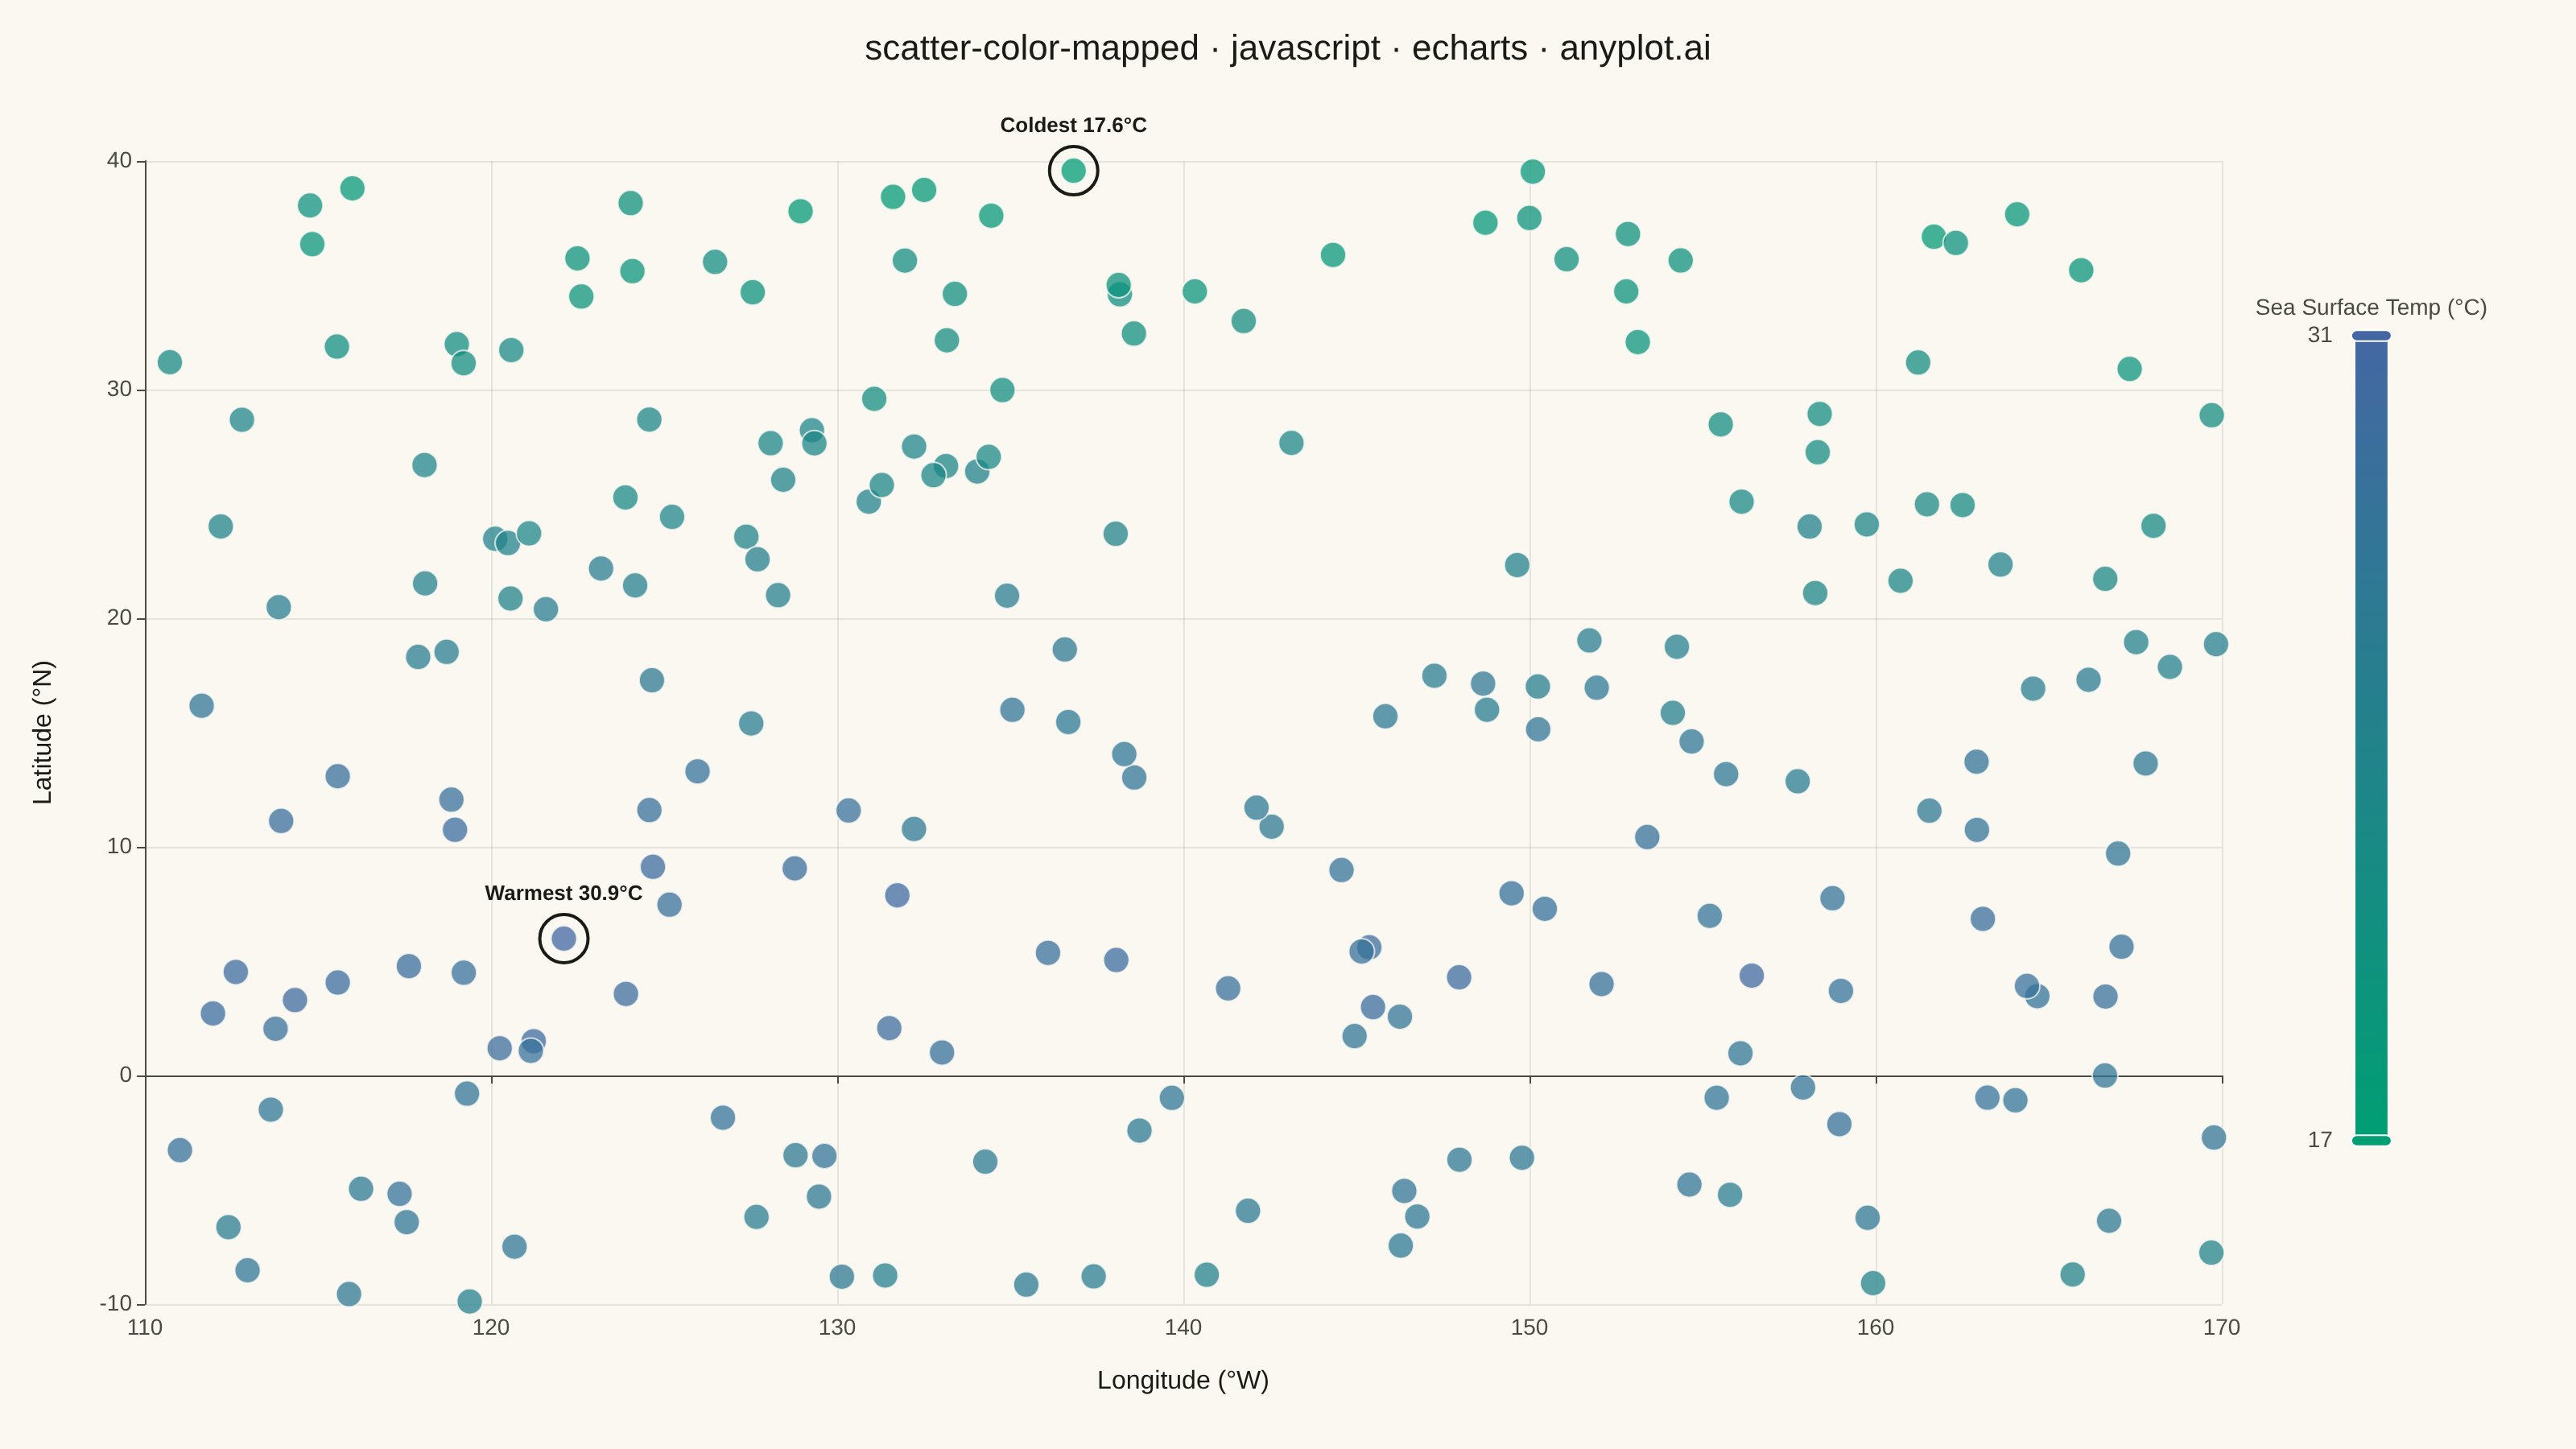
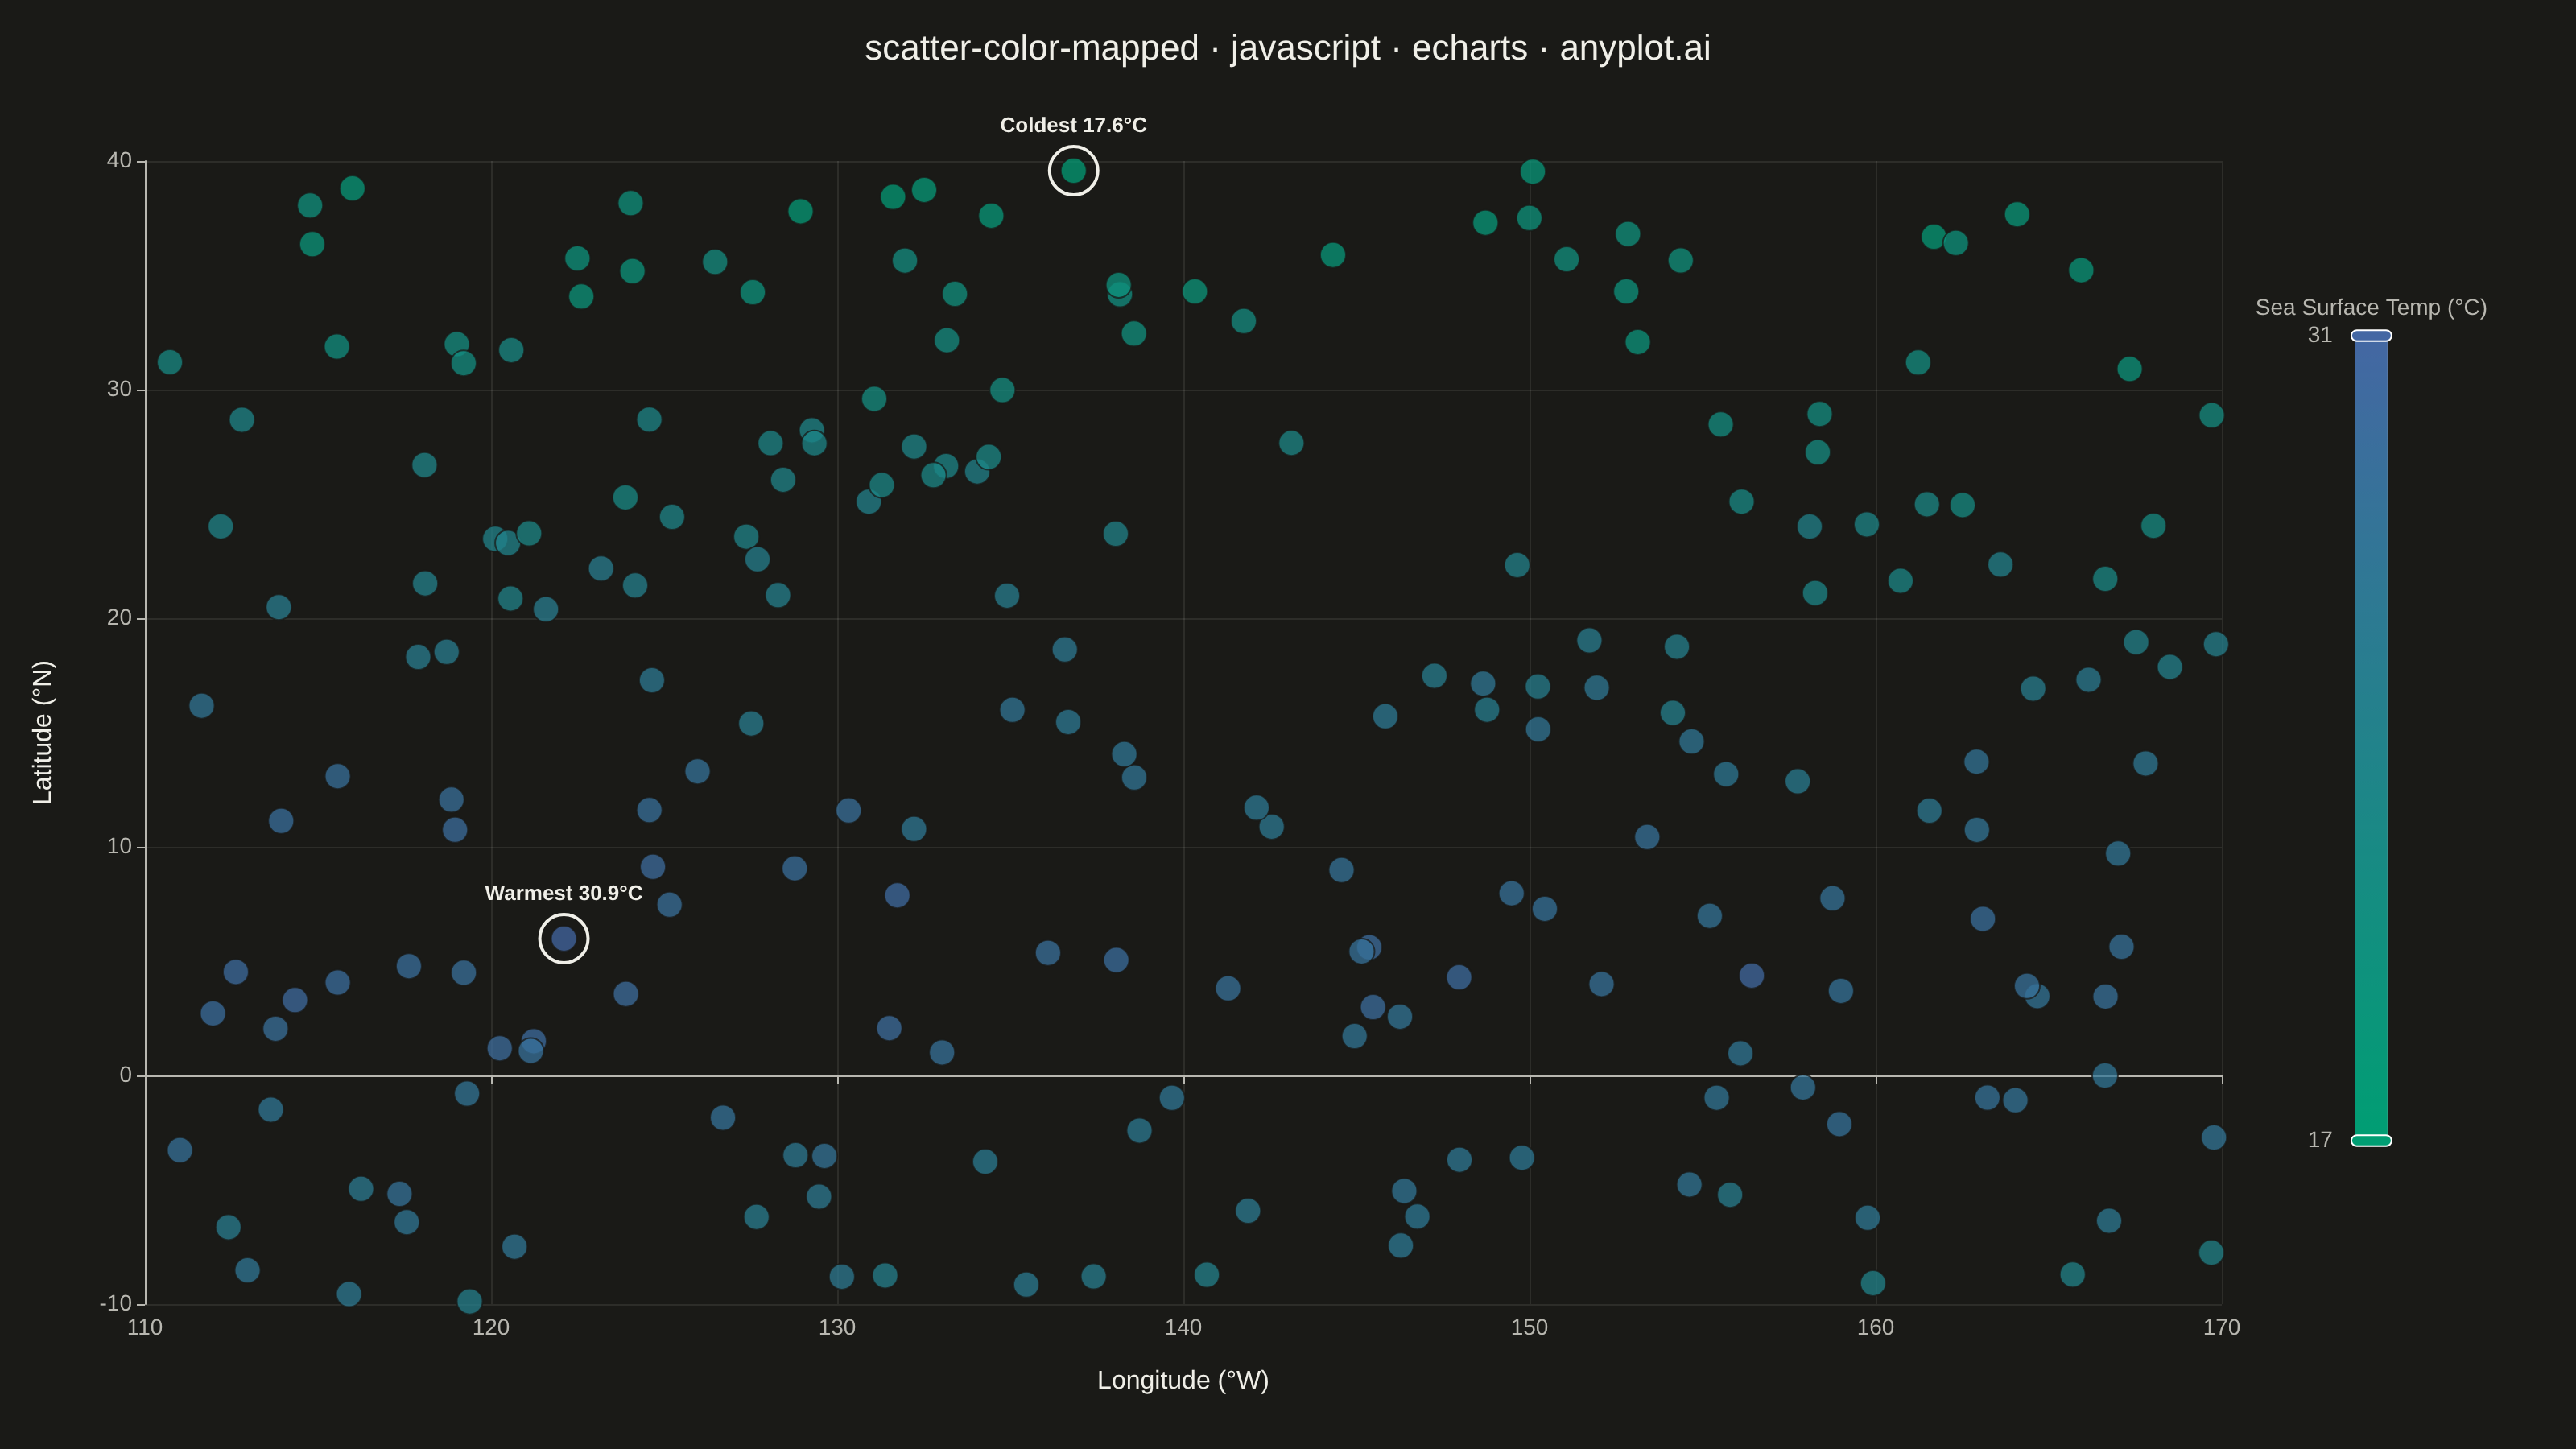
The same plot in 14 other libraries — JavaScript: Chart.js, D3.js, Highcharts, MUI X Charts; Python: Altair, Bokeh, lets-plot, Matplotlib, Plotly, plotnine, Pygal, Seaborn; R: ggplot2; Julia: Makie.jl. Compare all 15 side by side: Color-Mapped Scatter Plot in Python, R, Julia and JavaScript.
A scatter plot that encodes a third continuous variable using a colormap, allowing visualization of three dimensions on a 2D plane. This visualization is essential for exploring multivariate relationships where the third variable represents intensity, magnitude, or any continuous measurement. A colorbar provides a reference scale for interpreting the color values.
// anyplot.ai
// scatter-color-mapped: Color-Mapped Scatter Plot
// Library: echarts 6.1.0 | JavaScript 22.23.2
// Quality: 90/100 | Created: 2026-09-05

//# anyplot-orientation: landscape
const t = window.ANYPLOT_TOKENS;

// --- Data (in-memory, deterministic LCG) ------------------------------------
let seed = 42;
function rand() {
  seed = (seed * 1103515245 + 12345) & 0x7fffffff;
  return seed / 0x7fffffff;
}

const stationCount = 220;
const points = [];
for (let i = 0; i < stationCount; i++) {
  const rawLongitude = -170 + rand() * 60; // degrees W, Pacific basin (negative = west)
  const latitude = -10 + rand() * 50; // degrees N, equator to mid-latitude
  const baseTemp = 29 - 0.32 * Math.abs(latitude - 5); // warmer near the equator
  const gradient = (rawLongitude + 170) * 0.02; // mild east-west drift
  const noise = (rand() - 0.5) * 2.5;
  const seaSurfaceTemp = baseTemp + gradient + noise;
  const longitudeW = -rawLongitude; // positive magnitude, paired with the "(°W)" suffix below
  points.push([longitudeW, latitude, Number(seaSurfaceTemp.toFixed(2))]);
}

const temps = points.map((p) => p[2]);
const tempMin = Math.min(...temps);
const tempMax = Math.max(...temps);
let warmest = points[0];
let coldest = points[0];
for (const p of points) {
  if (p[2] > warmest[2]) warmest = p;
  if (p[2] < coldest[2]) coldest = p;
}

// --- Init --------------------------------------------------------------------
const chart = echarts.init(document.getElementById("container"));

// --- Option --------------------------------------------------------------------
chart.setOption({
  animation: false,
  backgroundColor: "transparent",
  title: {
    text: "scatter-color-mapped · javascript · echarts · anyplot.ai",
    left: "center",
    textStyle: { color: t.ink, fontSize: 22, fontWeight: 500 },
  },
  grid: { left: 90, right: 220, top: 100, bottom: 90 },
  xAxis: {
    type: "value",
    name: "Longitude (°W)",
    nameLocation: "middle",
    nameGap: 40,
    nameTextStyle: { color: t.ink, fontSize: 16 },
    min: 110,
    max: 170,
    axisLabel: { color: t.inkSoft, fontSize: 14 },
    axisLine: { lineStyle: { color: t.inkSoft } },
    splitLine: { lineStyle: { color: t.grid, opacity: 0.6 } },
  },
  yAxis: {
    type: "value",
    name: "Latitude (°N)",
    nameLocation: "middle",
    nameGap: 55,
    nameTextStyle: { color: t.ink, fontSize: 16 },
    min: -10,
    max: 40,
    axisLabel: { color: t.inkSoft, fontSize: 14 },
    axisLine: { lineStyle: { color: t.inkSoft } },
    splitLine: { lineStyle: { color: t.grid, opacity: 0.6 } },
  },
  visualMap: {
    type: "continuous",
    dimension: 2,
    min: Math.floor(tempMin),
    max: Math.ceil(tempMax),
    orient: "vertical",
    right: 40,
    top: "middle",
    itemHeight: 500,
    text: ["Sea Surface Temp (°C)", ""],
    textStyle: { color: t.inkSoft, fontSize: 14 },
    inRange: { color: t.seq },
    calculable: true,
  },
  series: [
    {
      type: "scatter",
      data: points,
      symbolSize: 16,
      itemStyle: {
        opacity: 0.75,
        borderColor: t.pageBg,
        borderWidth: 1,
      },
      markPoint: {
        symbol: "circle",
        symbolSize: 30,
        itemStyle: { color: "transparent", borderColor: t.ink, borderWidth: 2 },
        label: {
          color: t.ink,
          fontSize: 13,
          fontWeight: 600,
          position: "top",
          formatter: (p) => `${p.data.name} ${p.value.toFixed(1)}°C`,
        },
        data: [
          { name: "Warmest", coord: [warmest[0], warmest[1]], value: warmest[2] },
          { name: "Coldest", coord: [coldest[0], coldest[1]], value: coldest[2] },
        ],
      },
    },
  ],
});
Runnable source as JSON, for any HTTP client: https://api.anyplot.ai/specs/scatter-color-mapped/echarts/code. Any spec id and library id listed in llms-full.txt fit the same URL shape; every URL below is complete and callable.
{
  "spec_id": "scatter-color-mapped",
  "language": "javascript",
  "library": "echarts",
  "page": "https://anyplot.ai/scatter-color-mapped/javascript/echarts",
  "hub": "https://anyplot.ai/scatter-color-mapped",
  "code_json": "https://api.anyplot.ai/specs/scatter-color-mapped/echarts/code",
  "spec_json": "https://api.anyplot.ai/specs/scatter-color-mapped",
  "render_light_png": "https://storage.googleapis.com/anyplot-images/plots/scatter-color-mapped/javascript/echarts/plot-light.png",
  "render_dark_png": "https://storage.googleapis.com/anyplot-images/plots/scatter-color-mapped/javascript/echarts/plot-dark.png",
  "interactive_light_html": "https://storage.googleapis.com/anyplot-images/plots/scatter-color-mapped/javascript/echarts/plot-light.html",
  "interactive_dark_html": "https://storage.googleapis.com/anyplot-images/plots/scatter-color-mapped/javascript/echarts/plot-dark.html",
  "quality_score": 90.0,
  "license": "MIT",
  "guide": "https://anyplot.ai/llms.txt"
}
Part of Color-Mapped Scatter Plot on anyplot.ai.