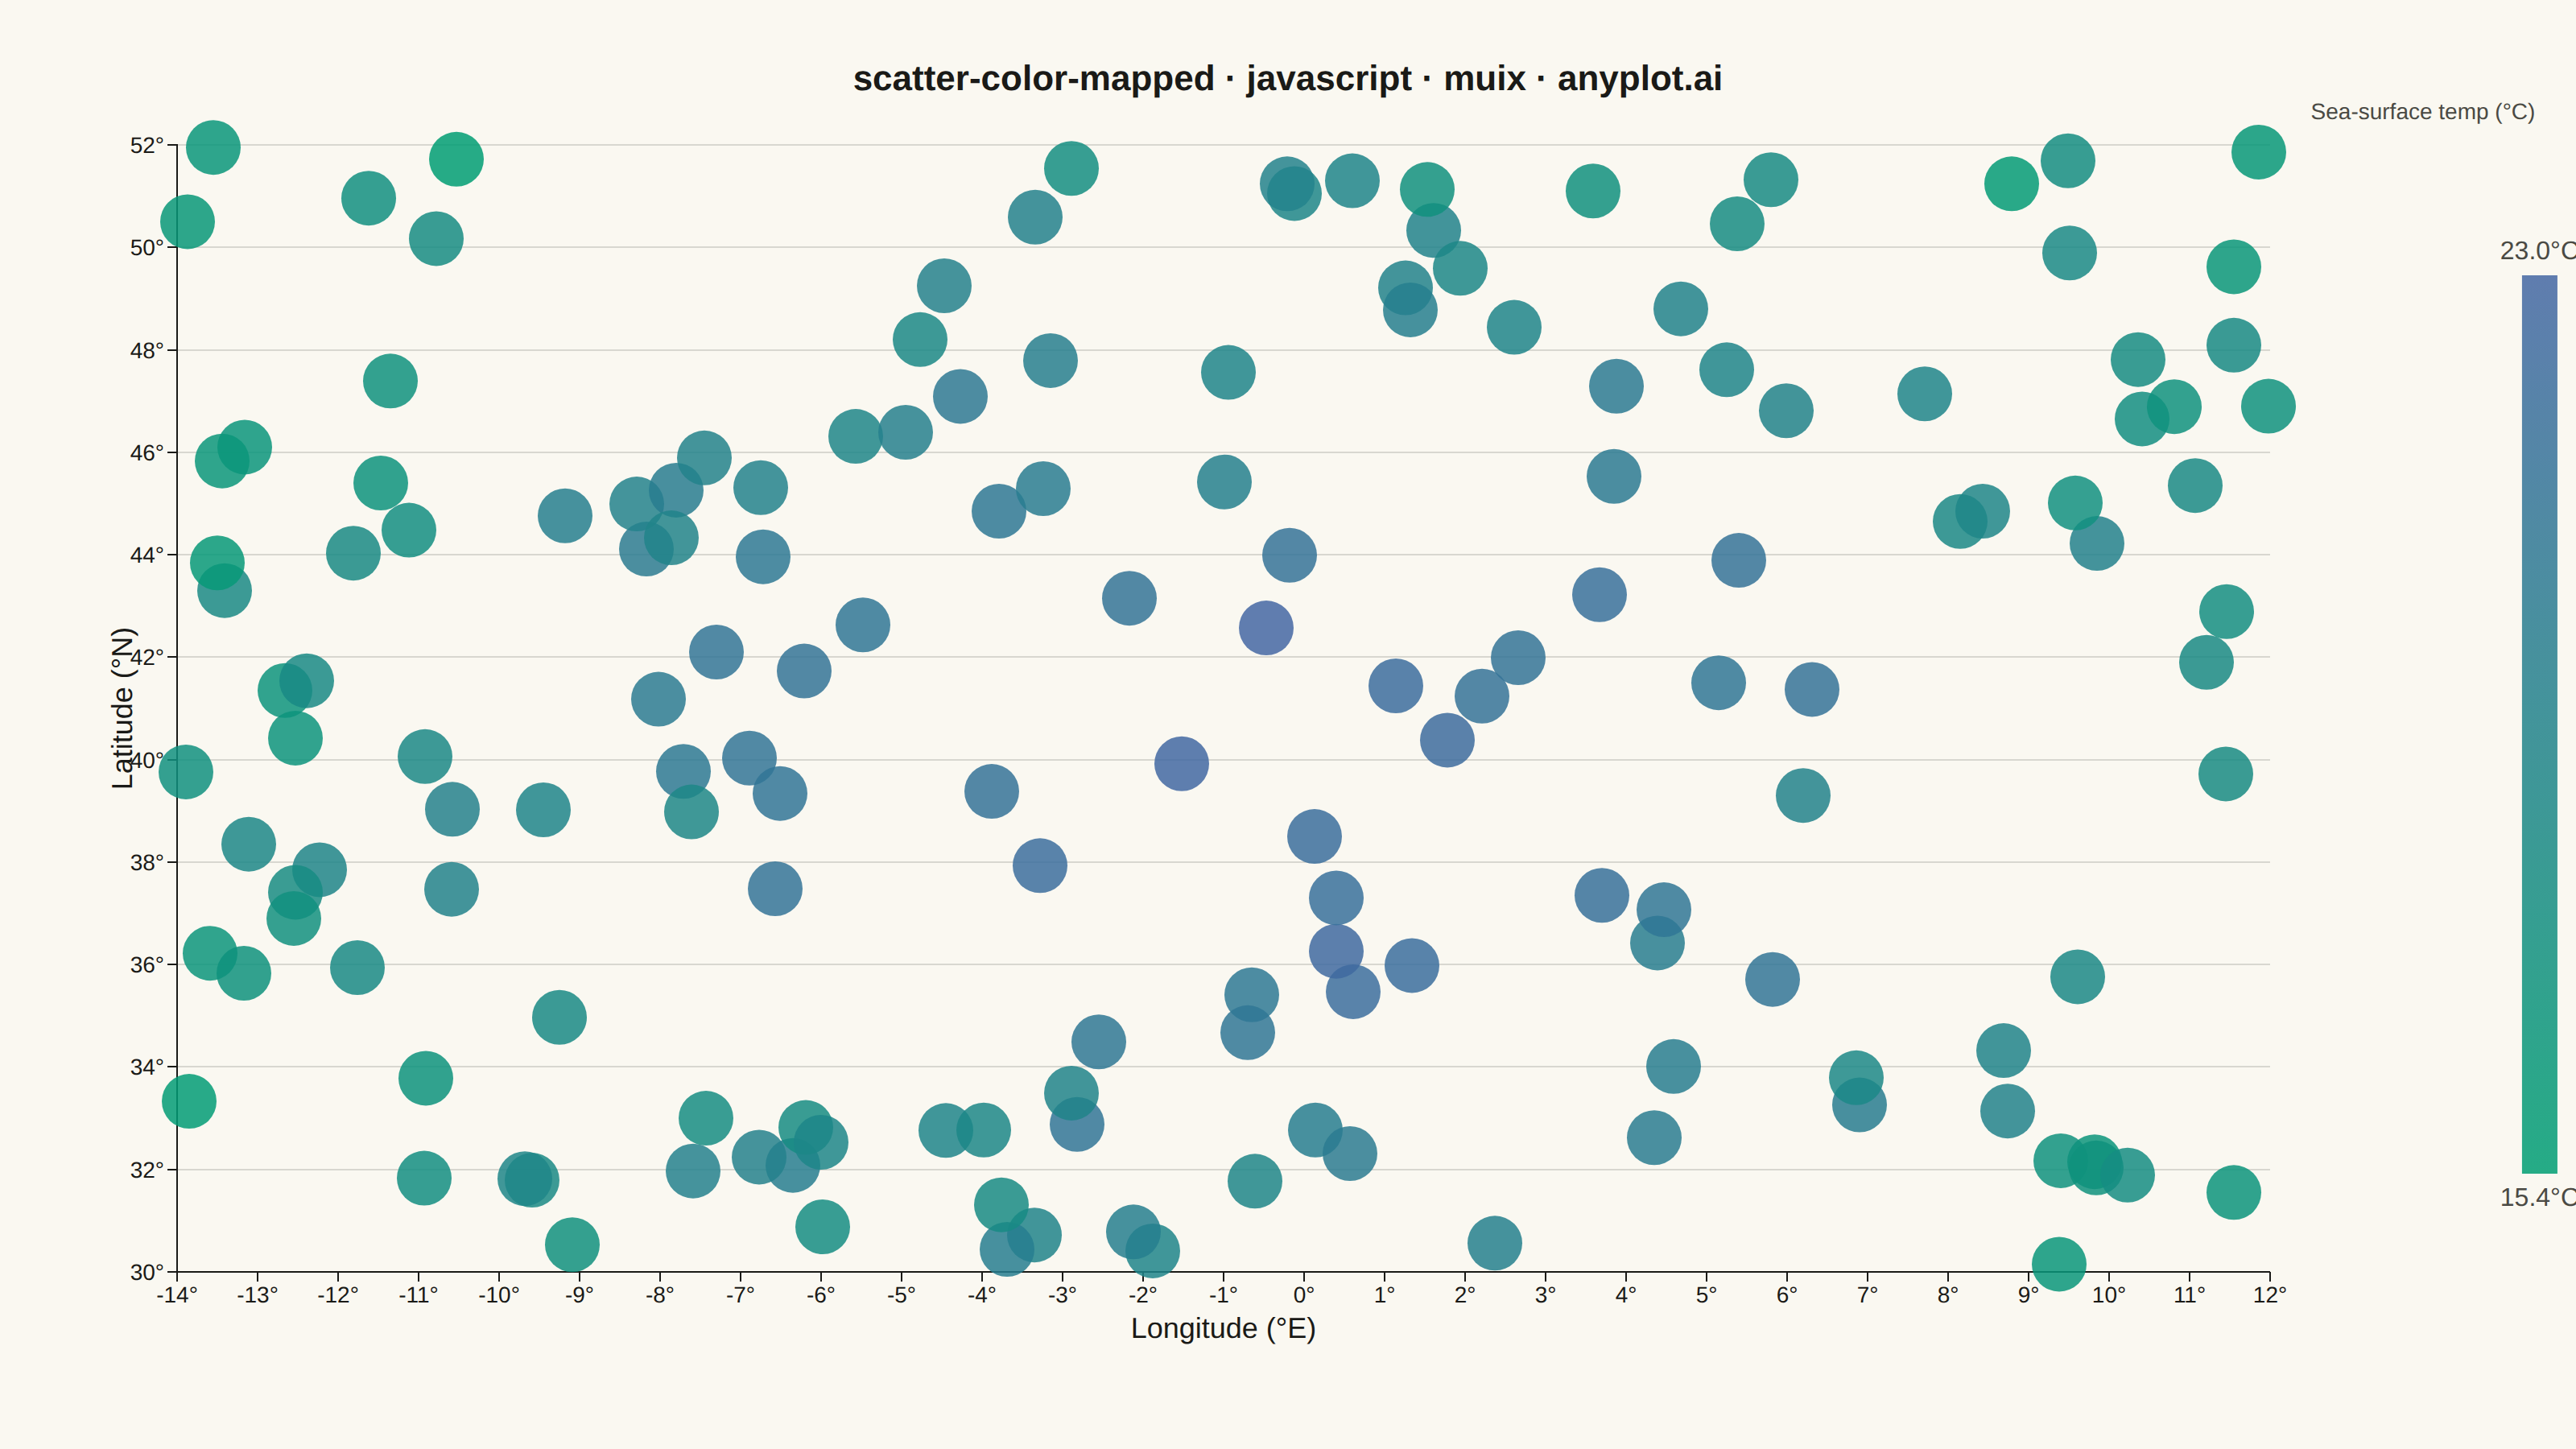
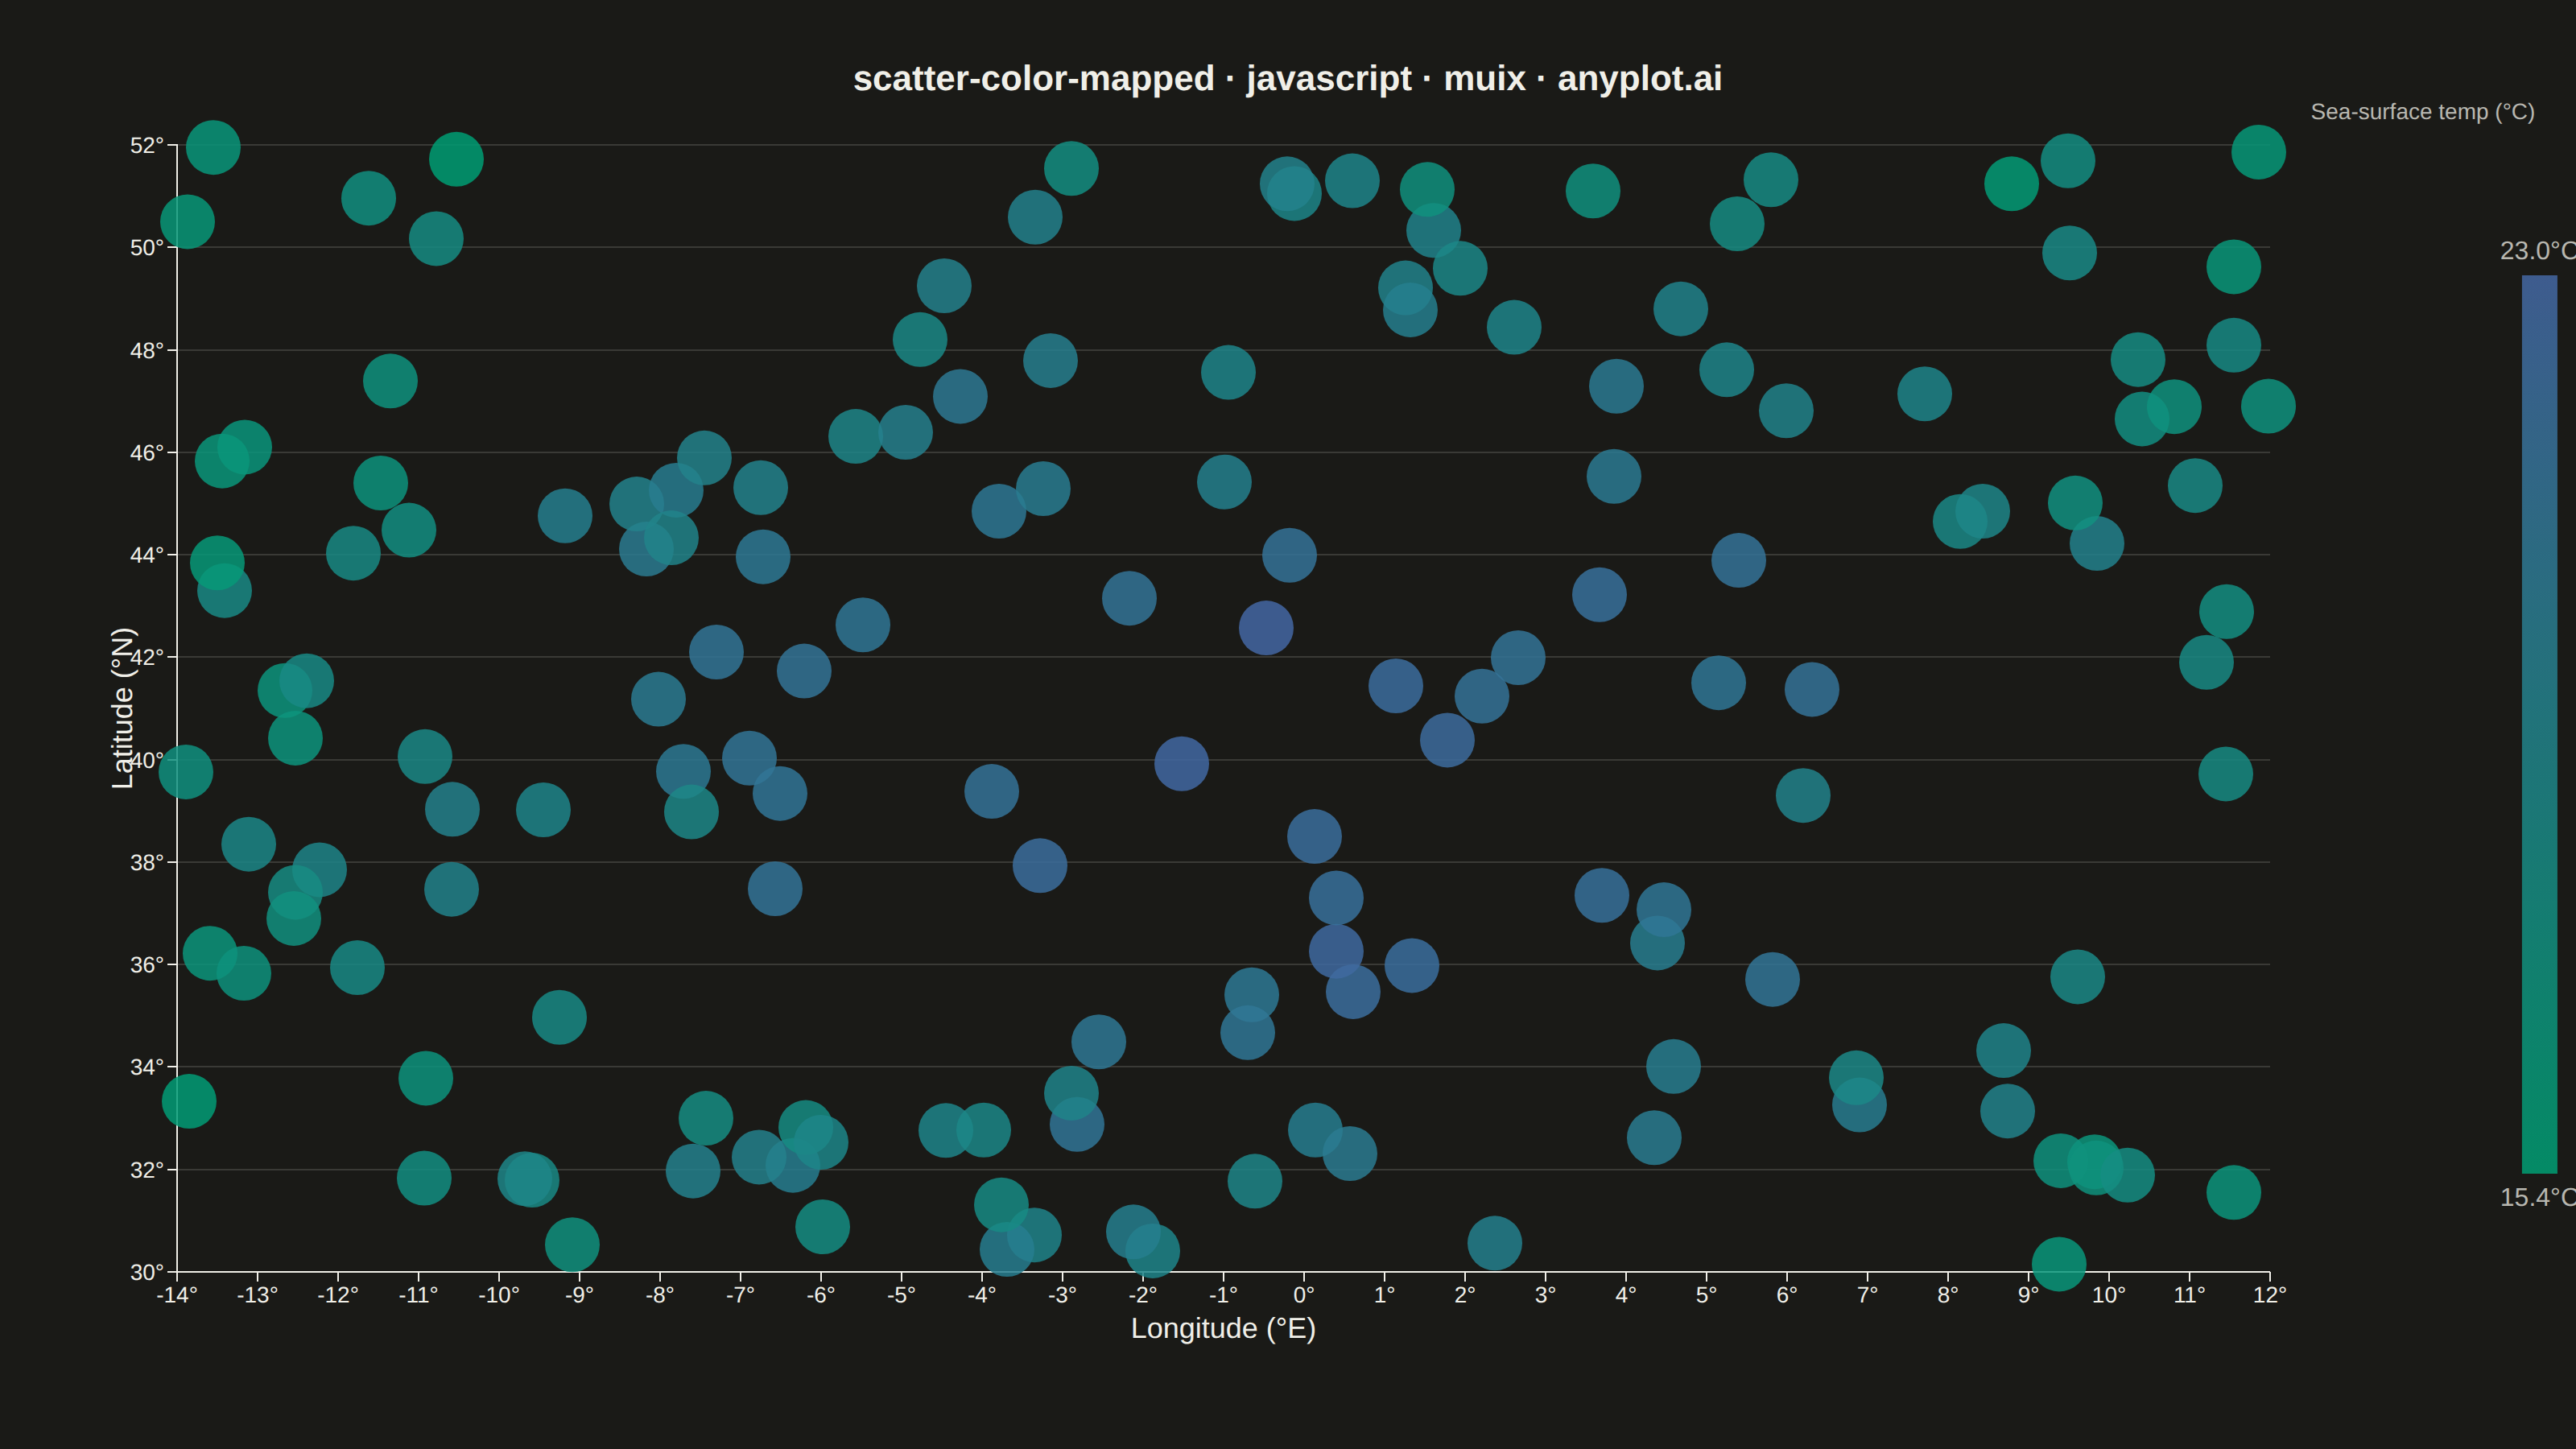
The same plot in 14 other libraries — JavaScript: Chart.js, D3.js, Apache ECharts, Highcharts; Python: Altair, Bokeh, lets-plot, Matplotlib, Plotly, plotnine, Pygal, Seaborn; R: ggplot2; Julia: Makie.jl. Compare all 15 side by side: Color-Mapped Scatter Plot in Python, R, Julia and JavaScript.
A scatter plot that encodes a third continuous variable using a colormap, allowing visualization of three dimensions on a 2D plane. This visualization is essential for exploring multivariate relationships where the third variable represents intensity, magnitude, or any continuous measurement. A colorbar provides a reference scale for interpreting the color values.
// anyplot.ai
// scatter-color-mapped: Color-Mapped Scatter Plot
// Library: muix 7.29.1 | JavaScript 22.23.2
// Quality: 87/100 | Created: 2026-09-05
import { ScatterChart } from "@mui/x-charts/ScatterChart";
import { ContinuousColorLegend } from "@mui/x-charts/ChartsLegend";
import { ChartsText } from "@mui/x-charts/ChartsText";

const t = window.ANYPLOT_TOKENS;
const { width, height } = window.ANYPLOT_SIZE;

// --- Data (in-memory, deterministic) ----------------------------------------
// Ocean buoy network: sea-surface temperature sampled across a survey grid.
// A warm-core current near (0°E, 40°N) fades outward, so temperature (color)
// traces a spatial pattern rather than pure noise.
let seed = 42;
const nextRandom = () => {
  seed = (Math.imul(seed, 1103515245) + 12345) & 0x7fffffff;
  return seed / 0x7fffffff;
};

const STATION_COUNT = 160;
const buoys = [];
for (let i = 0; i < STATION_COUNT; i += 1) {
  const longitude = -14 + nextRandom() * 26;
  const latitude = 30 + nextRandom() * 22;
  const distanceFromCore = Math.hypot(longitude - 0, latitude - 40);
  const temperature = 23 - 0.42 * distanceFromCore + (nextRandom() - 0.5) * 2.4;
  buoys.push({
    id: i,
    x: Number(longitude.toFixed(2)),
    y: Number(latitude.toFixed(2)),
    z: Number(temperature.toFixed(2)),
  });
}

const temperatures = buoys.map((buoy) => buoy.z);
const tempMin = Math.min(...temperatures);
const tempMax = Math.max(...temperatures);

// Overlapping buoys (dense clusters near the warm core) stay distinguishable
// with moderate transparency baked into the colormap stops themselves, since
// the scatter series has no direct opacity prop.
const withAlpha = (hex: string, alpha: number) => {
  const n = parseInt(hex.slice(1), 16);
  const r = (n >> 16) & 255;
  const g = (n >> 8) & 255;
  const b = n & 255;
  return `rgba(${r}, ${g}, ${b}, ${alpha})`;
};
const MARKER_ALPHA = 0.85;

// --- Title (fontsize scales with title length, see plot-generator.md) -------
const TITLE = "scatter-color-mapped · javascript · muix · anyplot.ai";
const TITLE_FONTSIZE = Math.round(22 * (TITLE.length > 67 ? 67 / TITLE.length : 1));

// --- Chart (default-exported component — the harness mounts it) ------------
export default function Chart() {
  return (
    <ScatterChart
      width={width}
      height={height}
      skipAnimation
      legend={{ hidden: true }}
      grid={{ horizontal: true }}
      margin={{ top: 90, right: 190, bottom: 110, left: 110 }}
      xAxis={[
        {
          id: "longitude",
          label: "Longitude (°E)",
          labelStyle: { fontSize: 18 },
          tickLabelStyle: { fontSize: 14 },
          valueFormatter: (value: number) => `${value}°`,
        },
      ]}
      yAxis={[
        {
          id: "latitude",
          label: "Latitude (°N)",
          labelStyle: { fontSize: 18 },
          tickLabelStyle: { fontSize: 14 },
          valueFormatter: (value: number) => `${value}°`,
        },
      ]}
      zAxis={[
        {
          id: "temperature",
          min: tempMin,
          max: tempMax,
          colorMap: {
            type: "continuous",
            min: tempMin,
            max: tempMax,
            color: [withAlpha(t.seq[0], MARKER_ALPHA), withAlpha(t.seq[1], MARKER_ALPHA)],
          },
        },
      ]}
      series={[
        {
          id: "buoys",
          label: "Ocean buoys",
          data: buoys,
          markerSize: 17,
          color: t.palette[0],
        },
      ]}
    >
      <ChartsText
        text={TITLE}
        x={width / 2}
        y={40}
        style={{
          fontSize: TITLE_FONTSIZE,
          fontWeight: 600,
          fill: t.ink,
          textAnchor: "middle",
          dominantBaseline: "hanging",
        }}
      />
      <ChartsText
        text="Sea-surface temp (°C)"
        x={width - 95}
        y={64}
        style={{
          fontSize: 14,
          fill: t.inkSoft,
          textAnchor: "middle",
          dominantBaseline: "hanging",
        }}
      />
      <ContinuousColorLegend
        axisDirection="z"
        direction="column"
        position={{ horizontal: "right", vertical: "middle" }}
        length="62%"
        thickness={22}
        spacing={10}
        align="middle"
        minLabel={({ value }) => `${Number(value).toFixed(1)}°C`}
        maxLabel={({ value }) => `${Number(value).toFixed(1)}°C`}
        labelStyle={{ fontSize: 16, fill: t.inkSoft }}
      />
    </ScatterChart>
  );
}
Runnable source as JSON, for any HTTP client: https://api.anyplot.ai/specs/scatter-color-mapped/muix/code. Any spec id and library id listed in llms-full.txt fit the same URL shape; every URL below is complete and callable.
{
  "spec_id": "scatter-color-mapped",
  "language": "javascript",
  "library": "muix",
  "page": "https://anyplot.ai/scatter-color-mapped/javascript/muix",
  "hub": "https://anyplot.ai/scatter-color-mapped",
  "code_json": "https://api.anyplot.ai/specs/scatter-color-mapped/muix/code",
  "spec_json": "https://api.anyplot.ai/specs/scatter-color-mapped",
  "render_light_png": "https://storage.googleapis.com/anyplot-images/plots/scatter-color-mapped/javascript/muix/plot-light.png",
  "render_dark_png": "https://storage.googleapis.com/anyplot-images/plots/scatter-color-mapped/javascript/muix/plot-dark.png",
  "interactive_light_html": "https://storage.googleapis.com/anyplot-images/plots/scatter-color-mapped/javascript/muix/plot-light.html",
  "interactive_dark_html": "https://storage.googleapis.com/anyplot-images/plots/scatter-color-mapped/javascript/muix/plot-dark.html",
  "quality_score": 87.0,
  "license": "MIT",
  "guide": "https://anyplot.ai/llms.txt"
}
Part of Color-Mapped Scatter Plot on anyplot.ai.