The same plot in 14 other libraries — JavaScript: Chart.js, D3.js, Highcharts, MUI X Charts; Python: Altair, Bokeh, lets-plot, Matplotlib, Plotly, plotnine, Pygal, Seaborn; R: ggplot2; Julia: Makie.jl. Compare all 15 side by side: Complex Plane Visualization (Argand Diagram) in Python, R, Julia and JavaScript.
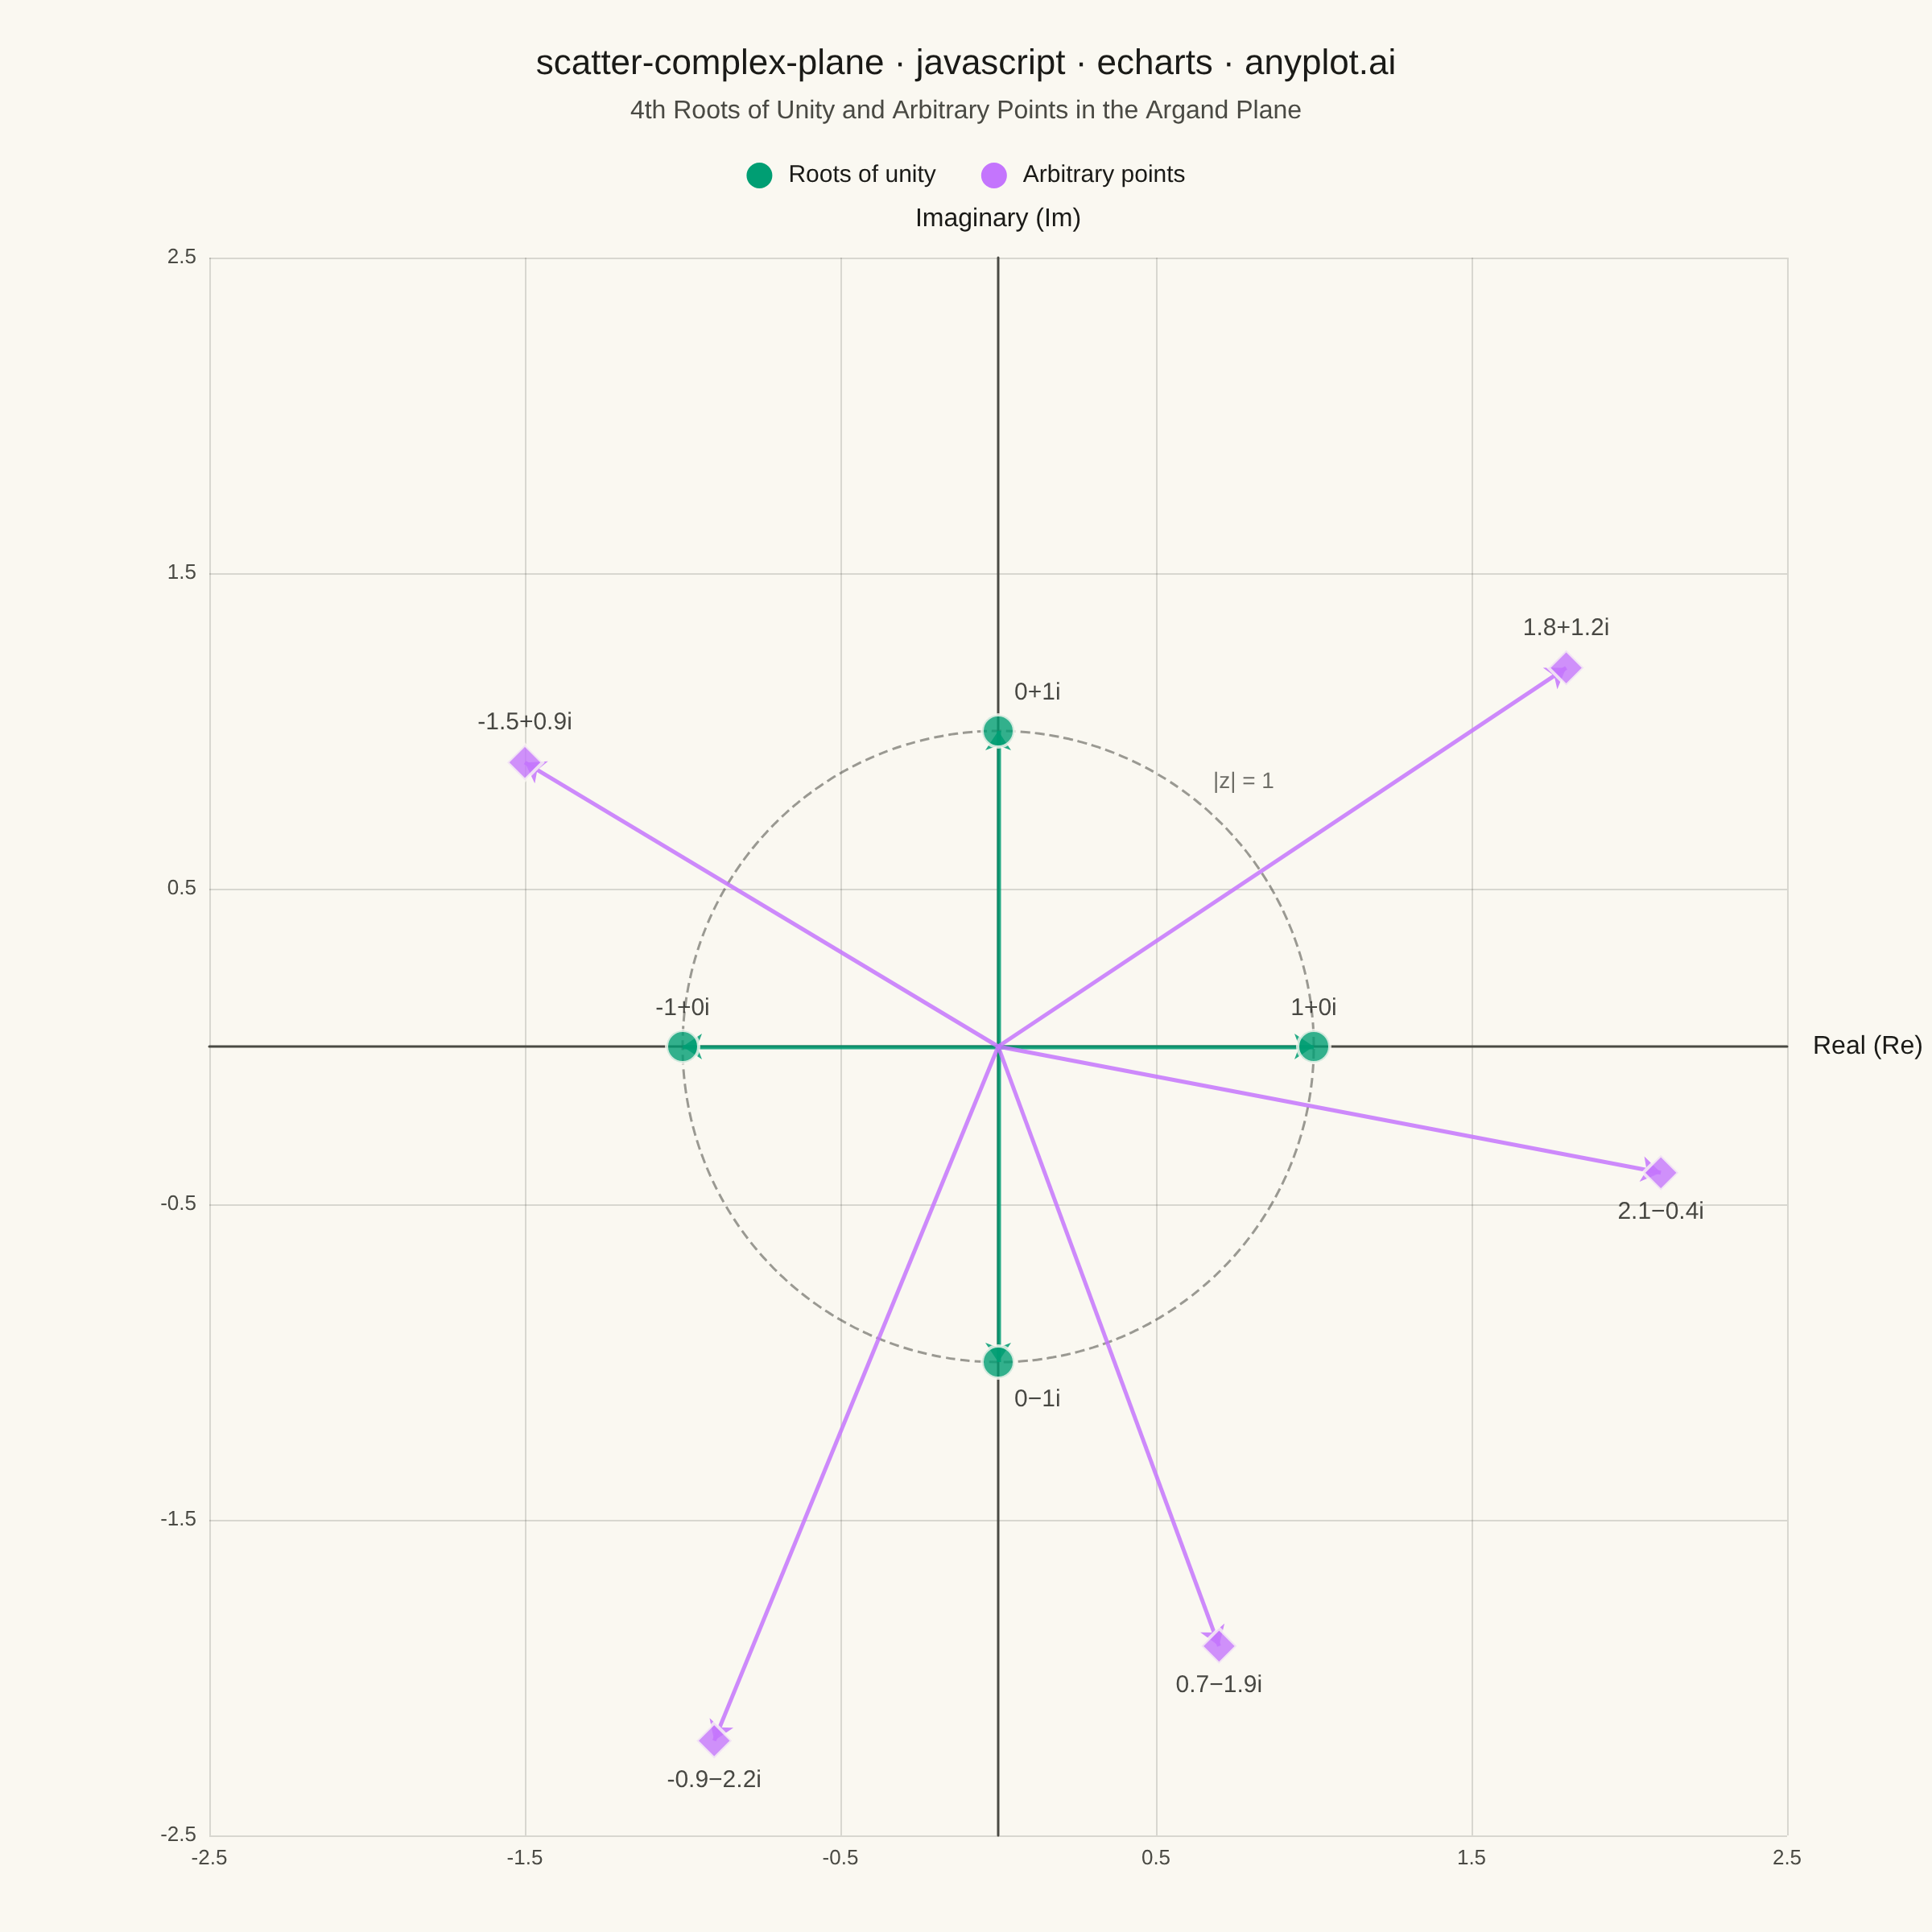
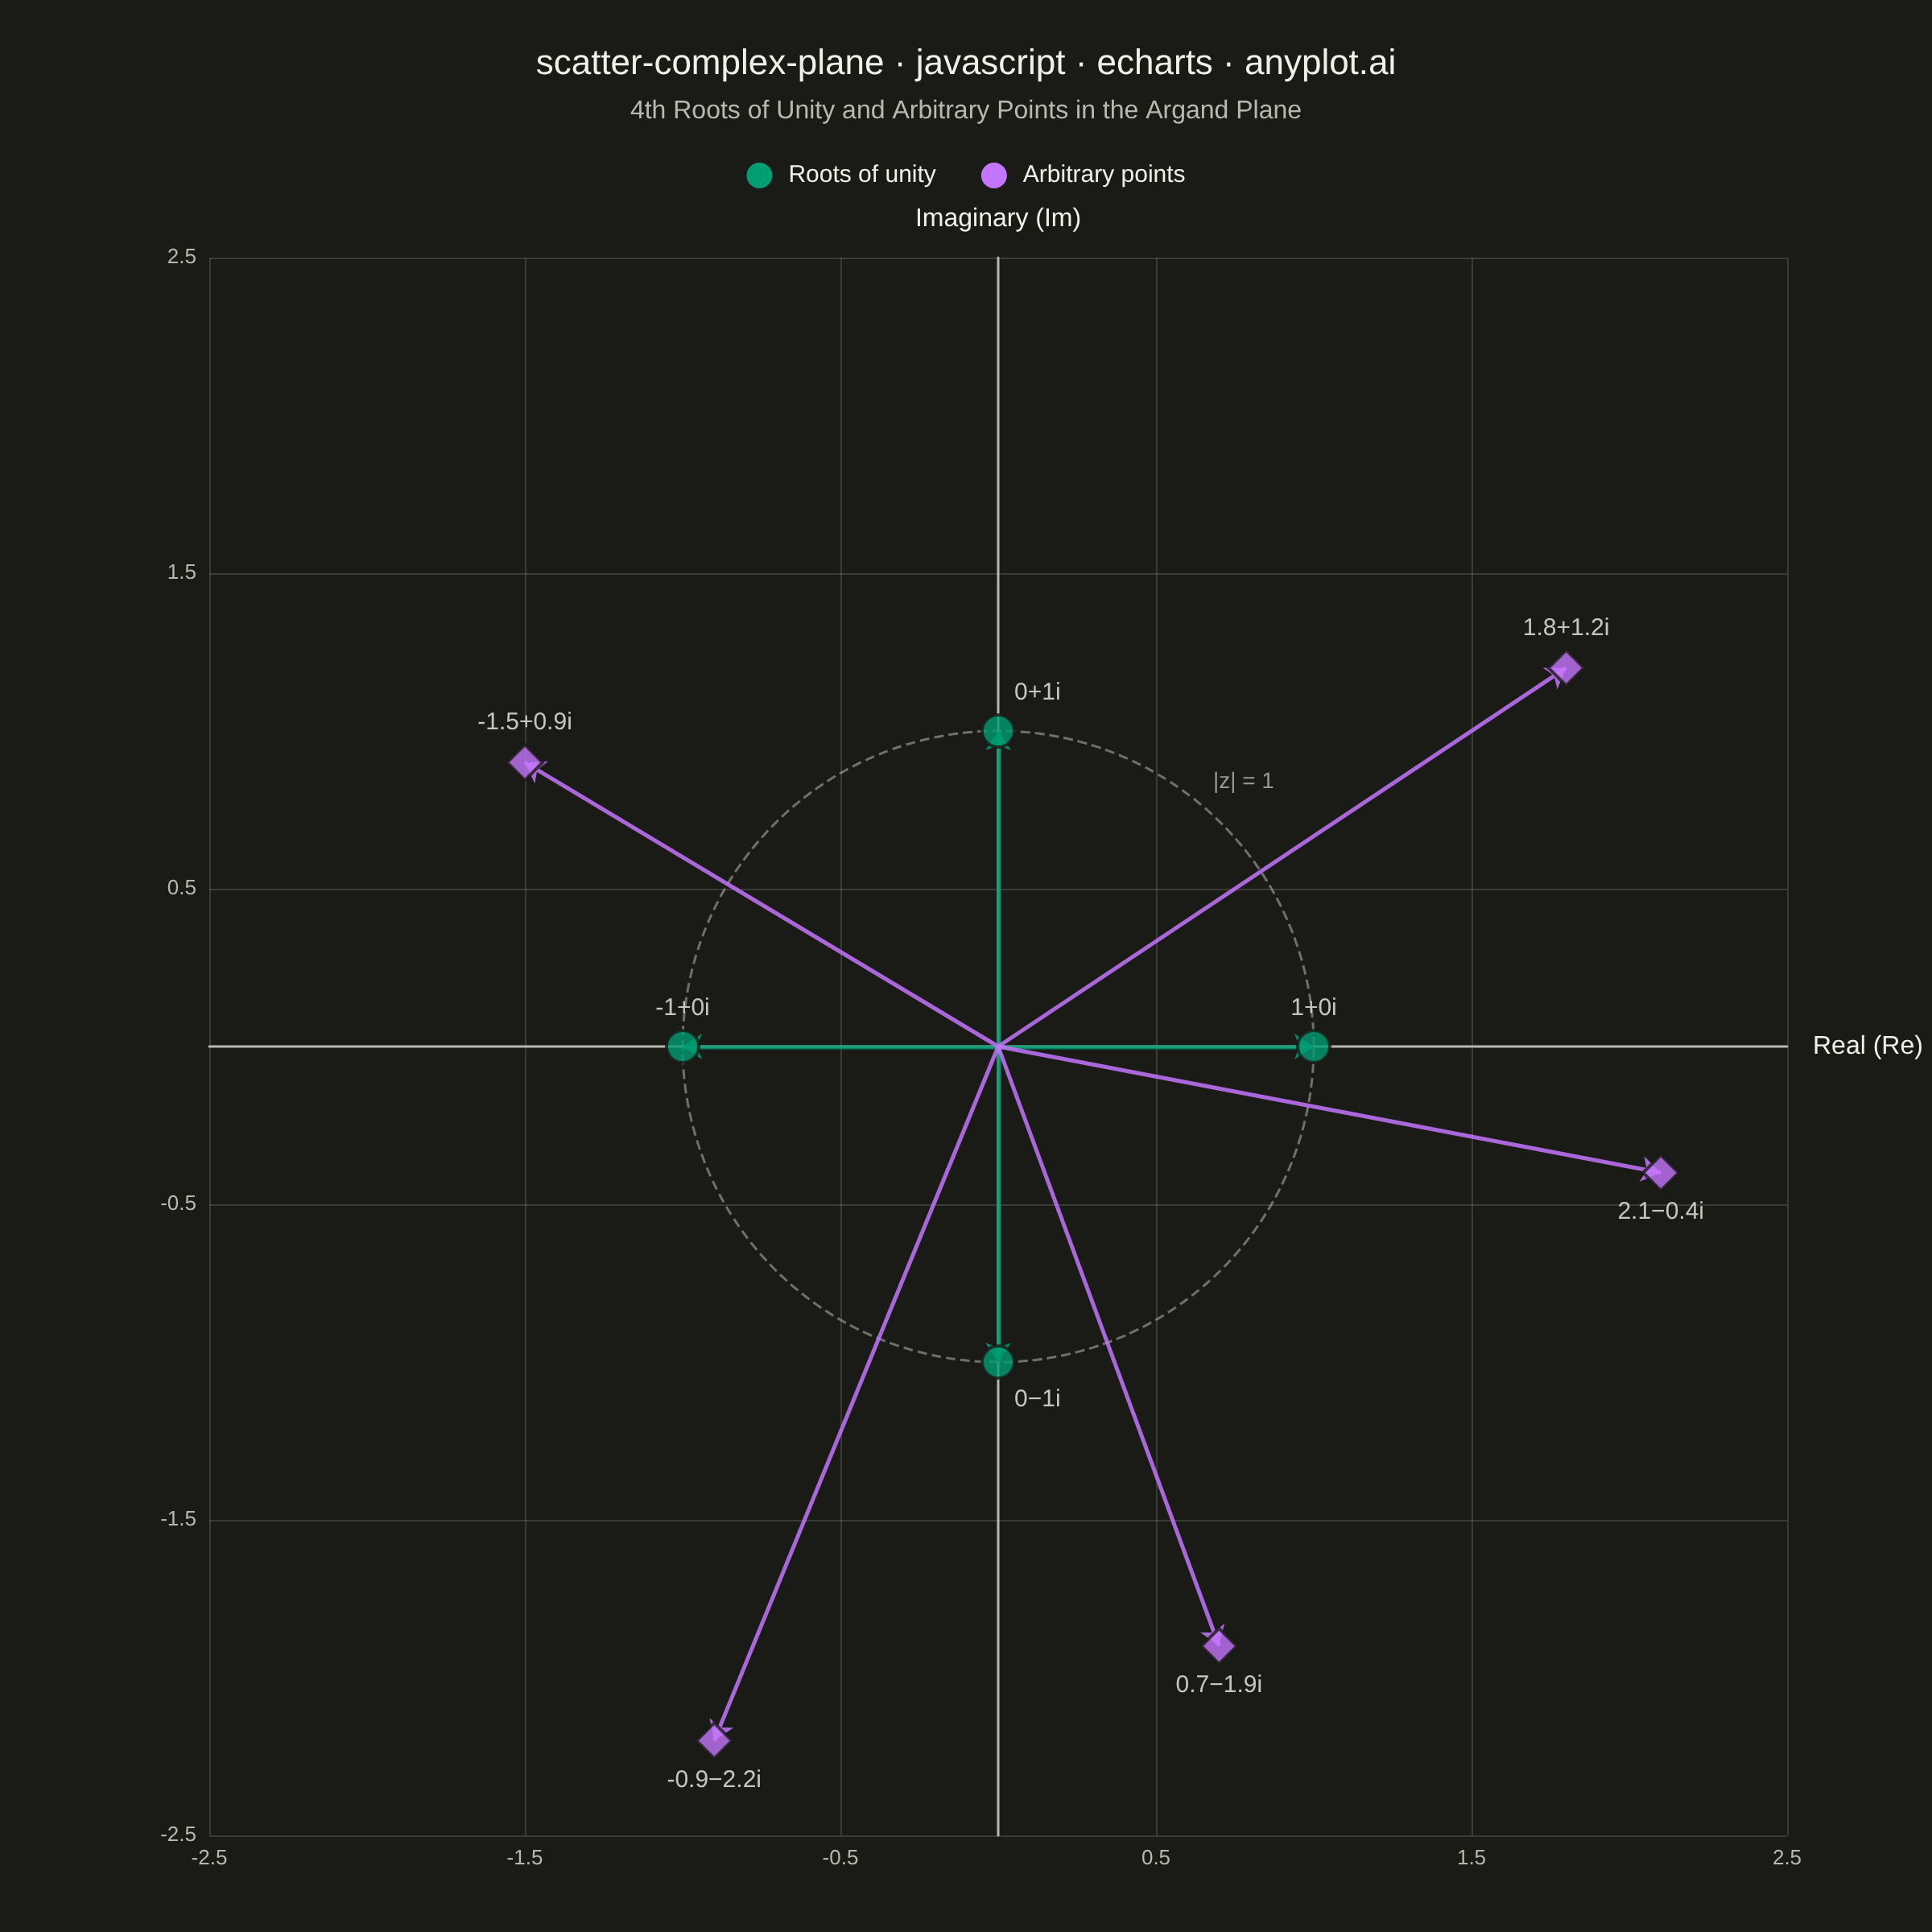
An Argand diagram plots complex numbers as points in the complex plane, with the real part on the x-axis and the imaginary part on the y-axis. Vectors from the origin to each point illustrate magnitude and phase angle, while a unit circle provides a geometric reference. This visualization is foundational for complex analysis, signal processing, and understanding operations like addition, multiplication, and roots of unity geometrically.
// anyplot.ai
// scatter-complex-plane: Complex Plane Visualization (Argand Diagram)
// Library: echarts 6.1.0 | JavaScript 22.23.2
// Quality: 94/100 | Created: 2026-08-26
//# anyplot-orientation: square

const t = window.ANYPLOT_TOKENS;

// --- Data (in-memory, deterministic) ----------------------------------------
// 4th roots of unity: solutions of z^4 = 1, spaced 90° apart on |z| = 1
const rootsOfUnity = [
  { re: 1, im: 0 },
  { re: 0, im: 1 },
  { re: -1, im: 0 },
  { re: 0, im: -1 },
];

// A few arbitrary complex numbers off the unit circle
const arbitraryPoints = [
  { re: 1.8, im: 1.2 },
  { re: -1.5, im: 0.9 },
  { re: 0.7, im: -1.9 },
  { re: -0.9, im: -2.2 },
  { re: 2.1, im: -0.4 },
];

function fmtNum(n) {
  return Number.isInteger(n) ? String(n) : n.toFixed(1);
}

function formatComplex(re, im) {
  const sign = im < 0 ? "−" : "+";
  return `${fmtNum(re)}${sign}${fmtNum(Math.abs(im))}i`;
}

function toVectorData(points) {
  return points.map((p) => ({
    coords: [
      [0, 0],
      [p.re, p.im],
    ],
  }));
}

function toPointData(points) {
  return points.map((p) => {
    // Points sitting exactly on the imaginary axis (re === 0) would have their
    // label centered at x=0, so the vertical axis line cuts through the text;
    // nudge those labels sideways and left-align them clear of the line.
    const onImaginaryAxis = p.re === 0;
    return {
      value: [p.re, p.im],
      label: {
        show: true,
        position: p.im >= 0 ? "top" : "bottom",
        align: onImaginaryAxis ? "left" : "center",
        offset: onImaginaryAxis ? [10, 0] : [0, 0],
        formatter: () => formatComplex(p.re, p.im),
        color: t.ink,
        fontSize: 15,
        fontWeight: 500,
      },
    };
  });
}

// Unit circle reference (dashed), 144 segments
const circlePoints = Array.from({ length: 145 }, (_, i) => {
  const theta = (i / 144) * 2 * Math.PI;
  return [Math.cos(theta), Math.sin(theta)];
});

// --- Series -------------------------------------------------------------
const unitCircle = {
  type: "line",
  data: circlePoints,
  showSymbol: false,
  smooth: true,
  lineStyle: { type: "dashed", width: 1.5, color: t.inkSoft, opacity: 0.55 },
  silent: true,
  z: 1,
};

const unitCircleLabel = {
  type: "scatter",
  data: [[Math.cos(Math.PI / 4) * 1.1, Math.sin(Math.PI / 4) * 1.1]],
  symbolSize: 0,
  silent: true,
  label: {
    show: true,
    formatter: "|z| = 1",
    color: t.inkSoft,
    fontSize: 14,
    position: "top",
  },
  z: 1,
};

const rootsVectors = {
  name: "Roots of unity",
  type: "lines",
  coordinateSystem: "cartesian2d",
  data: toVectorData(rootsOfUnity),
  lineStyle: { color: t.palette[0], width: 2.5, opacity: 0.85 },
  symbol: ["none", "arrow"],
  symbolSize: [0, 12],
  silent: true,
  z: 3,
};

const arbitraryVectors = {
  name: "Arbitrary points",
  type: "lines",
  coordinateSystem: "cartesian2d",
  data: toVectorData(arbitraryPoints),
  lineStyle: { color: t.palette[1], width: 2.5, opacity: 0.85 },
  symbol: ["none", "arrow"],
  symbolSize: [0, 12],
  silent: true,
  z: 3,
};

const rootsMarkers = {
  name: "Roots of unity",
  type: "scatter",
  data: toPointData(rootsOfUnity),
  symbol: "circle",
  symbolSize: 20,
  itemStyle: { color: t.palette[0], borderColor: t.pageBg, borderWidth: 2 },
  z: 5,
};

const arbitraryMarkers = {
  name: "Arbitrary points",
  type: "scatter",
  data: toPointData(arbitraryPoints),
  symbol: "diamond",
  symbolSize: 22,
  itemStyle: { color: t.palette[1], borderColor: t.pageBg, borderWidth: 2 },
  z: 5,
};

// --- Chart --------------------------------------------------------------
const chart = echarts.init(document.getElementById("container"));
chart.setOption({
  animation: false,
  color: t.palette,
  backgroundColor: "transparent",
  title: {
    text: "scatter-complex-plane · javascript · echarts · anyplot.ai",
    subtext: "4th Roots of Unity and Arbitrary Points in the Argand Plane",
    left: "center",
    top: 24,
    itemGap: 10,
    textStyle: { color: t.ink, fontSize: 22, fontWeight: "500" },
    subtextStyle: { color: t.inkSoft, fontSize: 16 },
  },
  legend: {
    top: 96,
    left: "center",
    orient: "horizontal",
    textStyle: { color: t.ink, fontSize: 15 },
    itemGap: 28,
    itemWidth: 26,
    itemHeight: 14,
    icon: "circle",
  },
  grid: { left: 130, right: 90, top: 160, bottom: 60 },
  xAxis: {
    type: "value",
    min: -2.5,
    max: 2.5,
    interval: 1,
    name: "Real (Re)",
    nameLocation: "end",
    nameGap: 16,
    nameTextStyle: { color: t.ink, fontSize: 16 },
    axisLabel: { color: t.inkSoft, fontSize: 13 },
    axisLine: { onZero: true, lineStyle: { color: t.inkSoft, width: 1.5 } },
    axisTick: { show: false },
    splitLine: { show: true, lineStyle: { color: t.grid } },
  },
  yAxis: {
    type: "value",
    min: -2.5,
    max: 2.5,
    interval: 1,
    name: "Imaginary (Im)",
    nameLocation: "end",
    nameGap: 16,
    nameTextStyle: { color: t.ink, fontSize: 16 },
    axisLabel: { color: t.inkSoft, fontSize: 13 },
    axisLine: { onZero: true, lineStyle: { color: t.inkSoft, width: 1.5 } },
    axisTick: { show: false },
    splitLine: { show: true, lineStyle: { color: t.grid } },
  },
  tooltip: {
    trigger: "item",
    backgroundColor: t.elevatedBg,
    borderColor: t.grid,
    textStyle: { color: t.ink, fontSize: 14 },
    formatter: (params) => {
      if (params.seriesType !== "scatter") return "";
      const [re, im] = params.value;
      const r = Math.hypot(re, im);
      const thetaDeg = (Math.atan2(im, re) * 180) / Math.PI;
      return `<b>${params.seriesName}</b><br/>${formatComplex(re, im)}<br/>r = ${r.toFixed(2)}, θ = ${thetaDeg.toFixed(1)}°`;
    },
  },
  series: [
    unitCircle,
    unitCircleLabel,
    rootsVectors,
    arbitraryVectors,
    rootsMarkers,
    arbitraryMarkers,
  ],
});
Runnable source as JSON, for any HTTP client: https://api.anyplot.ai/specs/scatter-complex-plane/echarts/code. Any spec id and library id listed in llms-full.txt fit the same URL shape; every URL below is complete and callable.
{
  "spec_id": "scatter-complex-plane",
  "language": "javascript",
  "library": "echarts",
  "page": "https://anyplot.ai/scatter-complex-plane/javascript/echarts",
  "hub": "https://anyplot.ai/scatter-complex-plane",
  "code_json": "https://api.anyplot.ai/specs/scatter-complex-plane/echarts/code",
  "spec_json": "https://api.anyplot.ai/specs/scatter-complex-plane",
  "render_light_png": "https://storage.googleapis.com/anyplot-images/plots/scatter-complex-plane/javascript/echarts/plot-light.png",
  "render_dark_png": "https://storage.googleapis.com/anyplot-images/plots/scatter-complex-plane/javascript/echarts/plot-dark.png",
  "interactive_light_html": "https://storage.googleapis.com/anyplot-images/plots/scatter-complex-plane/javascript/echarts/plot-light.html",
  "interactive_dark_html": "https://storage.googleapis.com/anyplot-images/plots/scatter-complex-plane/javascript/echarts/plot-dark.html",
  "quality_score": 94.0,
  "license": "MIT",
  "guide": "https://anyplot.ai/llms.txt"
}
Part of Complex Plane Visualization (Argand Diagram) on anyplot.ai.