The same plot in 14 other libraries — JavaScript: Chart.js, D3.js, Apache ECharts, MUI X Charts; Python: Altair, Bokeh, lets-plot, Matplotlib, Plotly, plotnine, Pygal, Seaborn; R: ggplot2; Julia: Makie.jl. Compare all 15 side by side: Complex Plane Visualization (Argand Diagram) in Python, R, Julia and JavaScript.
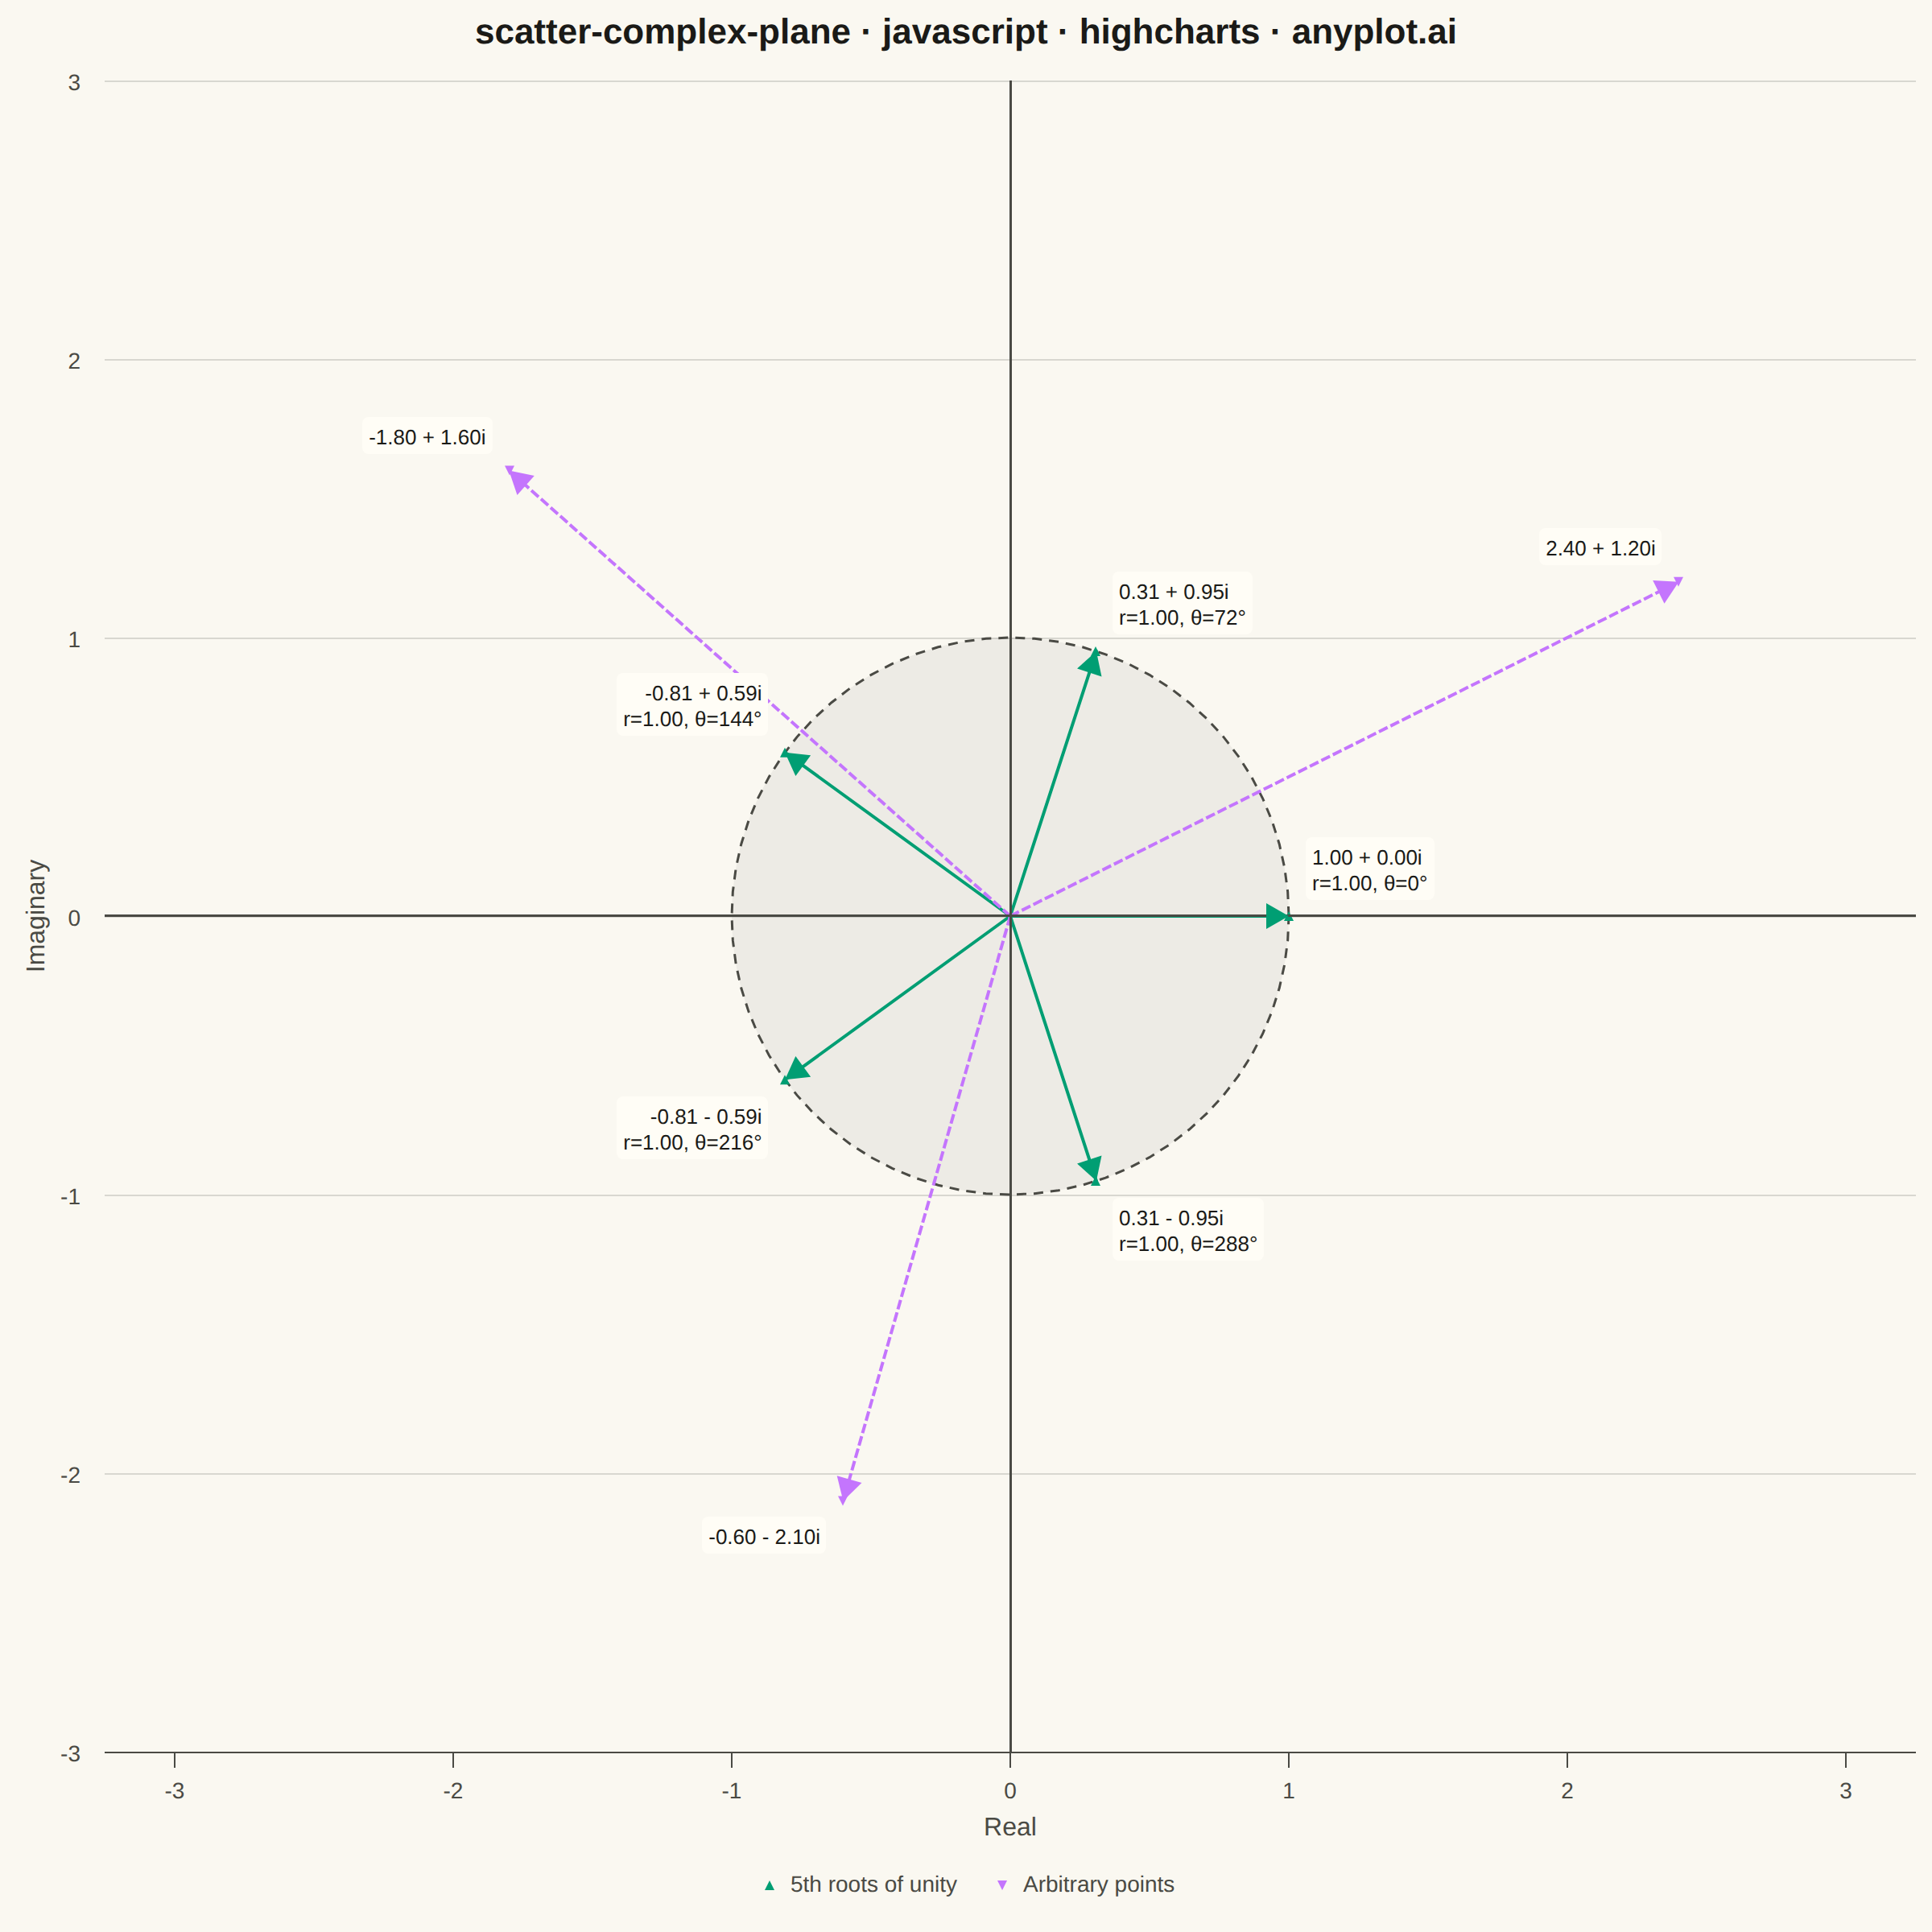
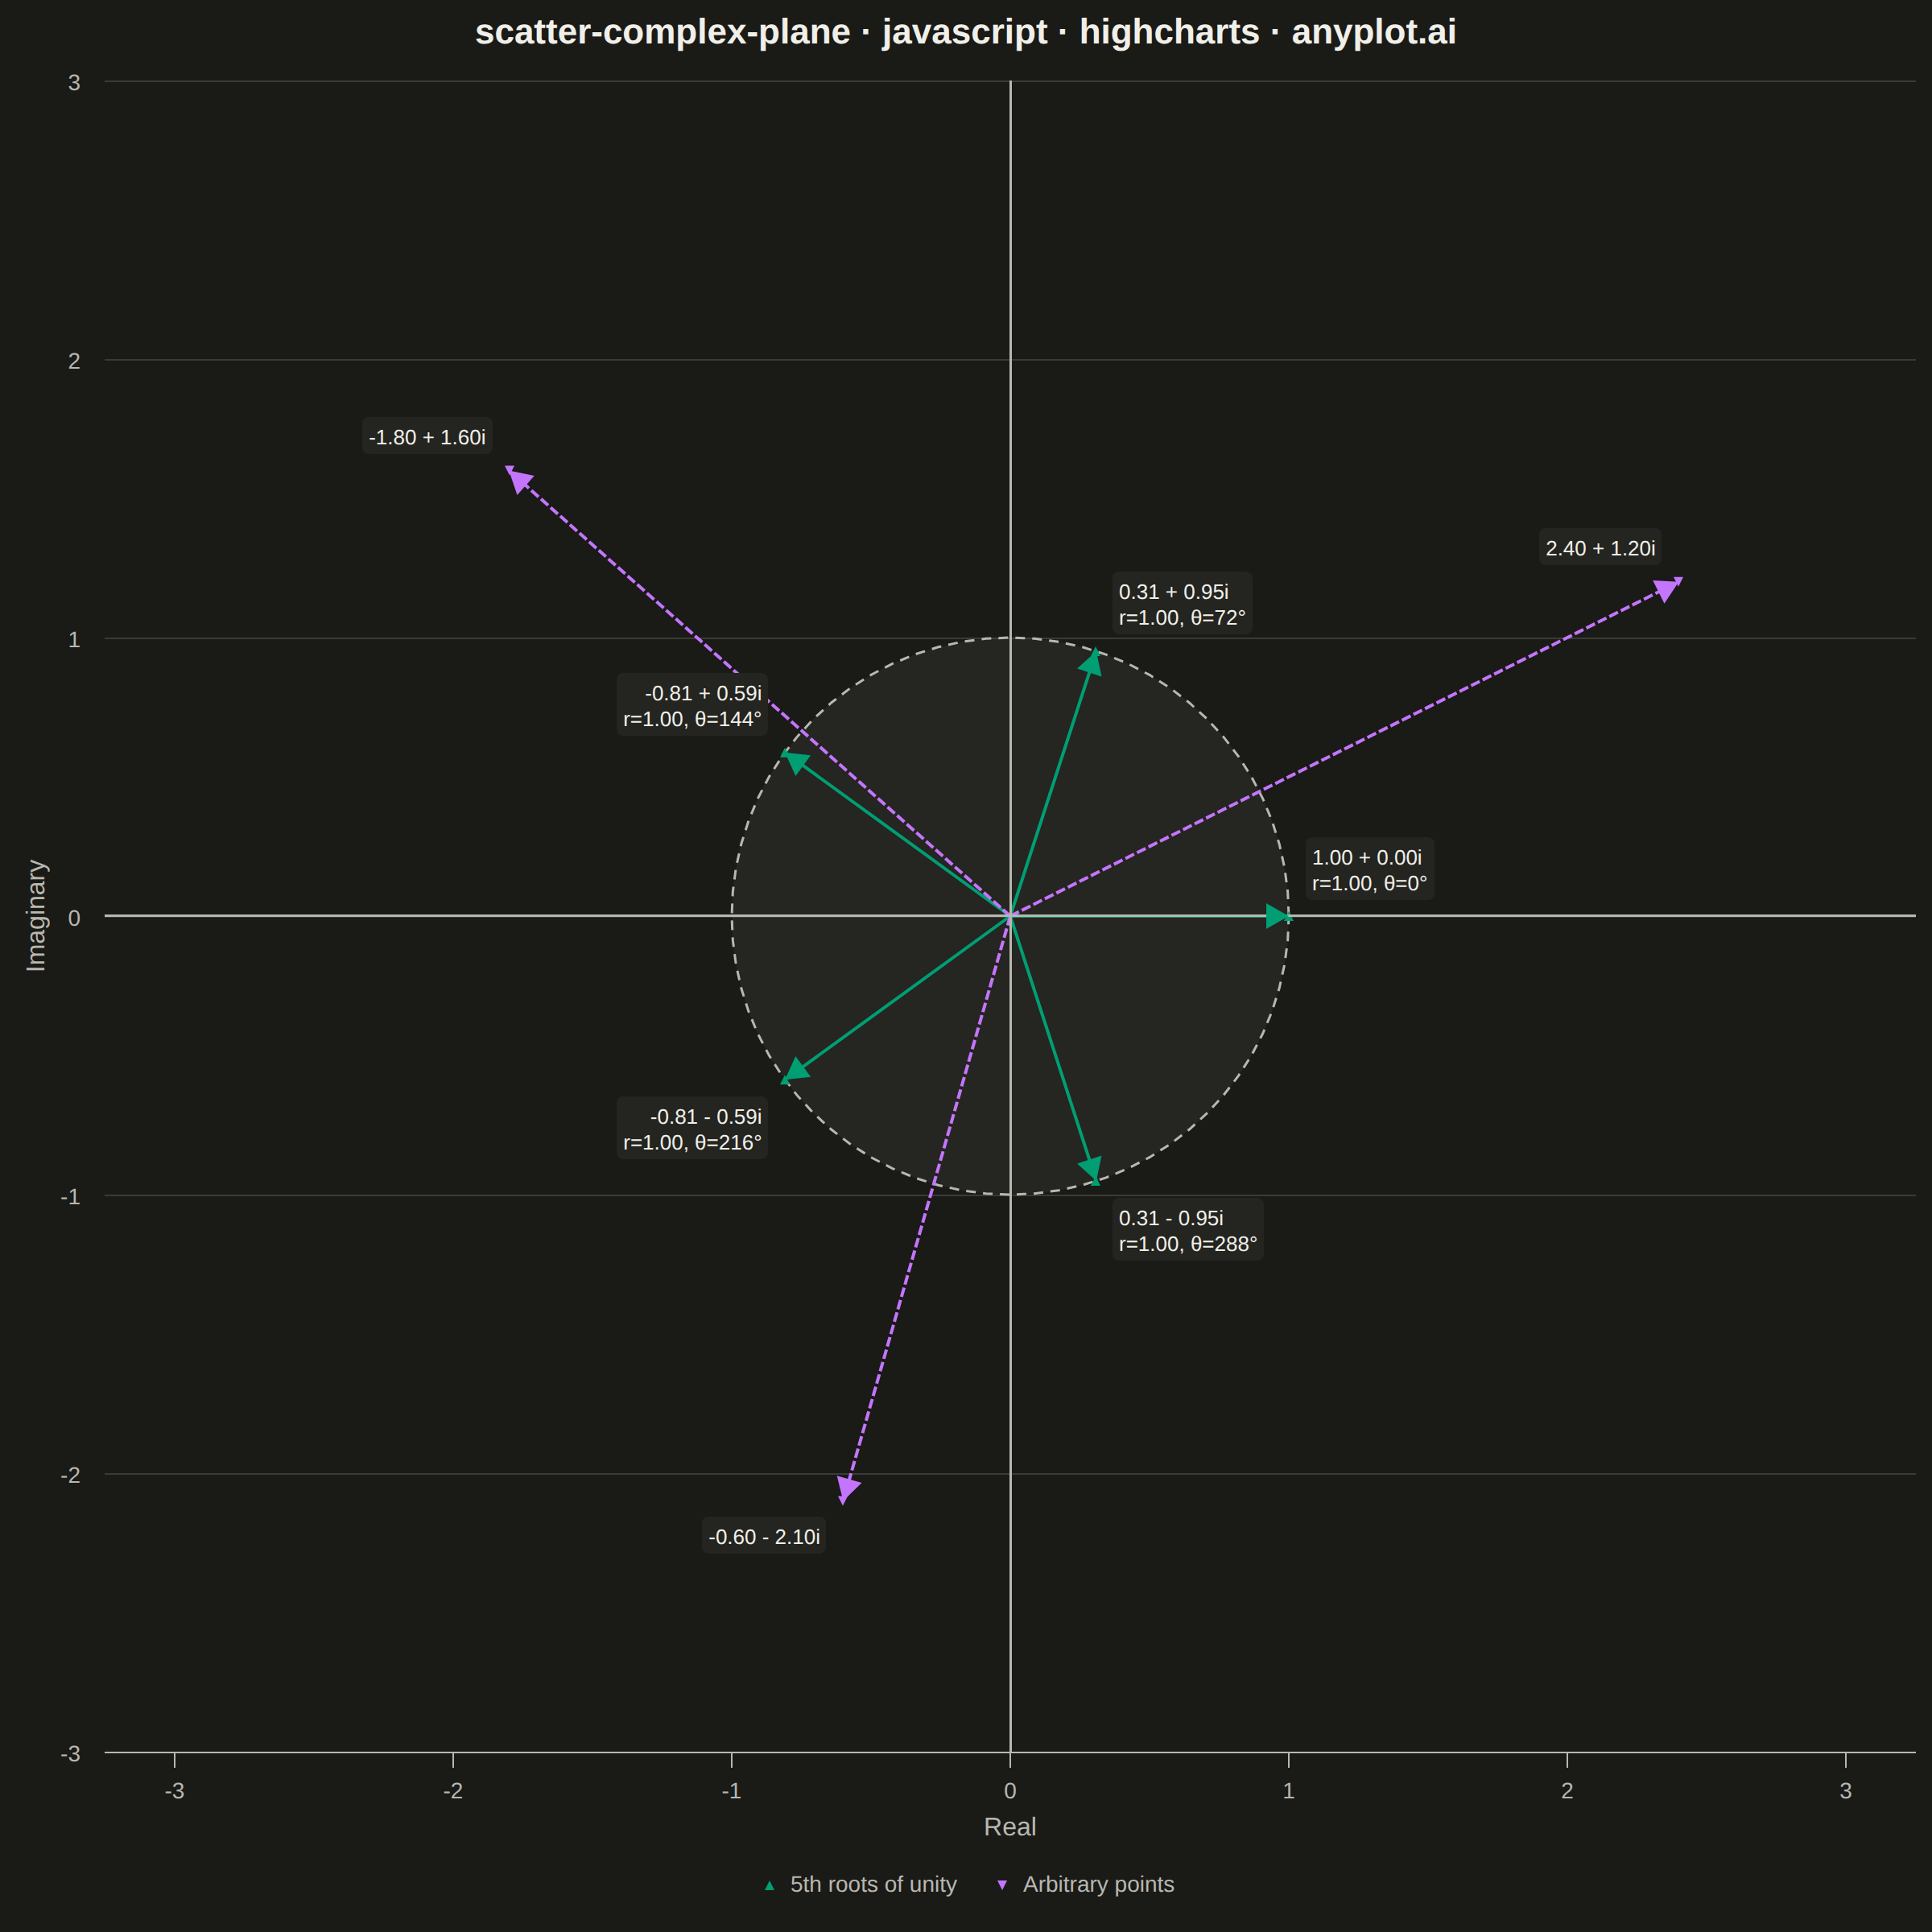
An Argand diagram plots complex numbers as points in the complex plane, with the real part on the x-axis and the imaginary part on the y-axis. Vectors from the origin to each point illustrate magnitude and phase angle, while a unit circle provides a geometric reference. This visualization is foundational for complex analysis, signal processing, and understanding operations like addition, multiplication, and roots of unity geometrically.
// anyplot.ai
// scatter-complex-plane: Complex Plane Visualization (Argand Diagram)
// Library: highcharts 12.6.0 | JavaScript 22.23.2
// Quality: 93/100 | Created: 2026-08-26
//# anyplot-orientation: square
// anyplot.ai
// scatter-complex-plane: Complex Plane Visualization (Argand Diagram)
// Library: Highcharts 12.6.0 | Node 22
// License: Highcharts — commercial license, free for non-commercial use (highcharts.com/license)
// Quality: pending | Created: 2026-08-26

const t = window.ANYPLOT_TOKENS;

// --- Data (in-memory, deterministic) ---------------------------------------

// 5th roots of unity: z_k = e^(2*pi*i*k/5), k = 0..4 — sit exactly on the unit circle
const ROOT_COUNT = 5;
const roots = [];
for (let k = 0; k < ROOT_COUNT; k++) {
  const angle = (2 * Math.PI * k) / ROOT_COUNT;
  roots.push({
    re: Math.cos(angle),
    im: Math.sin(angle),
    angleDeg: Math.round((360 * k) / ROOT_COUNT),
  });
}

// A few arbitrary complex numbers away from the unit circle
const arbitraryPoints = [
  { re: 2.4, im: 1.2 },
  { re: -1.8, im: 1.6 },
  { re: -0.6, im: -2.1 },
];

// Axis runs -3..3; flip the anchor inward once a point sits within
// EDGE_MARGIN of an edge so its label doesn't crowd the canvas border.
const AXIS_LIMIT = 3;
const EDGE_MARGIN = 0.7;

function pointLabelConfig(re, im, extraLine) {
  const rect = `${re.toFixed(2)} ${im >= 0 ? "+" : "-"} ${Math.abs(im).toFixed(2)}i`;
  const nearRight = re > AXIS_LIMIT - EDGE_MARGIN;
  const nearLeft = re < -AXIS_LIMIT + EDGE_MARGIN;
  const nearTop = im > AXIS_LIMIT - EDGE_MARGIN;
  const nearBottom = im < -AXIS_LIMIT + EDGE_MARGIN;
  const align = nearRight ? "right" : nearLeft ? "left" : re >= 0 ? "left" : "right";
  const verticalAlign = nearTop ? "top" : nearBottom ? "bottom" : im >= 0 ? "bottom" : "top";
  return {
    align,
    verticalAlign,
    x: align === "left" ? 10 : -10,
    y: verticalAlign === "bottom" ? -10 : 10,
    formatter: function () {
      return extraLine ? `${rect}<br/>${extraLine}` : rect;
    },
  };
}

const rootData = roots.map((p) => ({
  x: p.re,
  y: p.im,
  dataLabels: pointLabelConfig(p.re, p.im, `r=1.00, θ=${p.angleDeg}°`),
}));

const arbitraryData = arbitraryPoints.map((p) => ({
  x: p.re,
  y: p.im,
  dataLabels: pointLabelConfig(p.re, p.im),
}));

// Unit circle reference (dashed), sampled every 5 degrees
const circlePoints = [];
for (let deg = 0; deg <= 360; deg += 5) {
  const rad = (deg * Math.PI) / 180;
  circlePoints.push([Math.cos(rad), Math.sin(rad)]);
}

// Vector bodies from the origin to each point, one series per category with
// null gaps between segments so each point gets its own line
function vectorSegments(points) {
  const segments = [];
  points.forEach((p) => {
    segments.push([0, 0], [p.re, p.im], null);
  });
  return segments;
}

const rootVectors = vectorSegments(roots);
const arbitraryVectors = vectorSegments(arbitraryPoints);

// --- Custom SVG overlays ------------------------------------------------------
// Core Highcharts has no vector/arrow series and no way to fill a parametric
// closed curve, so both the unit-circle shading and the arrowhead triangles
// are drawn directly onto the SVG with the renderer once the axis pixel
// mapping (including the equal-aspect adjustment below) is final.
function drawCircleFill(chart, xAxis, yAxis, color) {
  const cx = xAxis.toPixels(0);
  const cy = yAxis.toPixels(0);
  const r = Math.abs(xAxis.toPixels(1) - cx);
  chart.renderer.circle(cx, cy, r).attr({ fill: color, opacity: 0.07, zIndex: 0 }).add();
}

function drawArrowhead(chart, xAxis, yAxis, re, im, color) {
  const x0 = xAxis.toPixels(0);
  const y0 = yAxis.toPixels(0);
  const x1 = xAxis.toPixels(re);
  const y1 = yAxis.toPixels(im);
  const dx = x1 - x0;
  const dy = y1 - y0;
  const len = Math.sqrt(dx * dx + dy * dy) || 1;
  const ux = dx / len;
  const uy = dy / len;
  const headLength = 14;
  const headWidth = 8;
  const baseX = x1 - ux * headLength;
  const baseY = y1 - uy * headLength;
  const px = -uy;
  const py = ux;
  chart.renderer
    .path([
      "M", x1, y1,
      "L", baseX + px * headWidth, baseY + py * headWidth,
      "L", baseX - px * headWidth, baseY - py * headWidth,
      "Z",
    ])
    .attr({ fill: color, zIndex: 6 })
    .add();
}

// --- Chart -------------------------------------------------------------------
Highcharts.chart("container", {
  chart: {
    type: "line",
    backgroundColor: "transparent",
    animation: false,
    style: { fontFamily: "inherit" },
    events: {
      load: function () {
        const chart = this;
        const xAxis = chart.xAxis[0];
        const yAxis = chart.yAxis[0];
        const xRange = xAxis.max - xAxis.min;
        const yRange = yAxis.max - yAxis.min;
        const xScale = chart.plotWidth / xRange;
        const yScale = chart.plotHeight / yRange;

        // Force equal units-per-pixel on both axes so the unit circle renders circular
        if (xScale > yScale) {
          const targetRange = chart.plotWidth / yScale;
          const mid = (xAxis.min + xAxis.max) / 2;
          xAxis.setExtremes(mid - targetRange / 2, mid + targetRange / 2, false);
        } else if (yScale > xScale) {
          const targetRange = chart.plotHeight / xScale;
          const mid = (yAxis.min + yAxis.max) / 2;
          yAxis.setExtremes(mid - targetRange / 2, mid + targetRange / 2, false);
        }
        chart.redraw();

        const finalXAxis = chart.xAxis[0];
        const finalYAxis = chart.yAxis[0];
        drawCircleFill(chart, finalXAxis, finalYAxis, t.inkSoft);
        roots.forEach((p) => drawArrowhead(chart, finalXAxis, finalYAxis, p.re, p.im, t.palette[0]));
        arbitraryPoints.forEach((p) => drawArrowhead(chart, finalXAxis, finalYAxis, p.re, p.im, t.palette[1]));
      },
    },
  },
  credits: { enabled: false },
  colors: t.palette,
  title: {
    text: "scatter-complex-plane · javascript · highcharts · anyplot.ai",
    style: { color: t.ink, fontSize: "22px", fontWeight: "600" },
  },
  xAxis: {
    title: { text: "Real", style: { color: t.inkSoft, fontSize: "16px" } },
    min: -3,
    max: 3,
    tickInterval: 1,
    lineColor: t.inkSoft,
    tickColor: t.inkSoft,
    gridLineColor: t.grid,
    plotLines: [{ value: 0, color: t.inkSoft, width: 1.5, zIndex: 4 }],
    labels: { style: { color: t.inkSoft, fontSize: "14px" } },
  },
  yAxis: {
    title: { text: "Imaginary", style: { color: t.inkSoft, fontSize: "16px" } },
    min: -3,
    max: 3,
    tickInterval: 1,
    gridLineColor: t.grid,
    plotLines: [{ value: 0, color: t.inkSoft, width: 1.5, zIndex: 4 }],
    labels: { style: { color: t.inkSoft, fontSize: "14px" } },
  },
  legend: {
    itemStyle: { color: t.inkSoft, fontSize: "14px" },
    itemHoverStyle: { color: t.ink },
  },
  tooltip: { enabled: false },
  plotOptions: {
    series: { animation: false },
    line: { enableMouseTracking: false, marker: { enabled: false } },
    scatter: {
      // Small — the arrowhead tip drawn by drawArrowhead() already marks the
      // point; this just keeps the point visible under the triangle.
      marker: { radius: 3, lineWidth: 0 },
      dataLabels: {
        enabled: true,
        useHTML: false,
        style: { color: t.ink, fontSize: "13px", fontWeight: "400", textOutline: "none" },
        backgroundColor: t.elevatedBg,
        borderRadius: 4,
        padding: 4,
      },
    },
  },
  series: [
    {
      type: "line",
      name: "Unit circle",
      data: circlePoints,
      color: t.inkSoft,
      dashStyle: "Dash",
      lineWidth: 1.5,
      showInLegend: false,
      zIndex: 1,
    },
    {
      type: "line",
      name: "Roots-of-unity vectors",
      data: rootVectors,
      color: t.palette[0],
      lineWidth: 2,
      showInLegend: false,
      zIndex: 2,
    },
    {
      type: "line",
      name: "Arbitrary-point vectors",
      data: arbitraryVectors,
      color: t.palette[1],
      lineWidth: 2,
      dashStyle: "ShortDash",
      showInLegend: false,
      zIndex: 2,
    },
    {
      type: "scatter",
      name: "5th roots of unity",
      data: rootData,
      color: t.palette[0],
      zIndex: 3,
    },
    {
      type: "scatter",
      name: "Arbitrary points",
      data: arbitraryData,
      color: t.palette[1],
      zIndex: 3,
    },
  ],
});
Runnable source as JSON, for any HTTP client: https://api.anyplot.ai/specs/scatter-complex-plane/highcharts/code. Any spec id and library id listed in llms-full.txt fit the same URL shape; every URL below is complete and callable.
{
  "spec_id": "scatter-complex-plane",
  "language": "javascript",
  "library": "highcharts",
  "page": "https://anyplot.ai/scatter-complex-plane/javascript/highcharts",
  "hub": "https://anyplot.ai/scatter-complex-plane",
  "code_json": "https://api.anyplot.ai/specs/scatter-complex-plane/highcharts/code",
  "spec_json": "https://api.anyplot.ai/specs/scatter-complex-plane",
  "render_light_png": "https://storage.googleapis.com/anyplot-images/plots/scatter-complex-plane/javascript/highcharts/plot-light.png",
  "render_dark_png": "https://storage.googleapis.com/anyplot-images/plots/scatter-complex-plane/javascript/highcharts/plot-dark.png",
  "interactive_light_html": "https://storage.googleapis.com/anyplot-images/plots/scatter-complex-plane/javascript/highcharts/plot-light.html",
  "interactive_dark_html": "https://storage.googleapis.com/anyplot-images/plots/scatter-complex-plane/javascript/highcharts/plot-dark.html",
  "quality_score": 93.0,
  "license": "MIT",
  "guide": "https://anyplot.ai/llms.txt"
}
Part of Complex Plane Visualization (Argand Diagram) on anyplot.ai.