The same plot in 14 other libraries — JavaScript: Chart.js, D3.js, Apache ECharts, Highcharts; Python: Altair, Bokeh, lets-plot, Matplotlib, Plotly, plotnine, Pygal, Seaborn; R: ggplot2; Julia: Makie.jl. Compare all 15 side by side: Complex Plane Visualization (Argand Diagram) in Python, R, Julia and JavaScript.
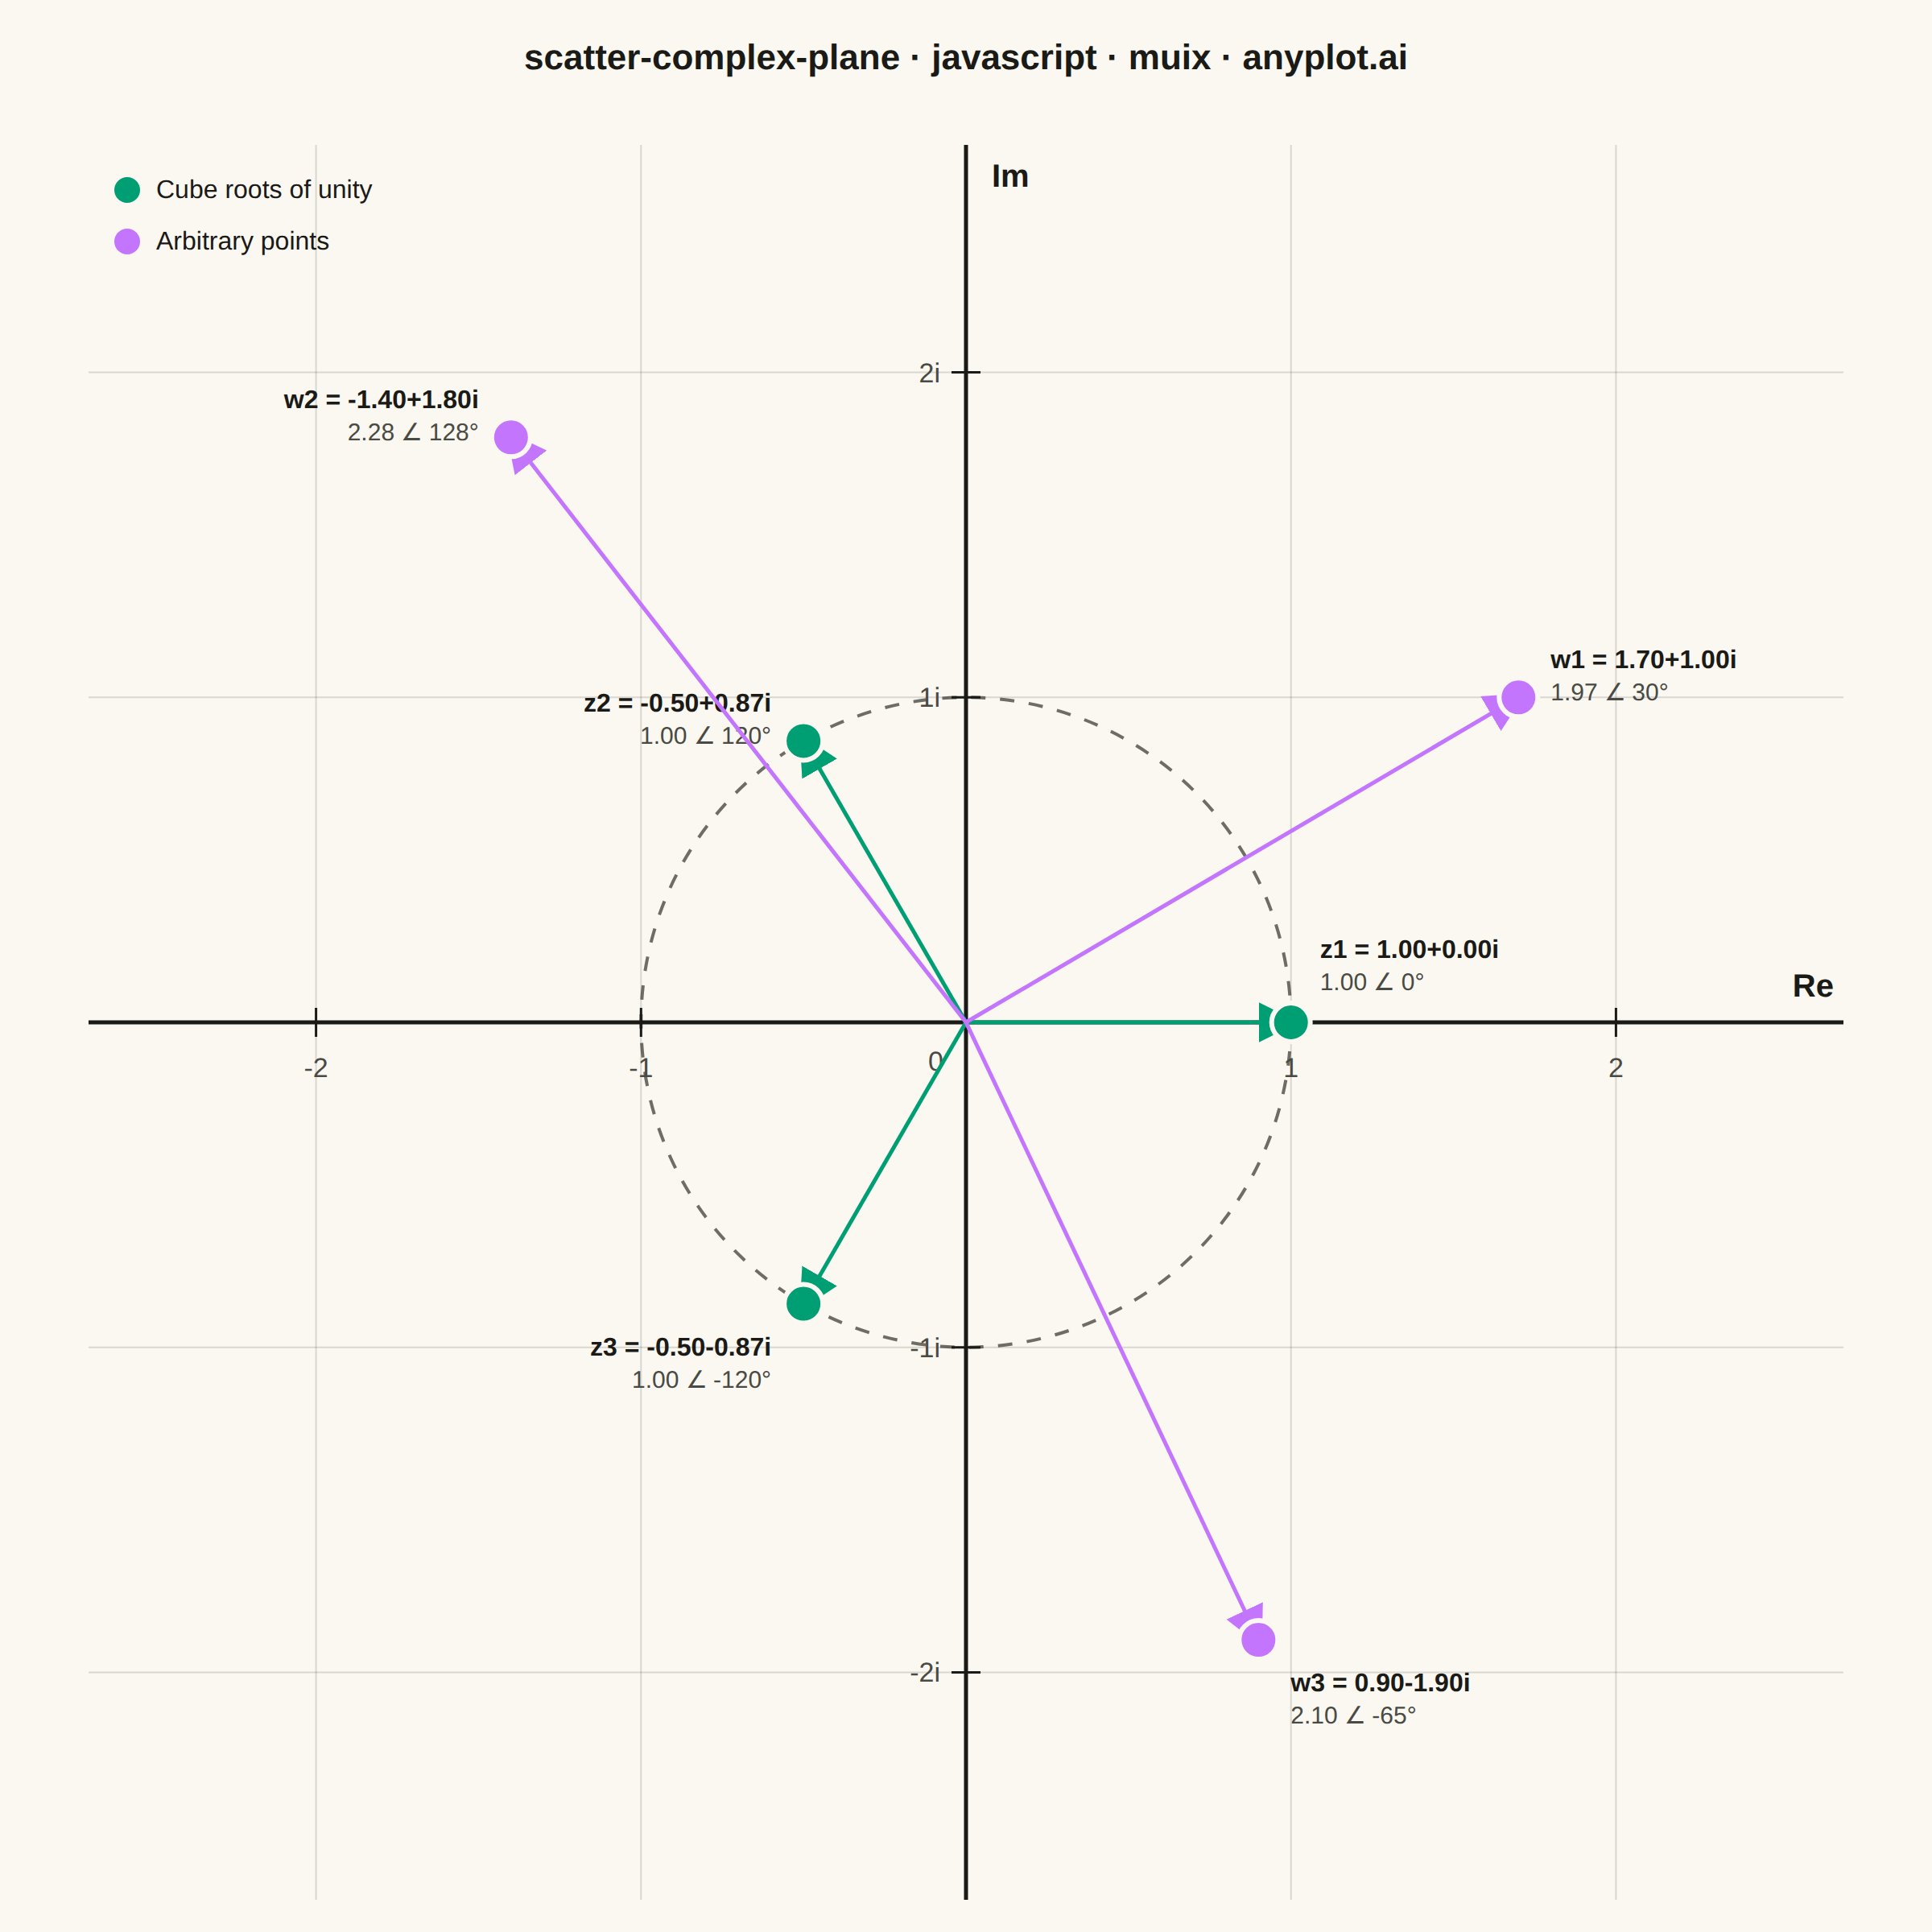
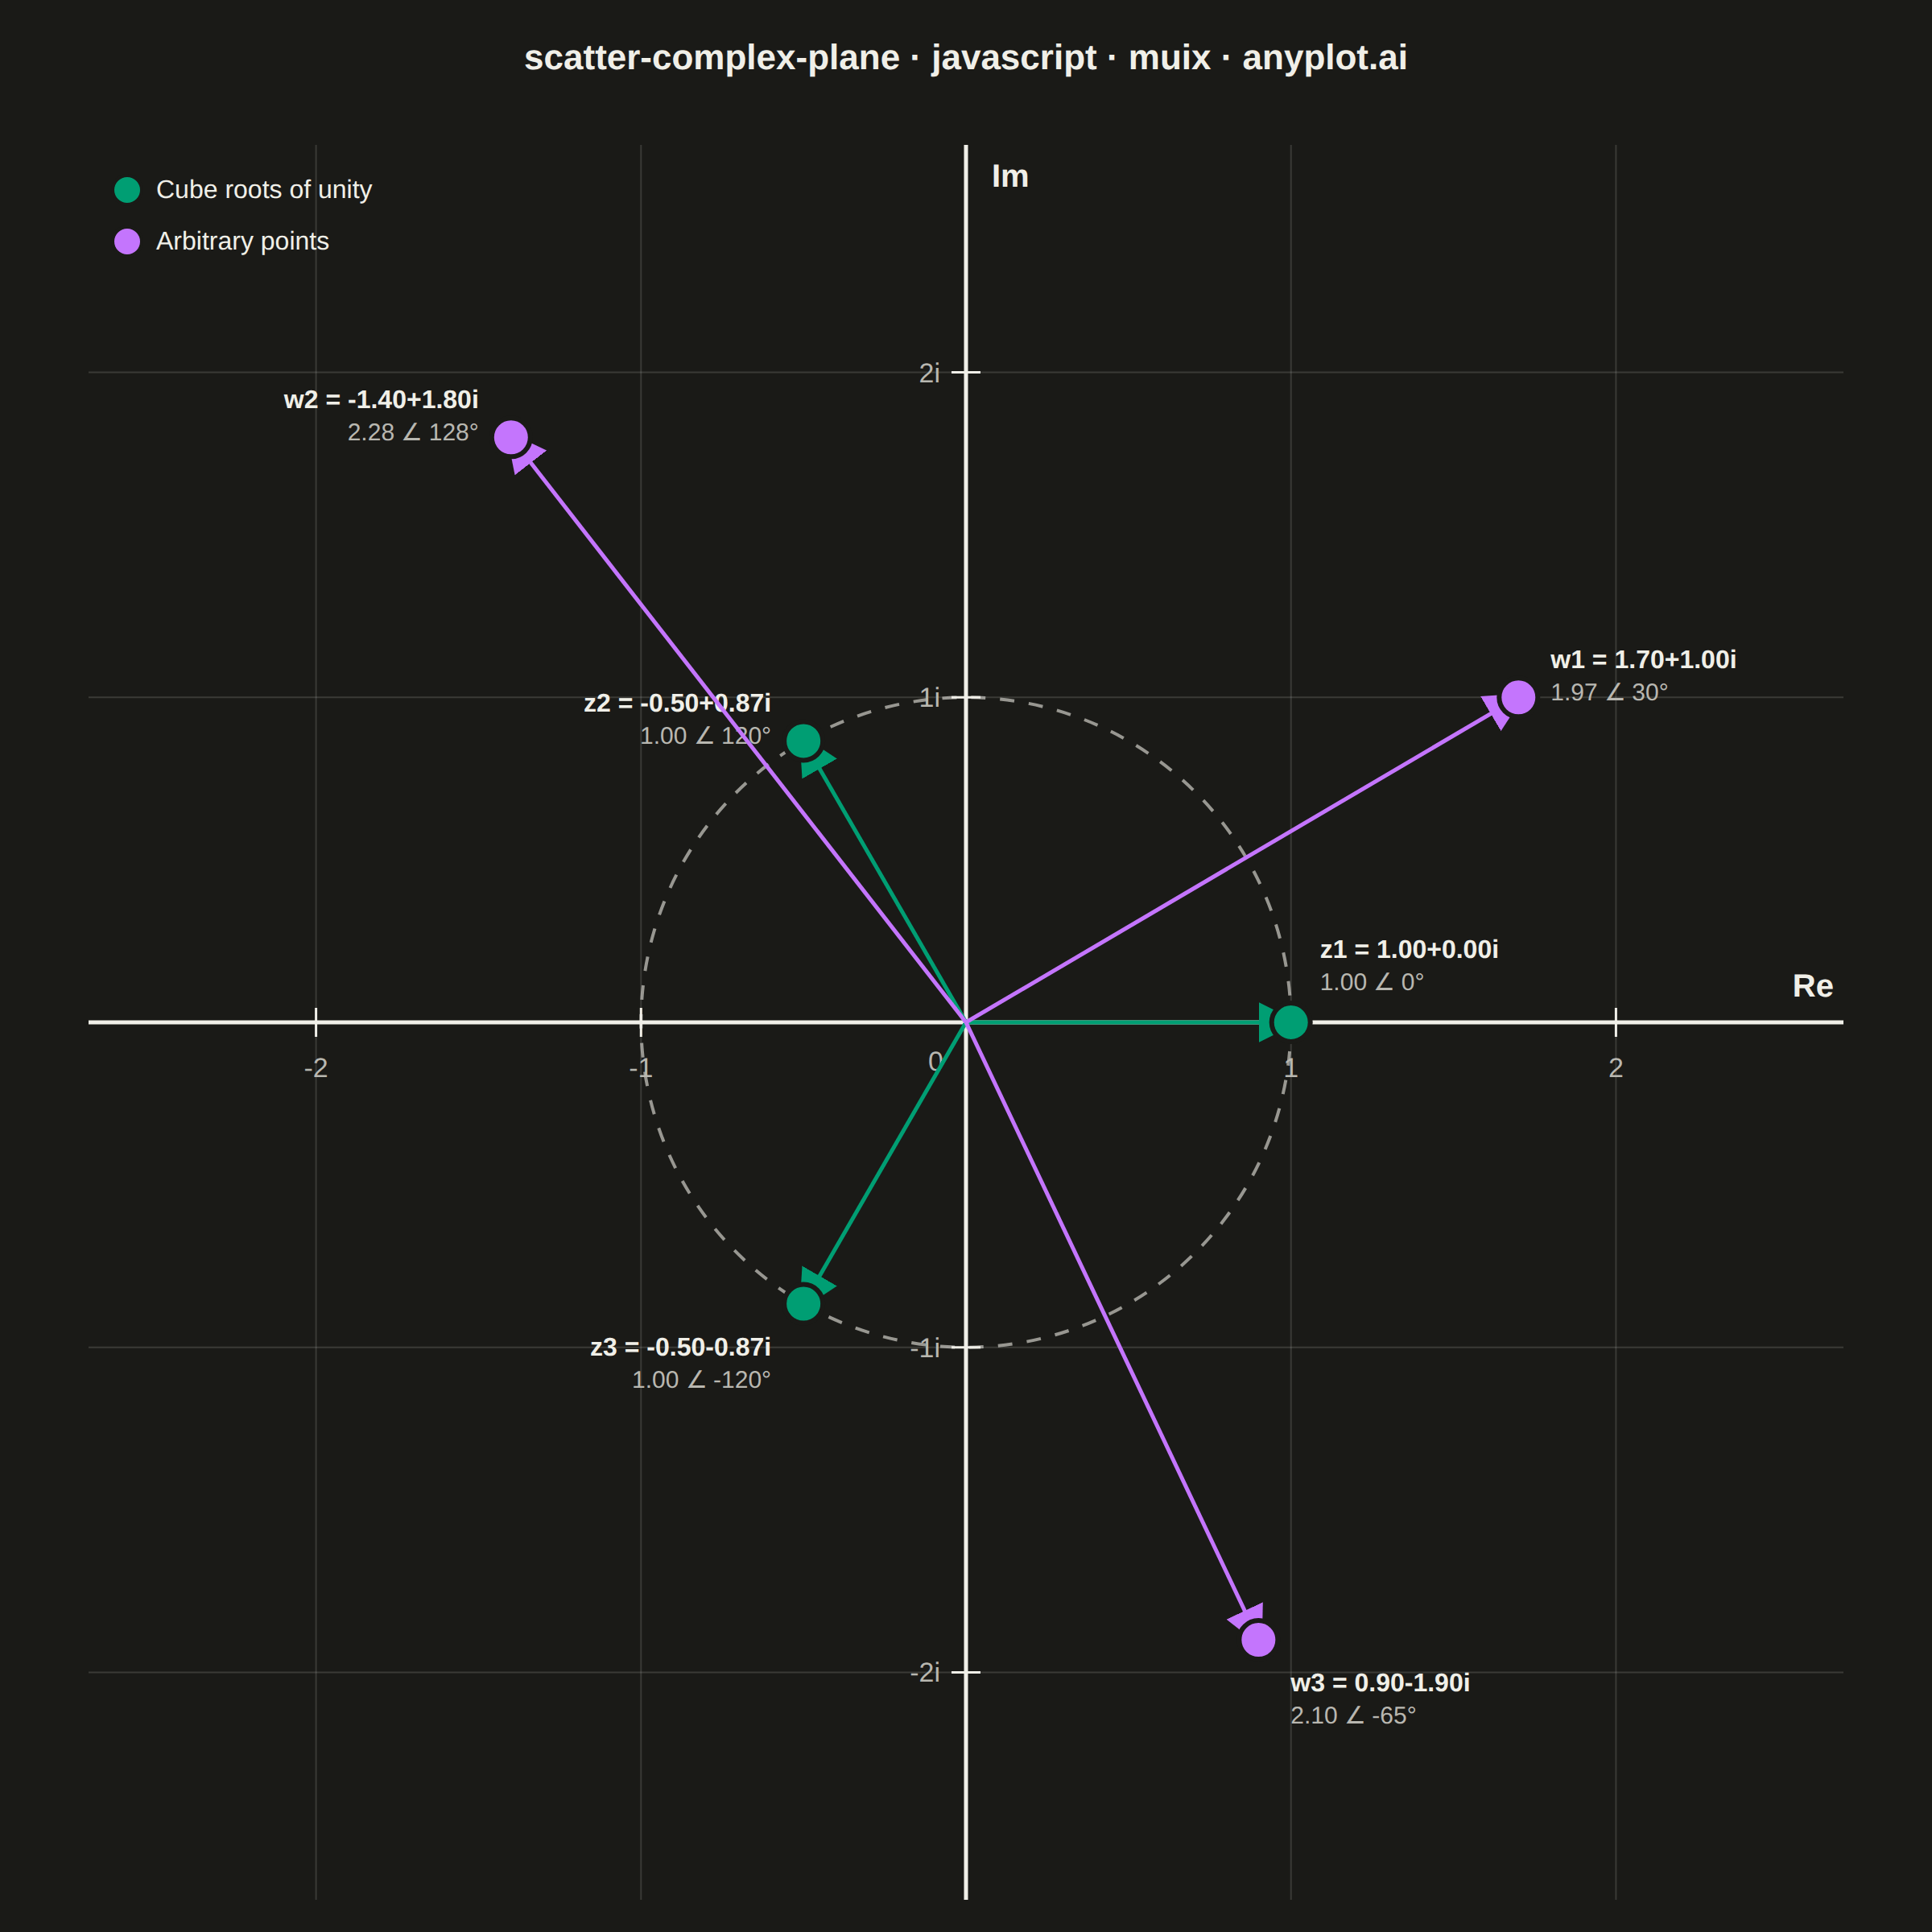
An Argand diagram plots complex numbers as points in the complex plane, with the real part on the x-axis and the imaginary part on the y-axis. Vectors from the origin to each point illustrate magnitude and phase angle, while a unit circle provides a geometric reference. This visualization is foundational for complex analysis, signal processing, and understanding operations like addition, multiplication, and roots of unity geometrically.
// anyplot.ai
// scatter-complex-plane: Complex Plane Visualization (Argand Diagram)
// Library: muix 7.29.1 | JavaScript 22.23.2
// Quality: 88/100 | Created: 2026-08-26
//# anyplot-orientation: square
// anyplot.ai
// scatter-complex-plane: Complex Plane Visualization (Argand Diagram)
// Library: MUI X Charts | React | Node 22
// License: @mui/x-charts — MIT (community). Pro/Premium are out of scope.
// Quality: pending | Created: 2026-08-26
import { ChartContainer } from "@mui/x-charts/ChartContainer";
import { useXScale, useYScale } from "@mui/x-charts/hooks";
import Box from "@mui/material/Box";
import Typography from "@mui/material/Typography";

const t = window.ANYPLOT_TOKENS;

// --- Data (in-memory, deterministic) ----------------------------------------
// The cube roots of unity — the three solutions to z^3 = 1 — sit evenly
// spaced on the unit circle, alongside a few arbitrary complex numbers for
// contrast (Applications: "roots of polynomials", "nth roots of unity").
const ROOTS_OF_UNITY = [
  { name: "z1", re: 1, im: 0 },
  { name: "z2", re: -0.5, im: Math.sqrt(3) / 2 },
  { name: "z3", re: -0.5, im: -Math.sqrt(3) / 2 },
];

const ARBITRARY_POINTS = [
  { name: "w1", re: 1.7, im: 1.0 },
  { name: "w2", re: -1.4, im: 1.8 },
  { name: "w3", re: 0.9, im: -1.9 },
];

const CATEGORIES = [
  { key: "roots", label: "Cube roots of unity", color: t.palette[0], points: ROOTS_OF_UNITY },
  { key: "arbitrary", label: "Arbitrary points", color: t.palette[1], points: ARBITRARY_POINTS },
];

// Rectangular ("a+bi") and polar ("r ∠ θ°") annotation text for a point.
function rectForm(re, im) {
  const sign = im < 0 ? "-" : "+";
  return `${re.toFixed(2)}${sign}${Math.abs(im).toFixed(2)}i`;
}
function polarForm(re, im) {
  const r = Math.hypot(re, im);
  const theta = (Math.atan2(im, re) * 180) / Math.PI;
  return `${r.toFixed(2)} ∠ ${theta.toFixed(0)}°`;
}

// Hand-tuned per-point label offsets (px) so the two annotation lines clear
// the vector arrows, the origin axes, and each other. `dy` places the first
// (rectangular-form) line; the second (polar-form) line always sits 20px
// below it.
const LABEL_LAYOUT = {
  z1: { dx: 18, dy: -40, anchor: "start" }, // sits on the real axis — push well above it
  z2: { dx: -20, dy: -18, anchor: "end" },
  z3: { dx: -20, dy: 32, anchor: "end" },
  w1: { dx: 20, dy: -18, anchor: "start" },
  w2: { dx: -20, dy: -18, anchor: "end" },
  w3: { dx: 20, dy: 32, anchor: "start" },
};

const DOMAIN = 2.7;
const TICKS = [-2, -1, 1, 2];

// --- Argand diagram — axes, unit circle, vectors, markers, and annotations,
// all composed on the ChartContainer's cartesian scales (community
// @mui/x-charts surface only, no Pro/Premium). -------------------------------
function ArgandDiagram() {
  const xScale = useXScale();
  const yScale = useYScale();
  const zeroX = xScale(0);
  const zeroY = yScale(0);
  const unitRadius = Math.abs(xScale(1) - xScale(0));
  const axisStart = xScale(-DOMAIN);
  const axisEnd = xScale(DOMAIN);
  const axisTop = yScale(DOMAIN);
  const axisBottom = yScale(-DOMAIN);

  return (
    <g>
      <defs>
        {CATEGORIES.map((cat) => (
          <marker key={cat.key} id={`arrowhead-${cat.key}`} markerWidth={10} markerHeight={10} refX={8} refY={5} orient="auto">
            <path d="M0,0 L10,5 L0,10 Z" fill={cat.color} />
          </marker>
        ))}
      </defs>

      {/* Subtle unit-spaced reference grid */}
      {TICKS.map((v) => (
        <line key={`grid-v-${v}`} x1={xScale(v)} y1={axisTop} x2={xScale(v)} y2={axisBottom} stroke={t.grid} strokeWidth={1} />
      ))}
      {TICKS.map((v) => (
        <line key={`grid-h-${v}`} x1={axisStart} y1={yScale(v)} x2={axisEnd} y2={yScale(v)} stroke={t.grid} strokeWidth={1} />
      ))}

      {/* Unit circle — dashed geometric reference for magnitude 1 */}
      <circle cx={zeroX} cy={zeroY} r={unitRadius} fill="none" stroke={t.inkSoft} strokeWidth={2} strokeDasharray="9 9" opacity={0.8} />

      {/* Real + imaginary axes drawn through the origin */}
      <line x1={axisStart} y1={zeroY} x2={axisEnd} y2={zeroY} stroke={t.ink} strokeWidth={2.5} />
      <line x1={zeroX} y1={axisTop} x2={zeroX} y2={axisBottom} stroke={t.ink} strokeWidth={2.5} />
      <text x={axisEnd - 6} y={zeroY - 16} fontSize={20} fontWeight={600} fill={t.ink} textAnchor="end">
        Re
      </text>
      <text x={zeroX + 16} y={axisTop + 26} fontSize={20} fontWeight={600} fill={t.ink} textAnchor="start">
        Im
      </text>

      {/* Tick marks + labels along both axes */}
      {TICKS.map((v) => (
        <g key={`tick-re-${v}`}>
          <line x1={xScale(v)} y1={zeroY - 9} x2={xScale(v)} y2={zeroY + 9} stroke={t.ink} strokeWidth={1.5} />
          <text x={xScale(v)} y={zeroY + 34} fontSize={17} fill={t.inkSoft} textAnchor="middle">
            {v}
          </text>
        </g>
      ))}
      {TICKS.map((v) => (
        <g key={`tick-im-${v}`}>
          <line x1={zeroX - 9} y1={yScale(v)} x2={zeroX + 9} y2={yScale(v)} stroke={t.ink} strokeWidth={1.5} />
          <text x={zeroX - 16} y={yScale(v) + 6} fontSize={17} fill={t.inkSoft} textAnchor="end">
            {`${v}i`}
          </text>
        </g>
      ))}
      <text x={zeroX - 14} y={zeroY + 30} fontSize={17} fill={t.inkSoft} textAnchor="end">
        0
      </text>

      {/* Vectors from the origin, point markers, and rectangular/polar labels */}
      {CATEGORIES.map((cat) =>
        cat.points.map((p) => {
          const px = xScale(p.re);
          const py = yScale(p.im);
          const layout = LABEL_LAYOUT[p.name];
          return (
            <g key={p.name}>
              <line x1={zeroX} y1={zeroY} x2={px} y2={py} stroke={cat.color} strokeWidth={2.5} markerEnd={`url(#arrowhead-${cat.key})`} />
              <circle cx={px} cy={py} r={12} fill={cat.color} stroke={t.pageBg} strokeWidth={3} />
              <text x={px + layout.dx} y={py + layout.dy} fontSize={16} fontWeight={600} fill={t.ink} textAnchor={layout.anchor}>
                {`${p.name} = ${rectForm(p.re, p.im)}`}
              </text>
              <text x={px + layout.dx} y={py + layout.dy + 20} fontSize={15} fill={t.inkSoft} textAnchor={layout.anchor}>
                {polarForm(p.re, p.im)}
              </text>
            </g>
          );
        })
      )}

      {/* Category legend */}
      {CATEGORIES.map((cat, i) => {
        const legendX = axisStart + 24;
        const legendY = axisTop + 28 + i * 32;
        return (
          <g key={`legend-${cat.key}`}>
            <circle cx={legendX} cy={legendY} r={9} fill={cat.color} stroke={t.pageBg} strokeWidth={2} />
            <text x={legendX + 18} y={legendY + 5} fontSize={16} fill={t.ink} textAnchor="start">
              {cat.label}
            </text>
          </g>
        );
      })}
    </g>
  );
}

// --- Chart (default-exported component — the harness mounts it) -------------
export default function Chart() {
  const size = window.ANYPLOT_SIZE;
  const titleHeight = 70;
  const chartSize = Math.min(size.width, size.height - titleHeight);

  return (
    <Box sx={{ width: size.width, height: size.height, display: "flex", flexDirection: "column", alignItems: "center", justifyContent: "center" }}>
      <Box sx={{ height: titleHeight, display: "flex", alignItems: "center" }}>
        <Typography sx={{ fontSize: 22, fontWeight: 600, color: t.ink }}>scatter-complex-plane · javascript · muix · anyplot.ai</Typography>
      </Box>
      <ChartContainer
        width={chartSize}
        height={chartSize}
        series={[]}
        xAxis={[{ min: -DOMAIN, max: DOMAIN, scaleType: "linear", domainLimit: "strict" }]}
        yAxis={[{ min: -DOMAIN, max: DOMAIN, scaleType: "linear", domainLimit: "strict" }]}
        margin={{ top: 20, bottom: 20, left: 20, right: 20 }}
        skipAnimation
      >
        <ArgandDiagram />
      </ChartContainer>
    </Box>
  );
}
Runnable source as JSON, for any HTTP client: https://api.anyplot.ai/specs/scatter-complex-plane/muix/code. Any spec id and library id listed in llms-full.txt fit the same URL shape; every URL below is complete and callable.
{
  "spec_id": "scatter-complex-plane",
  "language": "javascript",
  "library": "muix",
  "page": "https://anyplot.ai/scatter-complex-plane/javascript/muix",
  "hub": "https://anyplot.ai/scatter-complex-plane",
  "code_json": "https://api.anyplot.ai/specs/scatter-complex-plane/muix/code",
  "spec_json": "https://api.anyplot.ai/specs/scatter-complex-plane",
  "render_light_png": "https://storage.googleapis.com/anyplot-images/plots/scatter-complex-plane/javascript/muix/plot-light.png",
  "render_dark_png": "https://storage.googleapis.com/anyplot-images/plots/scatter-complex-plane/javascript/muix/plot-dark.png",
  "interactive_light_html": "https://storage.googleapis.com/anyplot-images/plots/scatter-complex-plane/javascript/muix/plot-light.html",
  "interactive_dark_html": "https://storage.googleapis.com/anyplot-images/plots/scatter-complex-plane/javascript/muix/plot-dark.html",
  "quality_score": 88.0,
  "license": "MIT",
  "guide": "https://anyplot.ai/llms.txt"
}
Part of Complex Plane Visualization (Argand Diagram) on anyplot.ai.