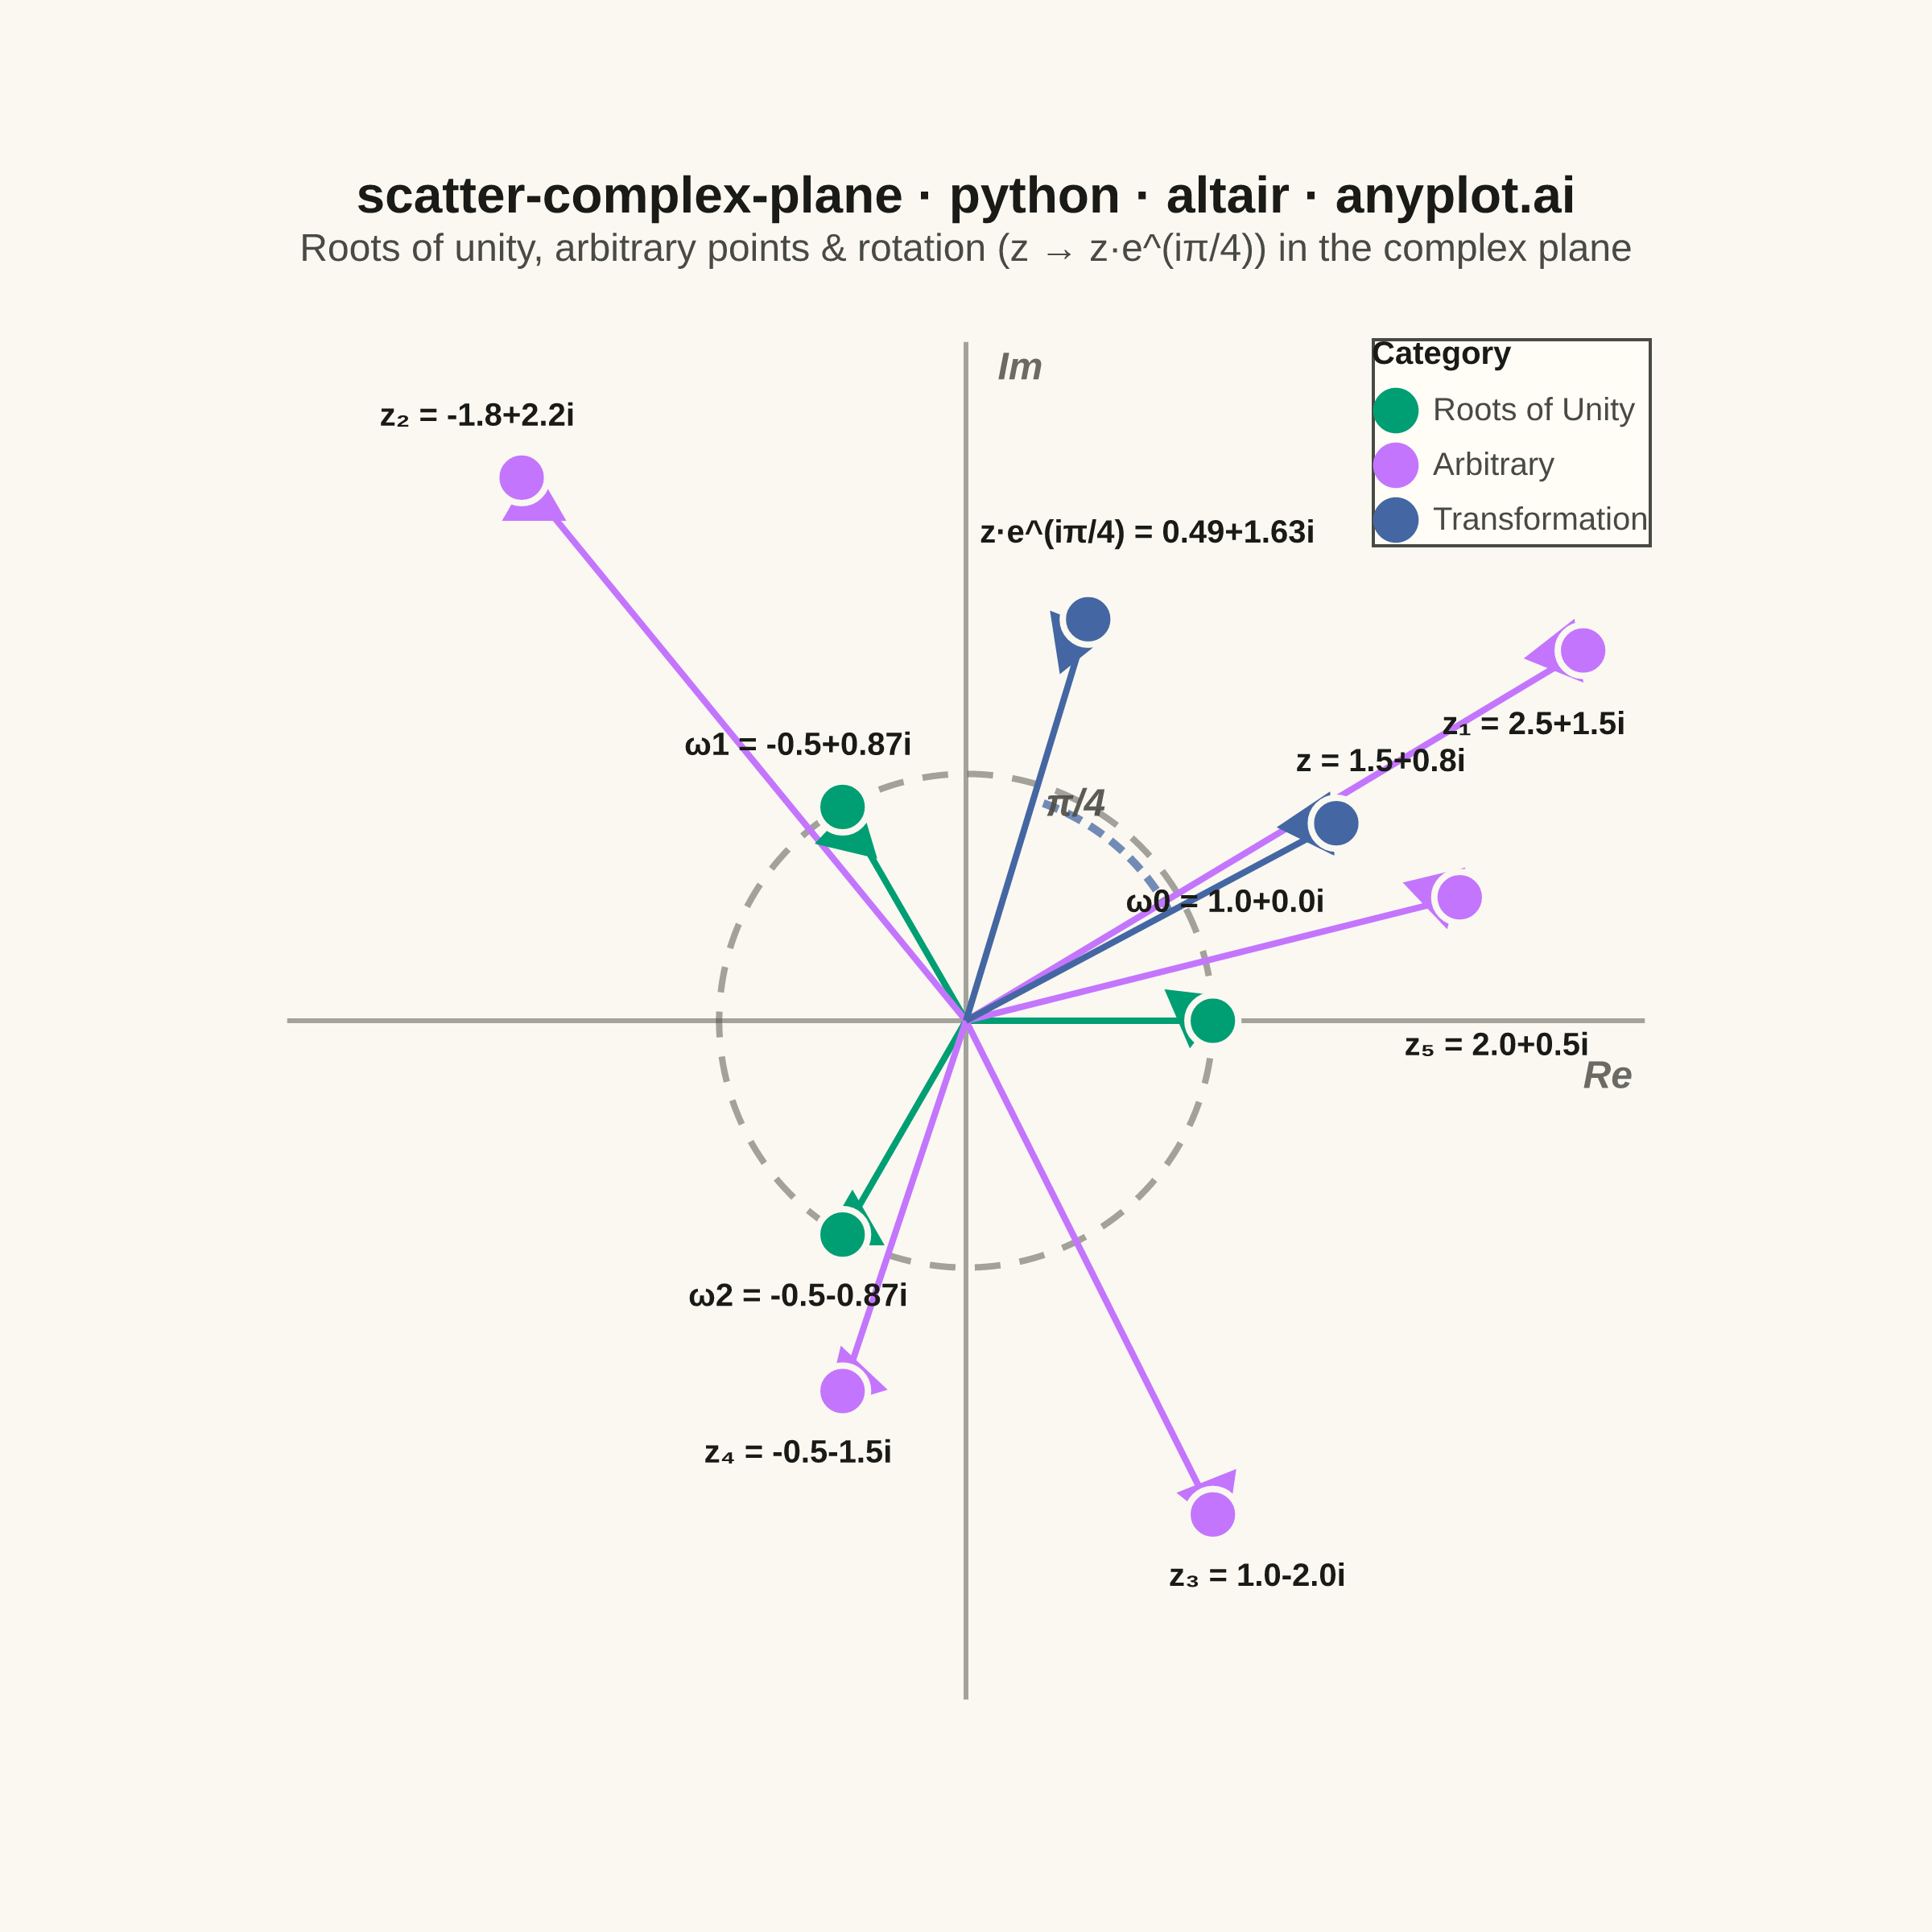
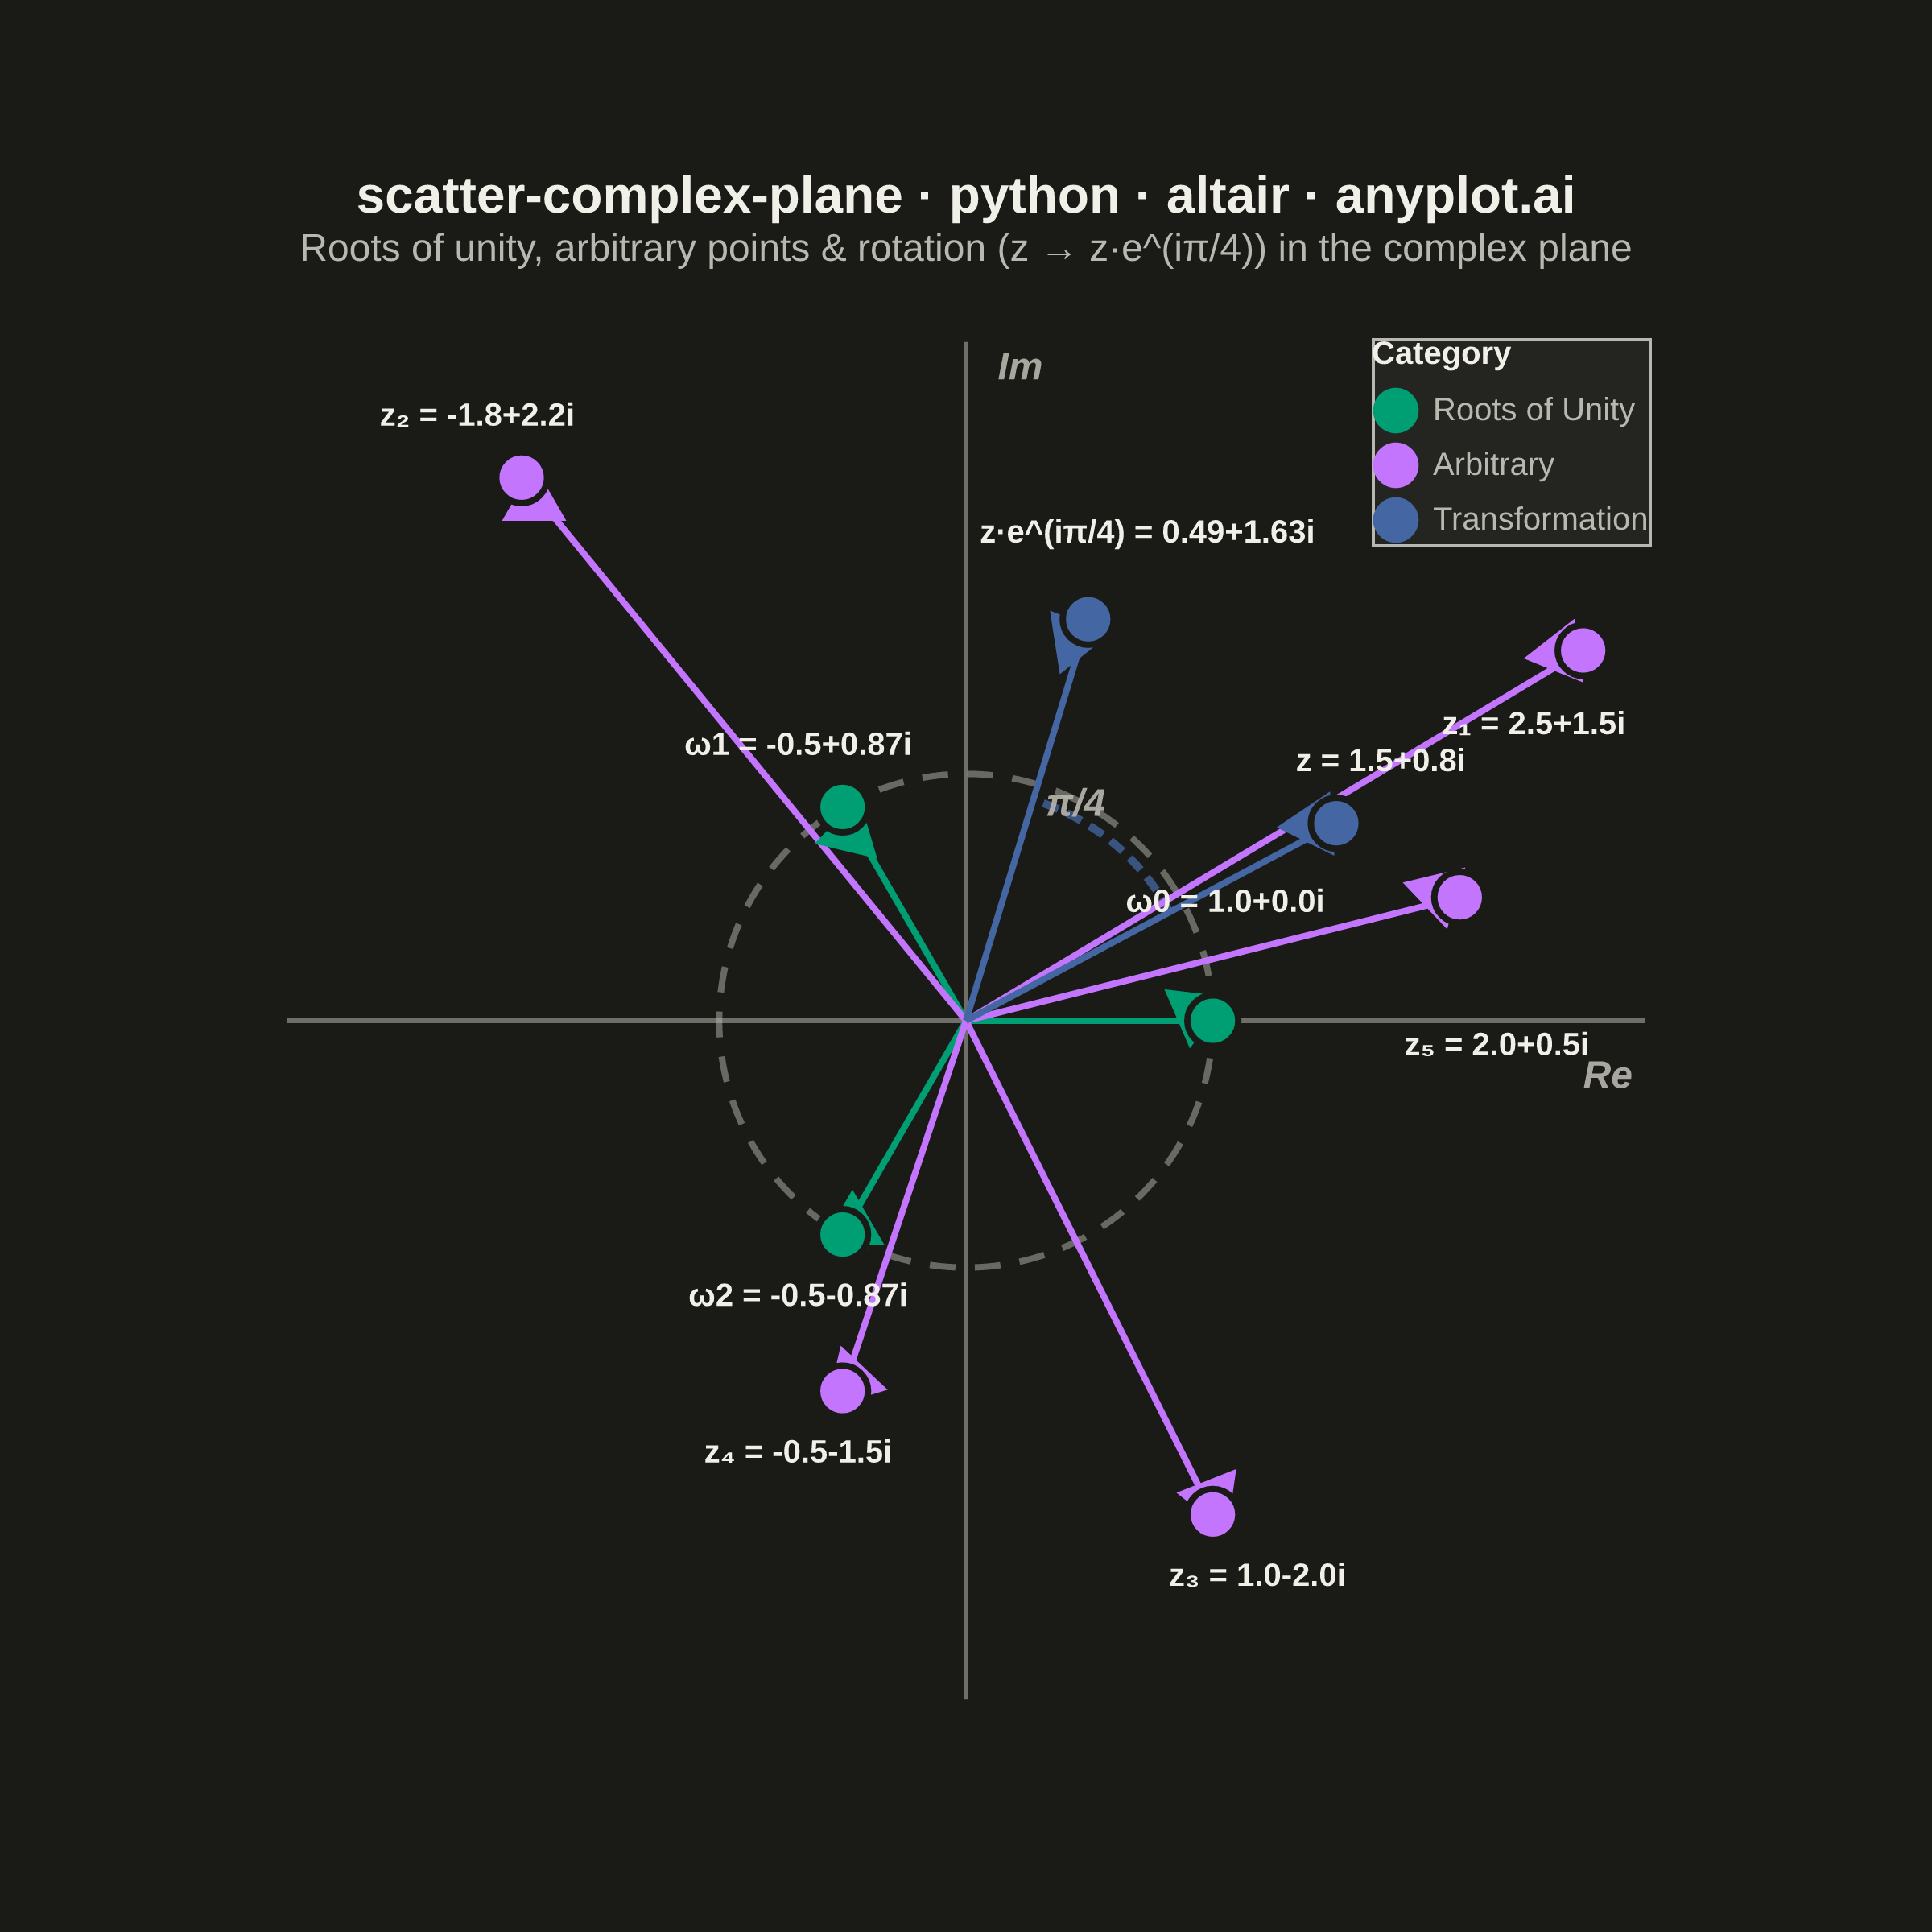
An Argand diagram plots complex numbers as points in the complex plane, with the real part on the x-axis and the imaginary part on the y-axis. Vectors from the origin to each point illustrate magnitude and phase angle, while a unit circle provides a geometric reference. This visualization is foundational for complex analysis, signal processing, and understanding operations like addition, multiplication, and roots of unity geometrically.
""" anyplot.ai
scatter-complex-plane: Complex Plane Visualization (Argand Diagram)
Library: altair 6.1.0 | Python 3.13.13
Quality: 88/100 | Updated: 2026-06-02
"""

import importlib
import os
import sys

import numpy as np
import pandas as pd
from PIL import Image


# Drop script directory from sys.path so `altair` resolves the package, not this file
sys.path[:] = [p for p in sys.path if os.path.abspath(p or ".") != os.path.dirname(os.path.abspath(__file__))]
alt = importlib.import_module("altair")

# Theme tokens (Imprint palette — theme-adaptive chrome)
THEME = os.getenv("ANYPLOT_THEME", "light")
PAGE_BG = "#FAF8F1" if THEME == "light" else "#1A1A17"
ELEVATED_BG = "#FFFDF6" if THEME == "light" else "#242420"
INK = "#1A1A17" if THEME == "light" else "#F0EFE8"
INK_SOFT = "#4A4A44" if THEME == "light" else "#B8B7B0"
INK_MUTED = "#6B6A63" if THEME == "light" else "#A8A79F"

# Imprint categorical palette — canonical order, theme-independent
IMPRINT_PALETTE = ["#009E73", "#C475FD", "#4467A3", "#BD8233", "#AE3030", "#2ABCCD", "#954477", "#99B314"]

# Data
np.random.seed(42)

# 3rd roots of unity: e^(2πik/3) for k = 0, 1, 2
n_roots = 3
roots_of_unity = [np.exp(2j * np.pi * k / n_roots) for k in range(n_roots)]

# Arbitrary complex numbers across all four quadrants
arbitrary_points = [2.5 + 1.5j, -1.8 + 2.2j, 1.0 - 2.0j, -0.5 - 1.5j, 2.0 + 0.5j]

# Complex rotation: multiply z by e^(iπ/4) — rotation by π/4 radians
z_original = 1.5 + 0.8j
z_rotated = z_original * np.exp(1j * np.pi / 4)

# Build all points with rectangular form labels
all_points = []
point_sets = [
    (roots_of_unity, [f"ω{k}" for k in range(n_roots)], "Roots of Unity"),
    (arbitrary_points, [f"z{chr(0x2081 + k)}" for k in range(5)], "Arbitrary"),
    ([z_original, z_rotated], ["z", "z·e^(iπ/4)"], "Transformation"),
]
for pts, labels, cat in point_sets:
    for lbl, z in zip(labels, pts, strict=True):
        r, i = round(z.real, 2), round(z.imag, 2)
        sign = "+" if i >= 0 else ""
        all_points.append(
            {"real": z.real, "imaginary": z.imag, "label": lbl, "rect_form": f"{r}{sign}{i}i", "category": cat}
        )

df = pd.DataFrame(all_points)
df["annotation"] = df["label"] + " = " + df["rect_form"]

# Label offsets: push labels away from origin by quadrant
# with per-point tuning to separate Q1 cluster (ω0, z, z₅)
offsets = {"dx": [], "dy": [], "align": []}
for _, row in df.iterrows():
    rx, iy = row["real"], row["imaginary"]
    dx = 0.18 if rx >= 0 else -0.18
    dy = 0.25 if iy >= 0 else -0.25
    align = "left" if rx >= 0 else "right"
    # ω0 = (1, 0) lies ON the x-axis — push label well above it to avoid the axis line
    if row["label"] == "ω0":
        dx = 0.05
        dy = 0.48
        align = "center"
    # z₁ (2.5+1.5i) is near the top-right legend — place below-left, right-aligned, to avoid both
    if row["label"] == "z₁":
        dx = -0.20
        dy = -0.30
        align = "right"
    # z₅ (2.0+0.5i) sits close to z (1.5+0.8i) in Q1 — push below x-axis entirely
    if row["label"] == "z₅":
        dx = 0.15
        dy = -0.60
        align = "left"
    # z·e^(iπ/4) — push further up-right to clear the point marker
    if row["label"] == "z·e^(iπ/4)":
        dy = 0.35
        dx = 0.24
    offsets["dx"].append(rx + dx)
    offsets["dy"].append(iy + dy)
    offsets["align"].append(align)

df["label_x"] = offsets["dx"]
df["label_y"] = offsets["dy"]
df["label_align"] = offsets["align"]

# Unit circle parametric data (reference geometry)
theta = np.linspace(0, 2 * np.pi, 200)
circle_df = pd.DataFrame({"x": np.cos(theta), "y": np.sin(theta), "order": range(len(theta))})

# Vector segments: origin (0,0) → each complex number
arrow_rows = []
for _, row in df.iterrows():
    arrow_rows.append({"x": 0, "y": 0, "group": row["label"], "order": 0, "category": row["category"]})
    arrow_rows.append(
        {"x": row["real"], "y": row["imaginary"], "group": row["label"], "order": 1, "category": row["category"]}
    )
arrow_df = pd.DataFrame(arrow_rows)

# Arrowhead positions: pulled slightly back along the vector toward origin
head_offset = 0.08
arrowhead_rows = []
for _, row in df.iterrows():
    rx, iy = row["real"], row["imaginary"]
    mag = np.sqrt(rx**2 + iy**2)
    scale = head_offset / mag if mag > 0 else 0
    hx, hy = rx - scale * rx, iy - scale * iy
    vega_angle = 90 - np.degrees(np.arctan2(iy, rx))
    arrowhead_rows.append({"x": hx, "y": hy, "angle": vega_angle, "category": row["category"]})
arrowhead_df = pd.DataFrame(arrowhead_rows)

# Rotation arc: curved path from z to z·e^(iπ/4) at 55% of vector length
arc_start = np.arctan2(z_original.imag, z_original.real)
arc_end = arc_start + np.pi / 4
arc_theta = np.linspace(arc_start, arc_end, 40)
arc_r = abs(z_original) * 0.55
arc_df = pd.DataFrame({"x": arc_r * np.cos(arc_theta), "y": arc_r * np.sin(arc_theta), "order": range(40)})

# Axis range — expanded slightly so z₁ annotation label (label_x≈2.68) stays within domain
axis_limit = 2.75

# Axis lines through origin (real = horizontal, imaginary = vertical)
axis_line_data = pd.DataFrame(
    {
        "x": [-axis_limit, axis_limit, 0, 0],
        "y": [0, 0, -axis_limit, axis_limit],
        "axis": ["real", "real", "imag", "imag"],
        "order": [0, 1, 0, 1],
    }
)

# Color scale: Imprint positions 1→3 (green, lavender, blue)
cat_domain = ["Roots of Unity", "Arbitrary", "Transformation"]
cat_colors = [IMPRINT_PALETTE[0], IMPRINT_PALETTE[1], IMPRINT_PALETTE[2]]
color_scale = alt.Scale(domain=cat_domain, range=cat_colors)

# Interactive legend selection — click to highlight by category
highlight = alt.selection_point(fields=["category"], bind="legend")
opacity_cond = alt.condition(highlight, alt.value(1.0), alt.value(0.25))

# ── Layers ───────────────────────────────────────────────────────────────────

# Axis lines through origin (structural reference)
axes = (
    alt.Chart(axis_line_data)
    .mark_line(color=INK_MUTED, strokeWidth=1.5, opacity=0.6)
    .encode(x=alt.X("x:Q", axis=None), y=alt.Y("y:Q", axis=None), detail="axis:N", order="order:O")
)

# Dashed unit circle reference
unit_circle = (
    alt.Chart(circle_df)
    .mark_line(color=INK_SOFT, strokeWidth=2.0, strokeDash=[8, 6], opacity=0.5)
    .encode(x="x:Q", y="y:Q", order="order:O")
)

# Dashed arc showing the π/4 rotation angle
rotation_arc = (
    alt.Chart(arc_df)
    .mark_line(color=IMPRINT_PALETTE[2], strokeWidth=2.5, strokeDash=[5, 3], opacity=0.75)
    .encode(x="x:Q", y="y:Q", order="order:O")
)

# "π/4" label at arc midpoint
arc_mid_angle = arc_start + np.pi / 8
arc_label_df = pd.DataFrame(
    {"x": [arc_r * np.cos(arc_mid_angle) - 0.15], "y": [arc_r * np.sin(arc_mid_angle) + 0.16], "text": ["π/4"]}
)
arc_label = (
    alt.Chart(arc_label_df)
    .mark_text(fontSize=12, fontStyle="italic", fontWeight="bold", color=INK_SOFT, opacity=0.9)
    .encode(x="x:Q", y="y:Q", text="text:N")
)

# Vector lines from origin to each complex number
vectors = (
    alt.Chart(arrow_df)
    .mark_line(strokeWidth=2)
    .encode(
        x="x:Q",
        y="y:Q",
        detail="group:N",
        order="order:O",
        color=alt.Color("category:N", scale=color_scale, legend=None),
        opacity=opacity_cond,
    )
    .add_params(highlight)
)

# Triangular arrowheads — sized larger for full-resolution visibility
arrowheads = (
    alt.Chart(arrowhead_df)
    .mark_point(shape="triangle-up", filled=True, size=400)
    .encode(
        x="x:Q",
        y="y:Q",
        angle=alt.Angle("angle:Q"),
        color=alt.Color("category:N", scale=color_scale, legend=None),
        opacity=opacity_cond,
    )
    .add_params(highlight)
)

# Shared axis configuration (applied to both x and y via the points layer)
axis_cfg = {
    "tickCount": 11,
    "labelFontSize": 10,
    "titleFontSize": 12,
    "gridDash": [3, 3],
    "gridOpacity": 0.12,
    "titleColor": INK,
    "labelColor": INK_SOFT,
    "domainColor": INK_SOFT,
    "tickColor": INK_SOFT,
}

# Scatter points with PAGE_BG stroke for definition on both themes
points = (
    alt.Chart(df)
    .mark_point(filled=True, size=250, stroke=PAGE_BG, strokeWidth=2)
    .encode(
        x=alt.X(
            "real:Q", title="Real Axis", scale=alt.Scale(domain=[-axis_limit, axis_limit]), axis=alt.Axis(**axis_cfg)
        ),
        y=alt.Y(
            "imaginary:Q",
            title="Imaginary Axis",
            scale=alt.Scale(domain=[-axis_limit, axis_limit]),
            axis=alt.Axis(**axis_cfg),
        ),
        color=alt.Color(
            "category:N",
            scale=color_scale,
            legend=alt.Legend(
                title="Category",
                titleFontSize=10,
                labelFontSize=10,
                symbolType="circle",
                symbolSize=200,
                symbolStrokeWidth=0,
                orient="top-right",
                titleColor=INK,
                labelColor=INK_SOFT,
                fillColor=ELEVATED_BG,
                strokeColor=INK_SOFT,
            ),
        ),
        opacity=opacity_cond,
        tooltip=[
            alt.Tooltip("label:N", title="Label"),
            alt.Tooltip("rect_form:N", title="Value"),
            alt.Tooltip("category:N", title="Category"),
        ],
    )
    .add_params(highlight)
)

# Point labels: label + rectangular form annotation
annotations = (
    alt.Chart(df)
    .mark_text(fontSize=10, fontWeight="bold", color=INK)
    .encode(x="label_x:Q", y="label_y:Q", text="annotation:N", opacity=opacity_cond)
    .add_params(highlight)
)

# "Re" and "Im" italic labels at axis endpoints
axis_labels_df = pd.DataFrame({"x": [axis_limit - 0.15, 0.22], "y": [-0.22, axis_limit - 0.10], "text": ["Re", "Im"]})
axis_labels = (
    alt.Chart(axis_labels_df)
    .mark_text(fontSize=12, fontStyle="italic", fontWeight="bold", color=INK_MUTED)
    .encode(x="x:Q", y="y:Q", text="text:N")
)

# Compose all layers
title_text = "scatter-complex-plane · python · altair · anyplot.ai"
chart = (
    alt.layer(axes, unit_circle, rotation_arc, arc_label, vectors, arrowheads, points, annotations, axis_labels)
    .properties(
        width=460,
        height=460,
        background=PAGE_BG,
        title=alt.Title(
            title_text,
            fontSize=16,
            anchor="middle",
            color=INK,
            subtitle="Roots of unity, arbitrary points & rotation (z → z·e^(iπ/4)) in the complex plane",
            subtitleFontSize=12,
            subtitleColor=INK_SOFT,
        ),
    )
    .resolve_scale(color="independent")
    .configure_view(fill=PAGE_BG, strokeWidth=0, continuousWidth=460, continuousHeight=460)
    .configure_axis(titlePadding=14)
    .configure_legend(fillColor=ELEVATED_BG, strokeColor=INK_SOFT, labelColor=INK_SOFT, titleColor=INK)
    .interactive()
)

# Save PNG and HTML (theme-suffixed filenames required by pipeline)
chart.save(f"plot-{THEME}.png", scale_factor=4.0)
chart.save(f"plot-{THEME}.html")

# Pad PNG to exact 2400×2400 target (square canvas — equal aspect ratio spec)
TW, TH = 2400, 2400
_img = Image.open(f"plot-{THEME}.png").convert("RGB")
_w, _h = _img.size
if _w > TW or _h > TH:
    raise SystemExit(
        f"altair vl-convert produced {_w}×{_h}, exceeds target {TW}×{TH}. "
        f"Shrink chart .properties(width=, height=) values and re-render."
    )
if _w < TW or _h < TH:
    _bg_rgb = tuple(int(PAGE_BG.lstrip("#")[i : i + 2], 16) for i in (0, 2, 4))
    _canvas = Image.new("RGB", (TW, TH), _bg_rgb)
    _canvas.paste(_img, ((TW - _w) // 2, (TH - _h) // 2))
    _canvas.save(f"plot-{THEME}.png")
Runnable source as JSON, for any HTTP client: https://api.anyplot.ai/specs/scatter-complex-plane/altair/code. Any spec id and library id listed in llms-full.txt fit the same URL shape; every URL below is complete and callable.
{
  "spec_id": "scatter-complex-plane",
  "language": "python",
  "library": "altair",
  "page": "https://anyplot.ai/scatter-complex-plane/python/altair",
  "hub": "https://anyplot.ai/scatter-complex-plane",
  "code_json": "https://api.anyplot.ai/specs/scatter-complex-plane/altair/code",
  "spec_json": "https://api.anyplot.ai/specs/scatter-complex-plane",
  "render_light_png": "https://storage.googleapis.com/anyplot-images/plots/scatter-complex-plane/python/altair/plot-light.png",
  "render_dark_png": "https://storage.googleapis.com/anyplot-images/plots/scatter-complex-plane/python/altair/plot-dark.png",
  "interactive_light_html": "https://storage.googleapis.com/anyplot-images/plots/scatter-complex-plane/python/altair/plot-light.html",
  "interactive_dark_html": "https://storage.googleapis.com/anyplot-images/plots/scatter-complex-plane/python/altair/plot-dark.html",
  "quality_score": 88.0,
  "license": "MIT",
  "guide": "https://anyplot.ai/llms.txt"
}
Part of Complex Plane Visualization (Argand Diagram) on anyplot.ai.