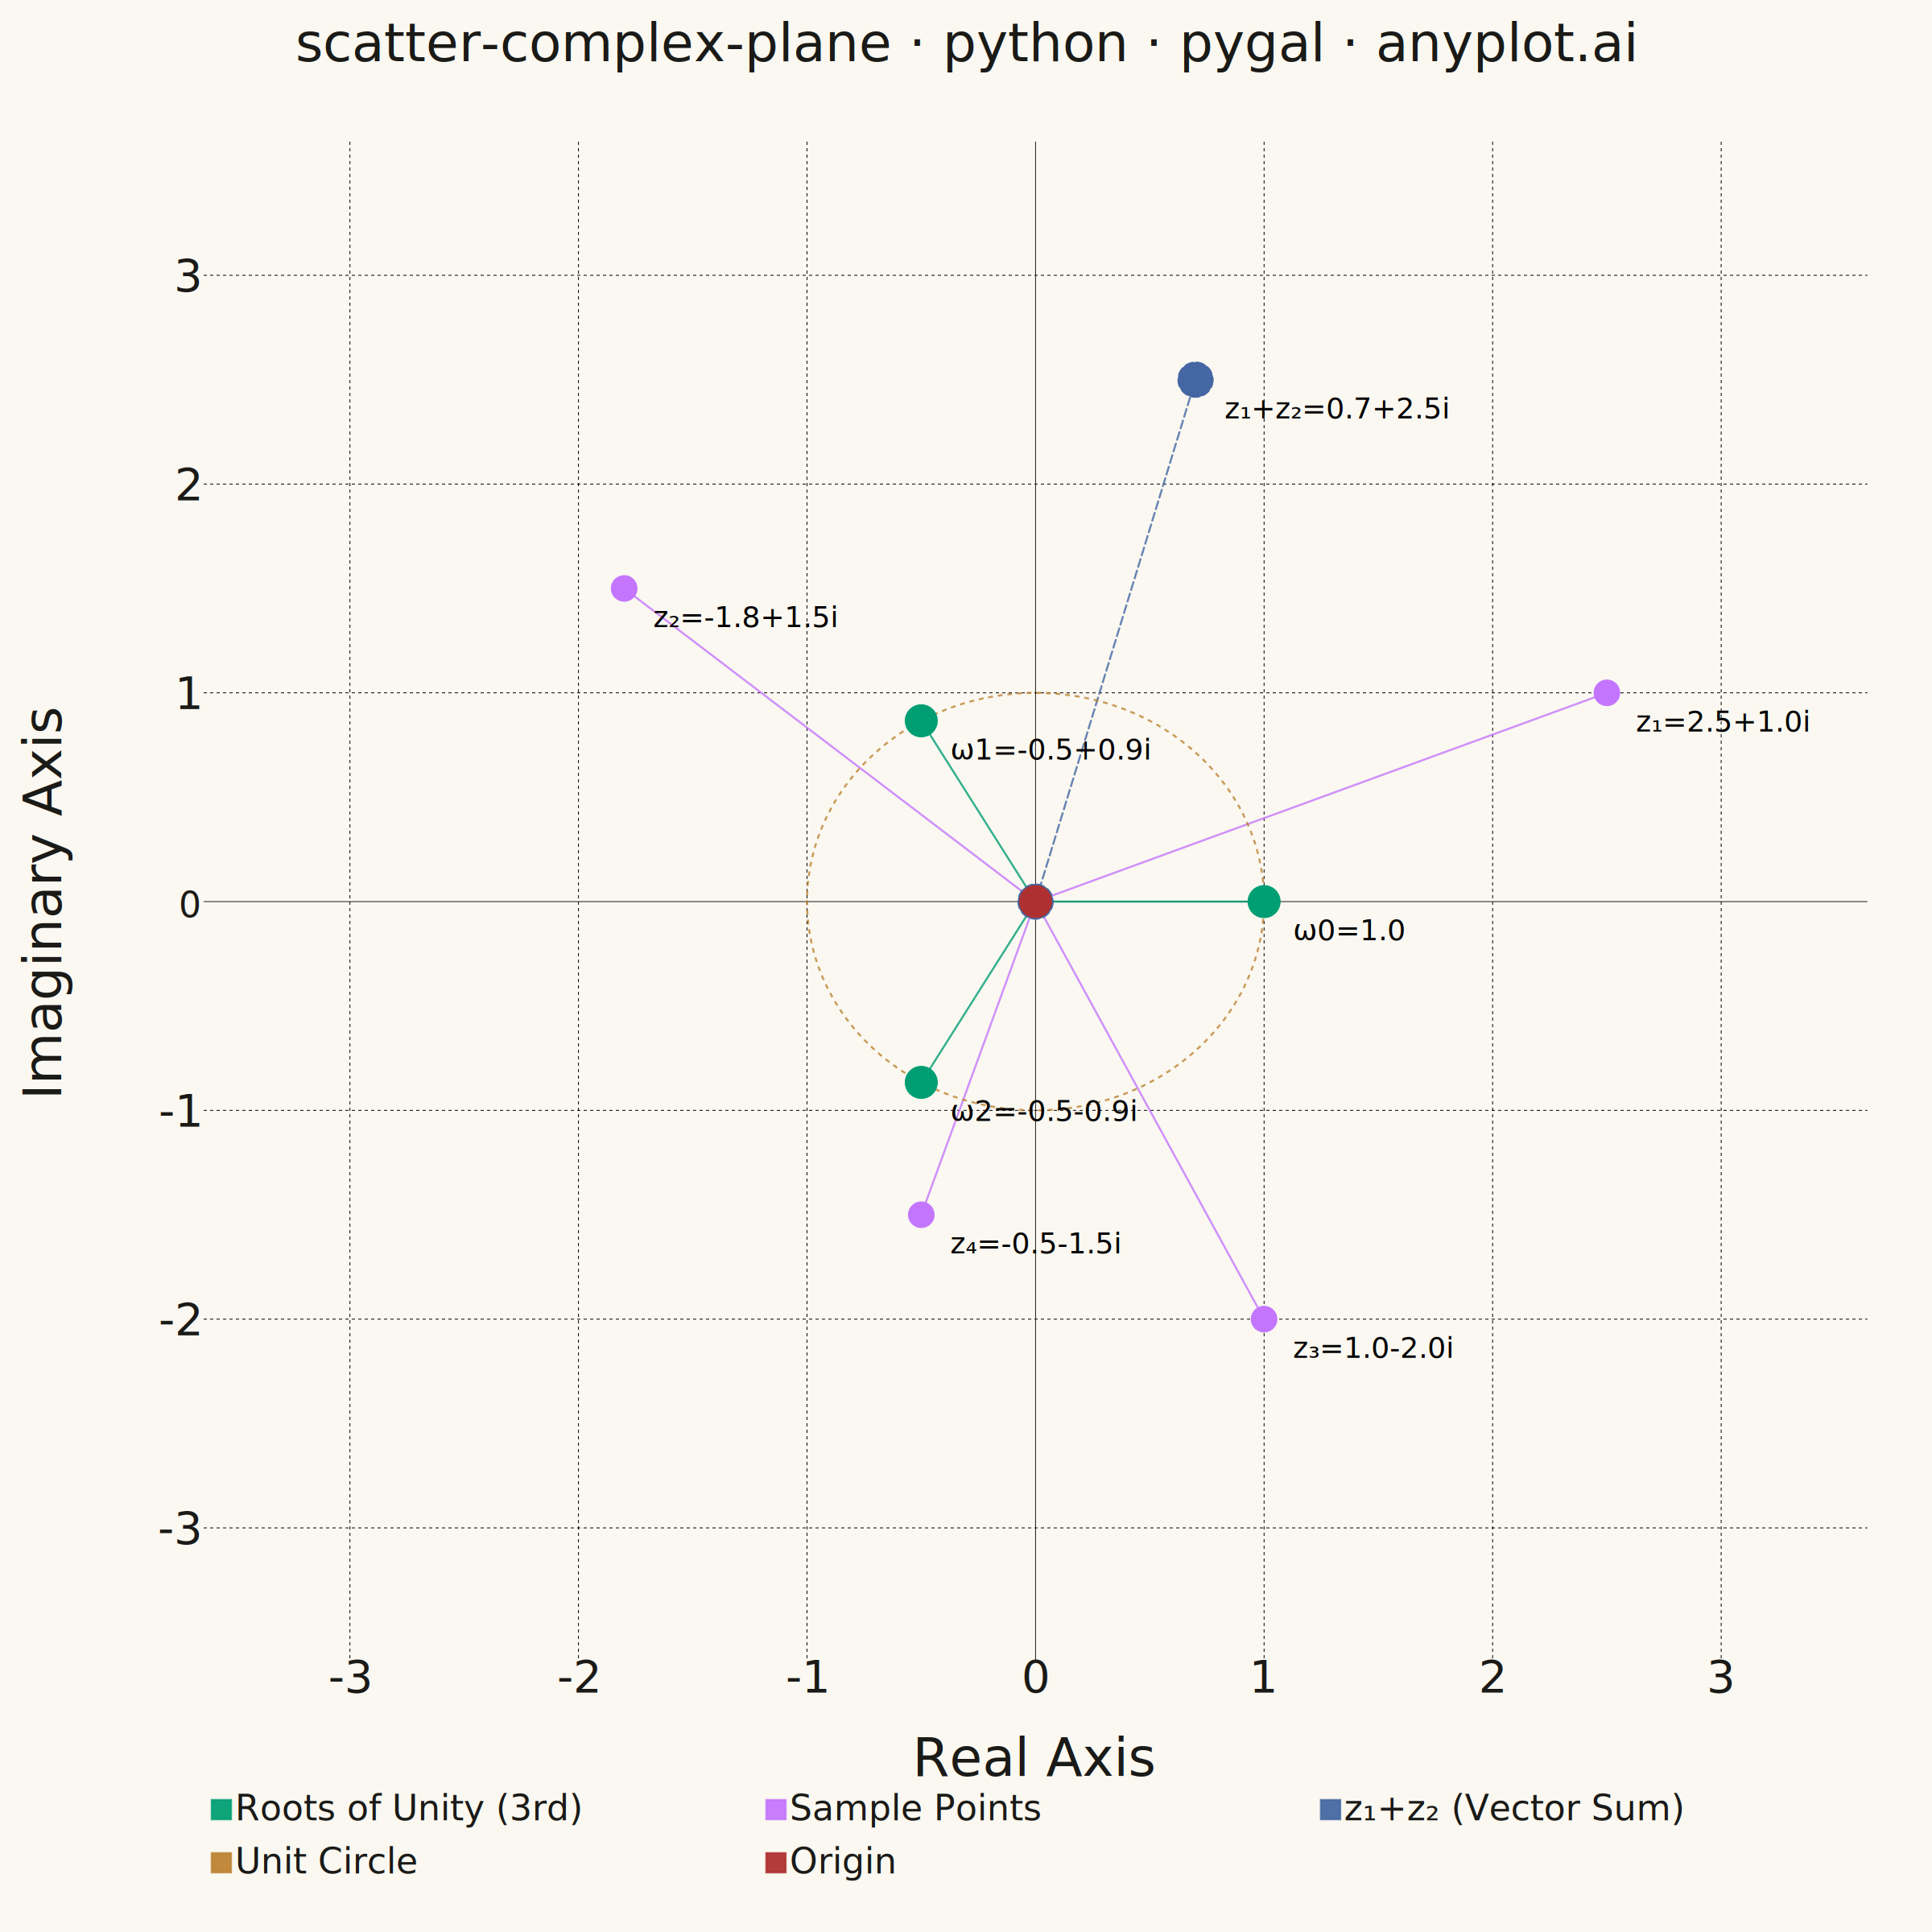
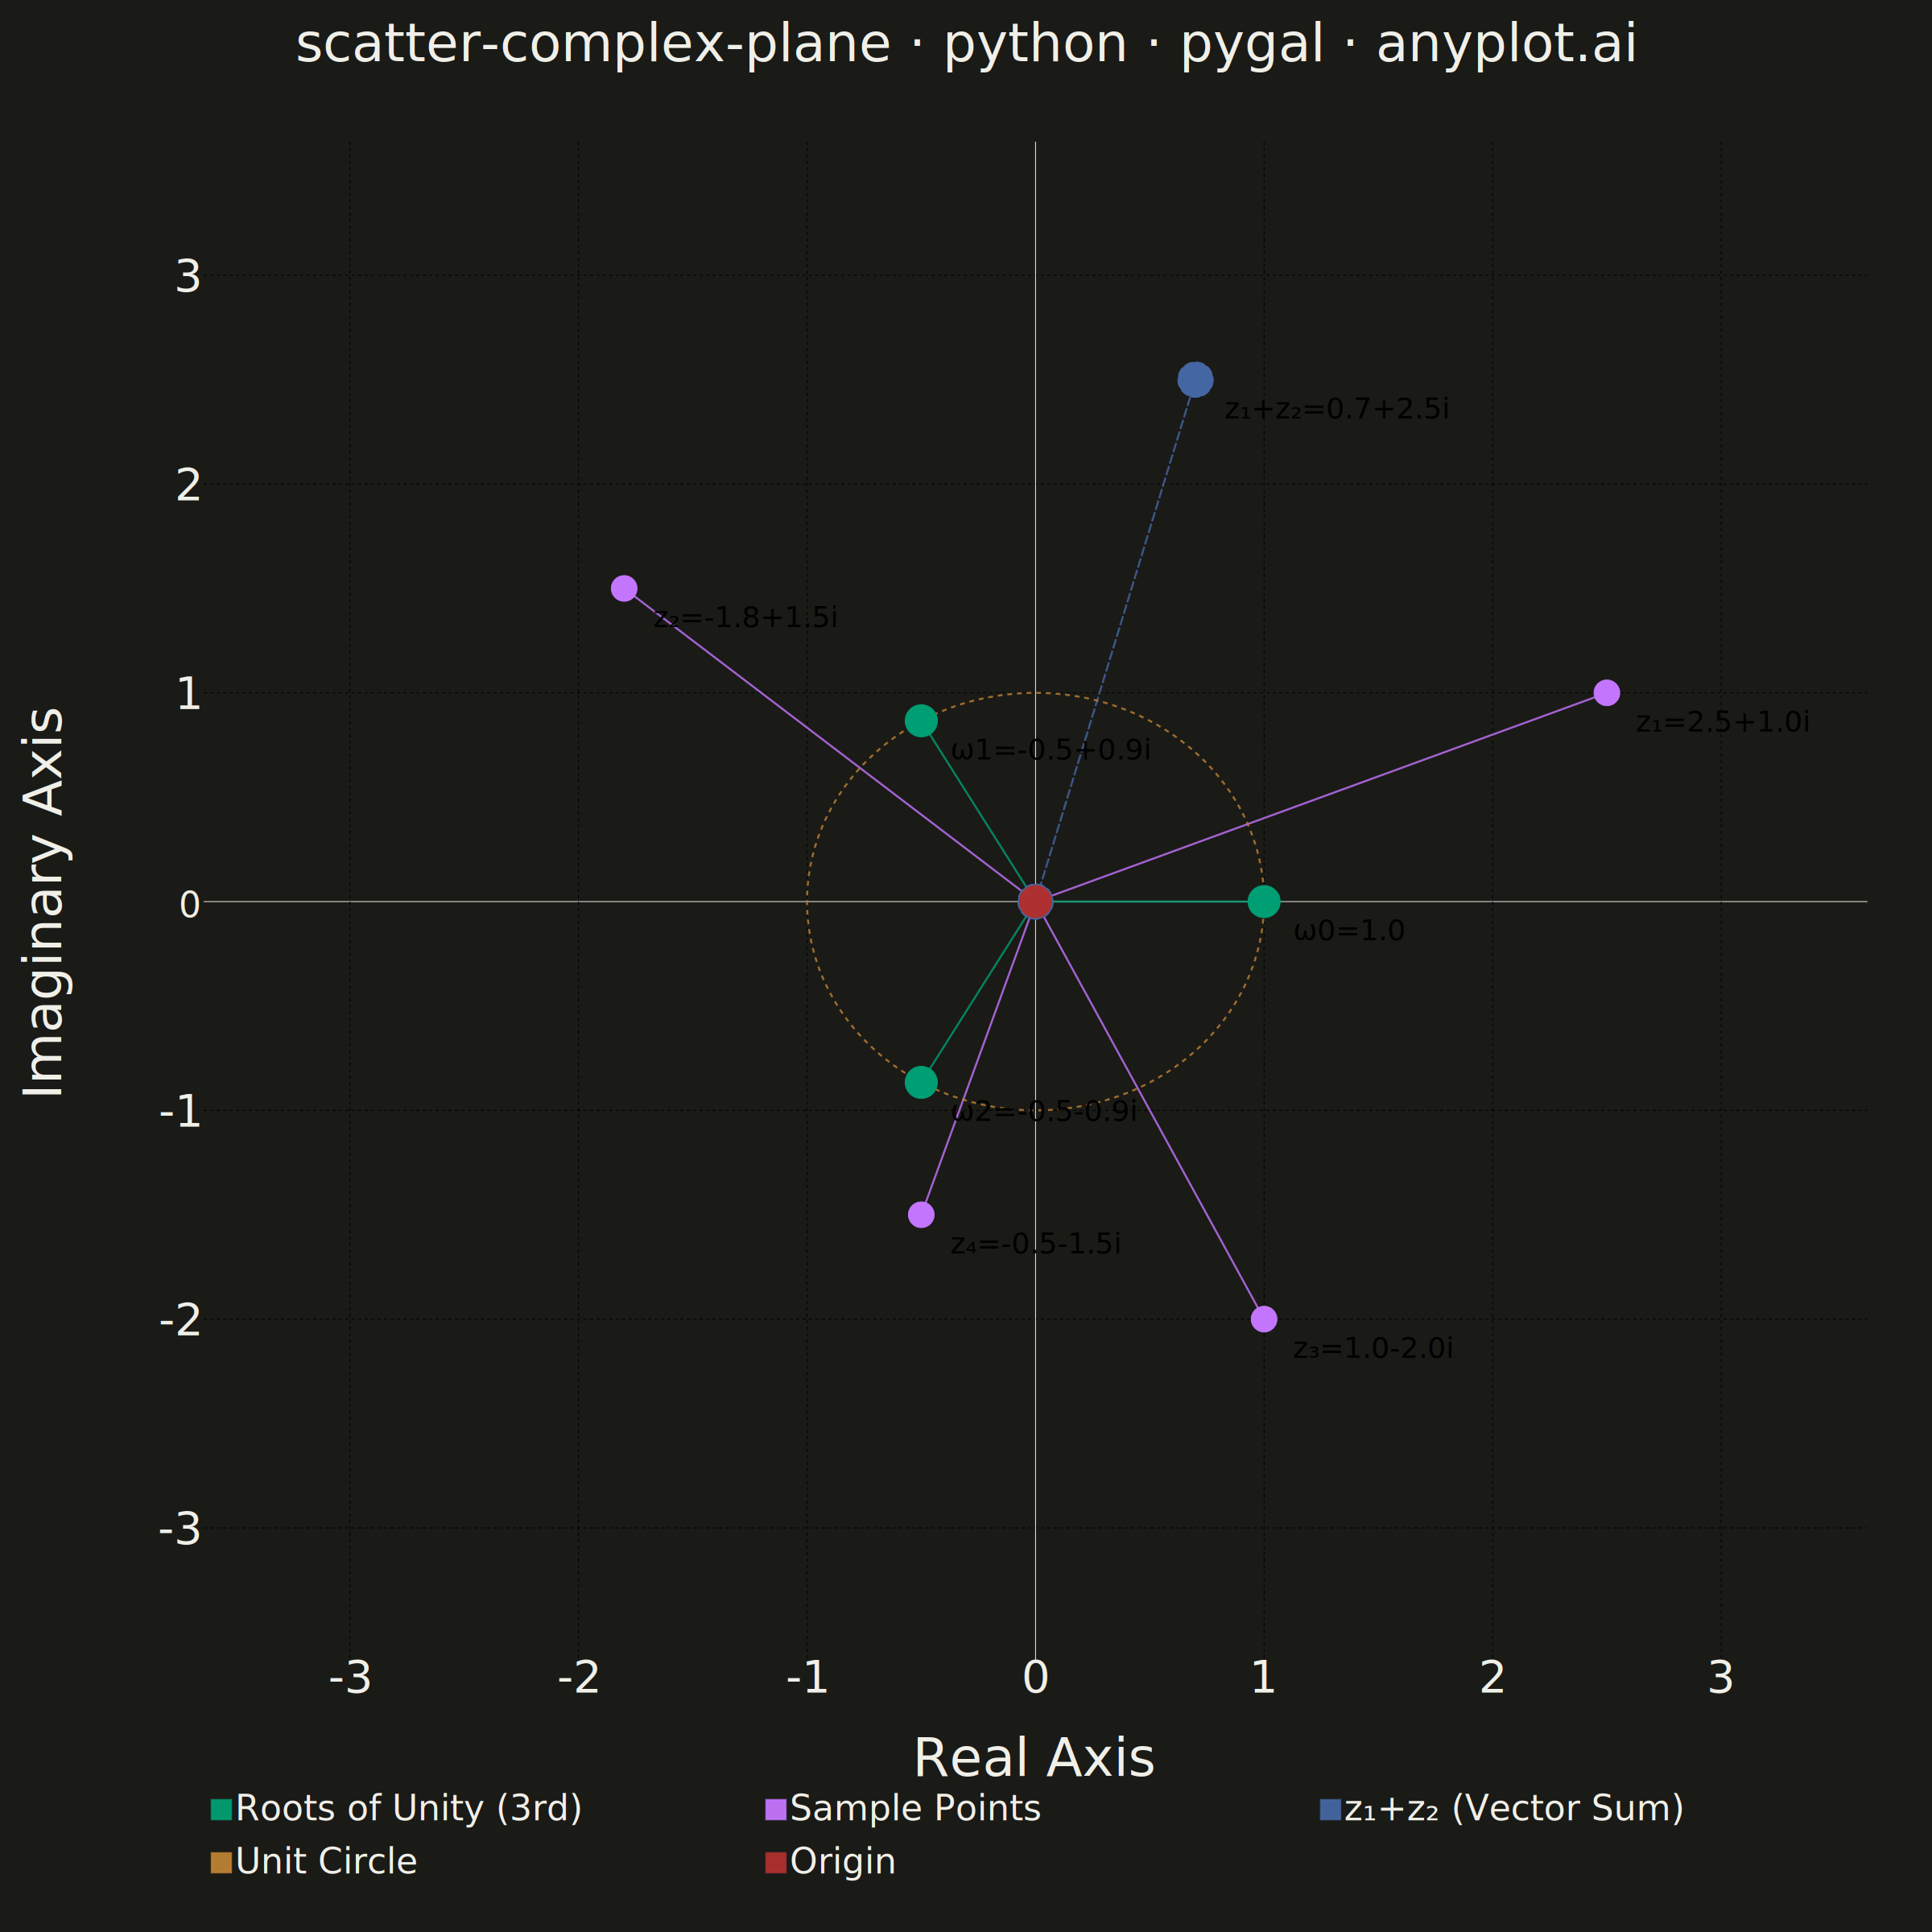
An Argand diagram plots complex numbers as points in the complex plane, with the real part on the x-axis and the imaginary part on the y-axis. Vectors from the origin to each point illustrate magnitude and phase angle, while a unit circle provides a geometric reference. This visualization is foundational for complex analysis, signal processing, and understanding operations like addition, multiplication, and roots of unity geometrically.
""" anyplot.ai
scatter-complex-plane: Complex Plane Visualization (Argand Diagram)
Library: pygal 3.1.0 | Python 3.13.13
Quality: 83/100 | Updated: 2026-06-02
"""

import os

import numpy as np
import pygal
from pygal.style import Style


# Theme tokens (Imprint palette)
THEME = os.getenv("ANYPLOT_THEME", "light")
PAGE_BG = "#FAF8F1" if THEME == "light" else "#1A1A17"
INK = "#1A1A17" if THEME == "light" else "#F0EFE8"
INK_MUTED = "#6B6A63" if THEME == "light" else "#A8A79F"

IMPRINT_PALETTE = ("#009E73", "#C475FD", "#4467A3", "#BD8233", "#AE3030", "#2ABCCD", "#954477", "#99B314")

# Data — 3rd roots of unity + sample complex numbers + vector sum
np.random.seed(42)
roots_of_unity = [np.exp(2j * np.pi * k / 3) for k in range(3)]
sample_pts = [2.5 + 1.0j, -1.8 + 1.5j, 1.0 - 2.0j, -0.5 - 1.5j]
z1, z2 = sample_pts[0], sample_pts[1]
z_sum = z1 + z2  # complex addition: parallelogram / vector sum law

# Pre-compute labels inline (no helper function)
root_labels = [
    (
        f"ω{k}={z.real:.1f}"
        if abs(z.imag) < 1e-10
        else f"ω{k}={z.imag:.1f}i"
        if abs(z.real) < 1e-10
        else f"ω{k}={z.real:.1f}{z.imag:+.1f}i"
    )
    for k, z in enumerate(roots_of_unity)
]
pt_names = ["z₁", "z₂", "z₃", "z₄"]
pt_labels = [
    (
        f"{n}={z.real:.1f}"
        if abs(z.imag) < 1e-10
        else f"{n}={z.imag:.1f}i"
        if abs(z.real) < 1e-10
        else f"{n}={z.real:.1f}{z.imag:+.1f}i"
    )
    for n, z in zip(pt_names, sample_pts, strict=False)
]
sum_label = f"z₁+z₂={z_sum.real:.1f}{z_sum.imag:+.1f}i"

# Unit circle reference points
theta = np.linspace(0, 2 * np.pi, 180)
unit_circle = [(float(np.cos(t)), float(np.sin(t))) for t in theta]

# Title — 51 chars, under 67-char baseline so default fontsize applies
title = "scatter-complex-plane · python · pygal · anyplot.ai"
title_fs = max(44, round(66 * 67 / max(len(title), 67)))

# Style
custom_style = Style(
    background=PAGE_BG,
    plot_background=PAGE_BG,
    foreground=INK,
    foreground_strong=INK,
    foreground_subtle=INK_MUTED,
    colors=IMPRINT_PALETTE,
    font_family="DejaVu Sans, Helvetica, Arial, sans-serif",
    title_font_family="DejaVu Sans, Helvetica, Arial, sans-serif",
    title_font_size=title_fs,
    label_font_size=56,
    major_label_font_size=44,
    legend_font_size=44,
    value_font_size=36,
    value_label_font_size=36,
    stroke_width=2.5,
    opacity=0.94,
    opacity_hover=1.0,
)

# Chart — square canvas ensures equal aspect ratio for the Argand diagram
chart = pygal.XY(
    width=2400,
    height=2400,
    style=custom_style,
    title=title,
    x_title="Real Axis",
    y_title="Imaginary Axis",
    show_legend=True,
    legend_at_bottom=True,
    legend_at_bottom_columns=3,
    legend_box_size=24,
    stroke=False,
    dots_size=12,
    show_x_guides=True,
    show_y_guides=True,
    truncate_legend=-1,
    margin_bottom=140,
    margin_left=100,
    margin_right=80,
    margin_top=100,
    range=(-3.5, 3.5),
    xrange=(-3.5, 3.5),
    print_values=False,
    print_labels=True,
    js=[],
)

# Series 1: Roots of Unity (3rd) — Imprint #009E73
roots_series = []
for i, z in enumerate(roots_of_unity):
    roots_series += [
        {"value": (0.0, 0.0), "label": ""},
        {"value": (float(z.real), float(z.imag)), "label": root_labels[i]},
        None,
    ]
chart.add(
    "Roots of Unity (3rd)",
    roots_series,
    stroke=True,
    show_dots=True,
    dots_size=20,
    stroke_style={"width": 5, "linecap": "round", "opacity": 0.88},
)

# Series 2: Sample Points — Imprint #C475FD
pt_series = []
for i, z in enumerate(sample_pts):
    pt_series += [
        {"value": (0.0, 0.0), "label": ""},
        {"value": (float(z.real), float(z.imag)), "label": pt_labels[i]},
        None,
    ]
chart.add(
    "Sample Points",
    pt_series,
    stroke=True,
    show_dots=True,
    dots_size=16,
    stroke_style={"width": 3.5, "linecap": "round", "opacity": 0.75},
)

# Series 3: Vector Sum z₁+z₂ — Imprint #4467A3 (dashed = result of addition)
chart.add(
    "z₁+z₂ (Vector Sum)",
    [{"value": (0.0, 0.0), "label": ""}, {"value": (float(z_sum.real), float(z_sum.imag)), "label": sum_label}],
    stroke=True,
    show_dots=True,
    dots_size=22,
    stroke_style={"width": 6, "dasharray": "10, 5", "linecap": "round", "opacity": 0.92},
)

# Series 4: Unit Circle — Imprint #BD8233, subtle dashed reference
chart.add(
    "Unit Circle",
    unit_circle,
    stroke=True,
    show_dots=False,
    fill=False,
    stroke_style={"width": 2.5, "dasharray": "6, 6", "opacity": 0.40},
)

# Series 5: Origin — Imprint #AE3030, drawn last to render on top of all vectors
chart.add("Origin", [{"value": (0.0, 0.0), "label": ""}], stroke=False, dots_size=20)

# Save
chart.render_to_png(f"plot-{THEME}.png")
with open(f"plot-{THEME}.html", "wb") as f:
    f.write(chart.render())
Runnable source as JSON, for any HTTP client: https://api.anyplot.ai/specs/scatter-complex-plane/pygal/code. Any spec id and library id listed in llms-full.txt fit the same URL shape; every URL below is complete and callable.
{
  "spec_id": "scatter-complex-plane",
  "language": "python",
  "library": "pygal",
  "page": "https://anyplot.ai/scatter-complex-plane/python/pygal",
  "hub": "https://anyplot.ai/scatter-complex-plane",
  "code_json": "https://api.anyplot.ai/specs/scatter-complex-plane/pygal/code",
  "spec_json": "https://api.anyplot.ai/specs/scatter-complex-plane",
  "render_light_png": "https://storage.googleapis.com/anyplot-images/plots/scatter-complex-plane/python/pygal/plot-light.png",
  "render_dark_png": "https://storage.googleapis.com/anyplot-images/plots/scatter-complex-plane/python/pygal/plot-dark.png",
  "interactive_light_html": "https://storage.googleapis.com/anyplot-images/plots/scatter-complex-plane/python/pygal/plot-light.html",
  "interactive_dark_html": "https://storage.googleapis.com/anyplot-images/plots/scatter-complex-plane/python/pygal/plot-dark.html",
  "quality_score": 83.0,
  "license": "MIT",
  "guide": "https://anyplot.ai/llms.txt"
}
Part of Complex Plane Visualization (Argand Diagram) on anyplot.ai.