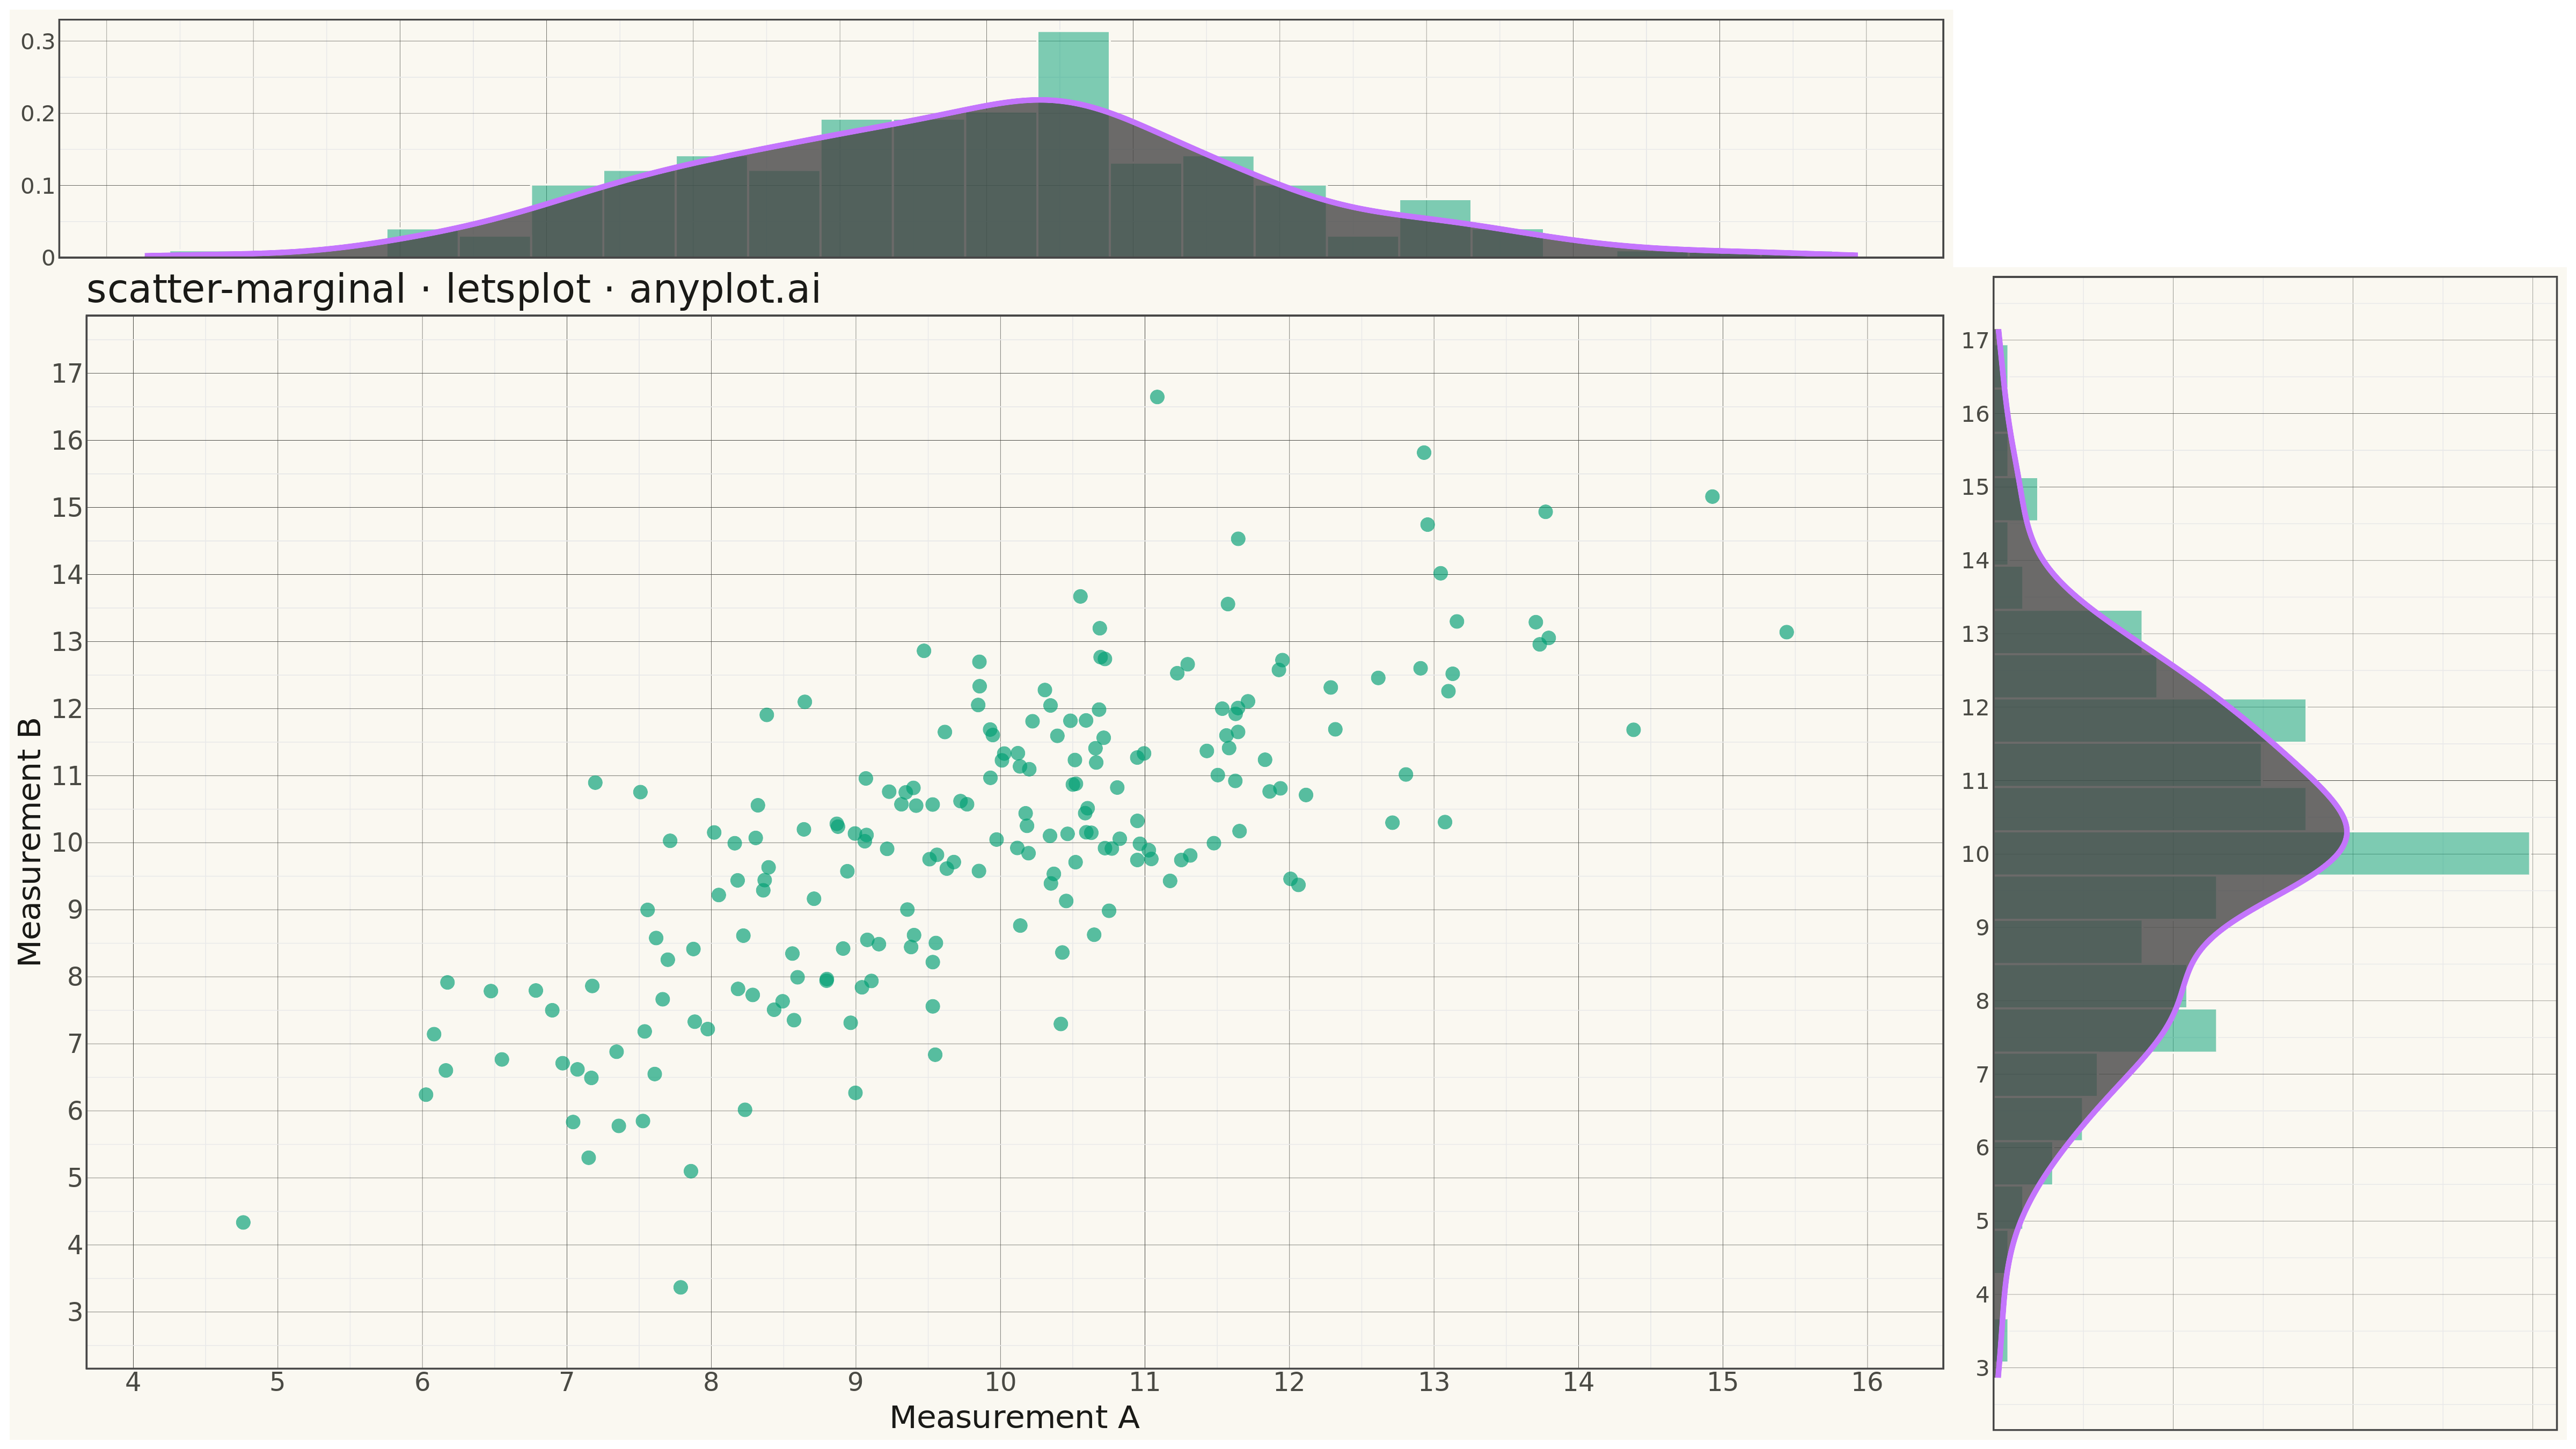
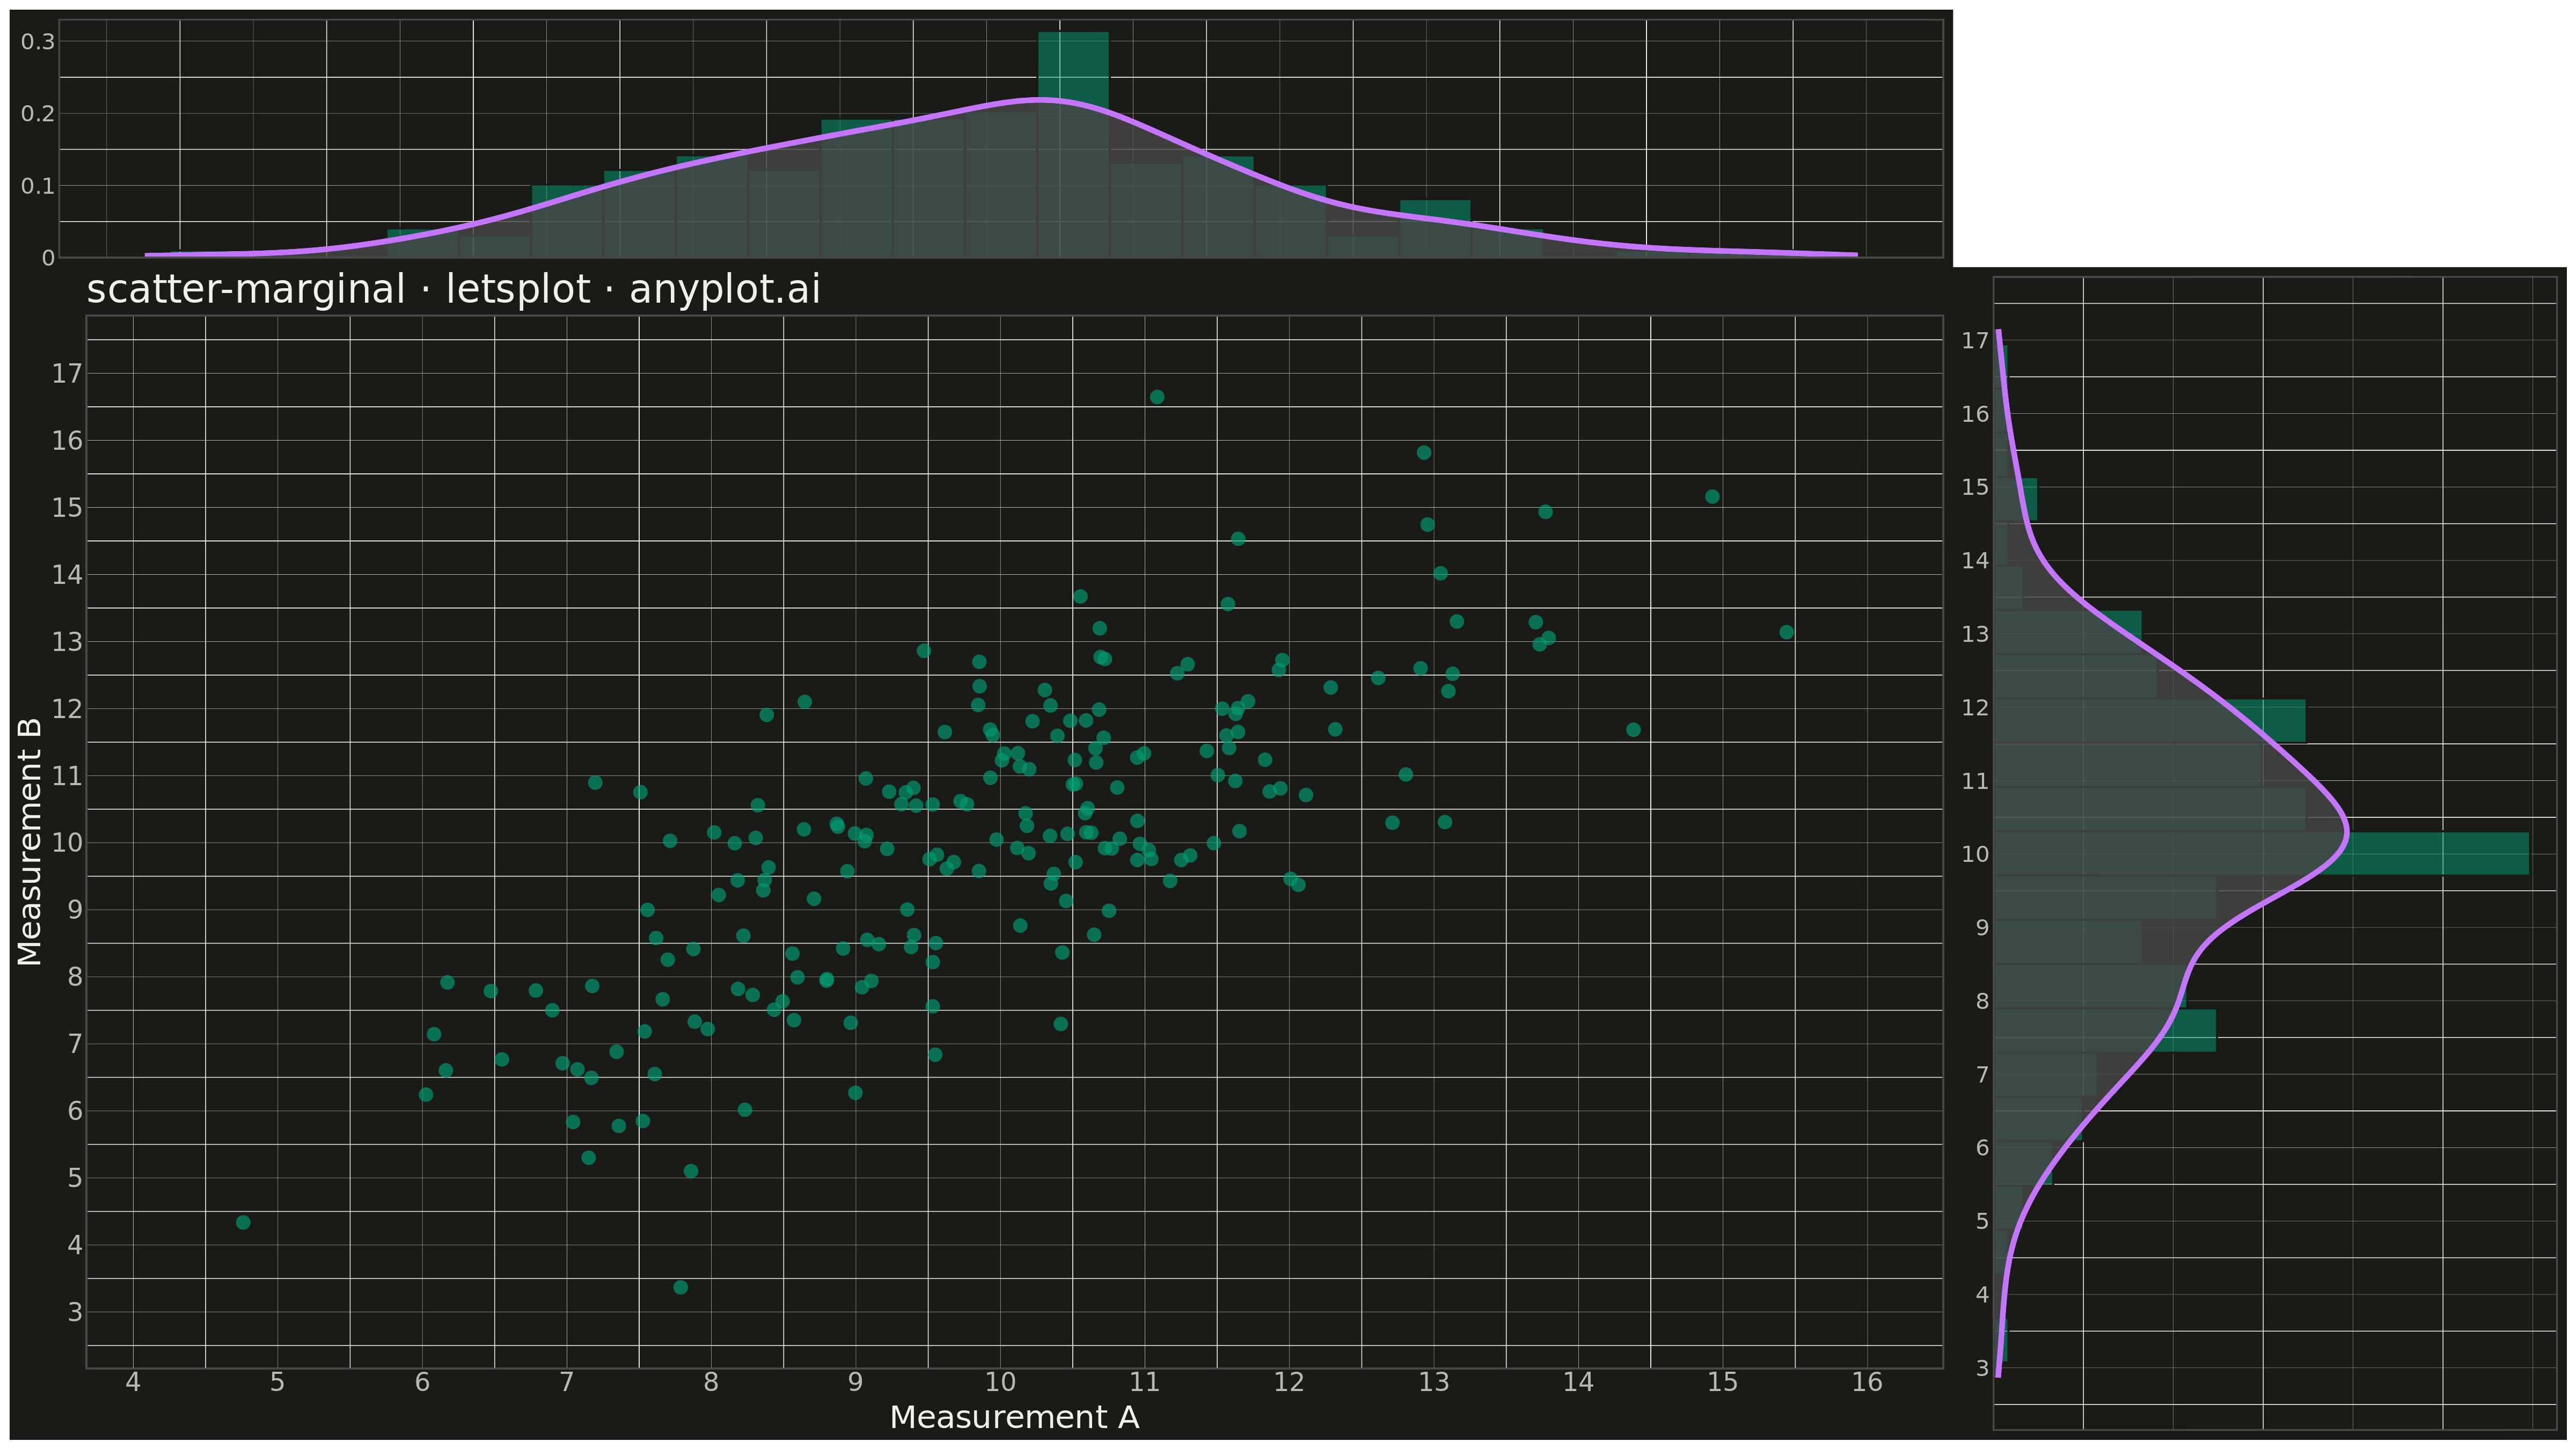
A scatter plot enhanced with marginal distribution plots (histograms or kernel density estimates) on the top and right axes. This composite visualization simultaneously shows the bivariate relationship between two variables in the central scatter plot while displaying each variable's univariate distribution along its respective axis. It provides a comprehensive view of both the joint and marginal distributions in a single figure.
Preview render from the lets-plot implementation.