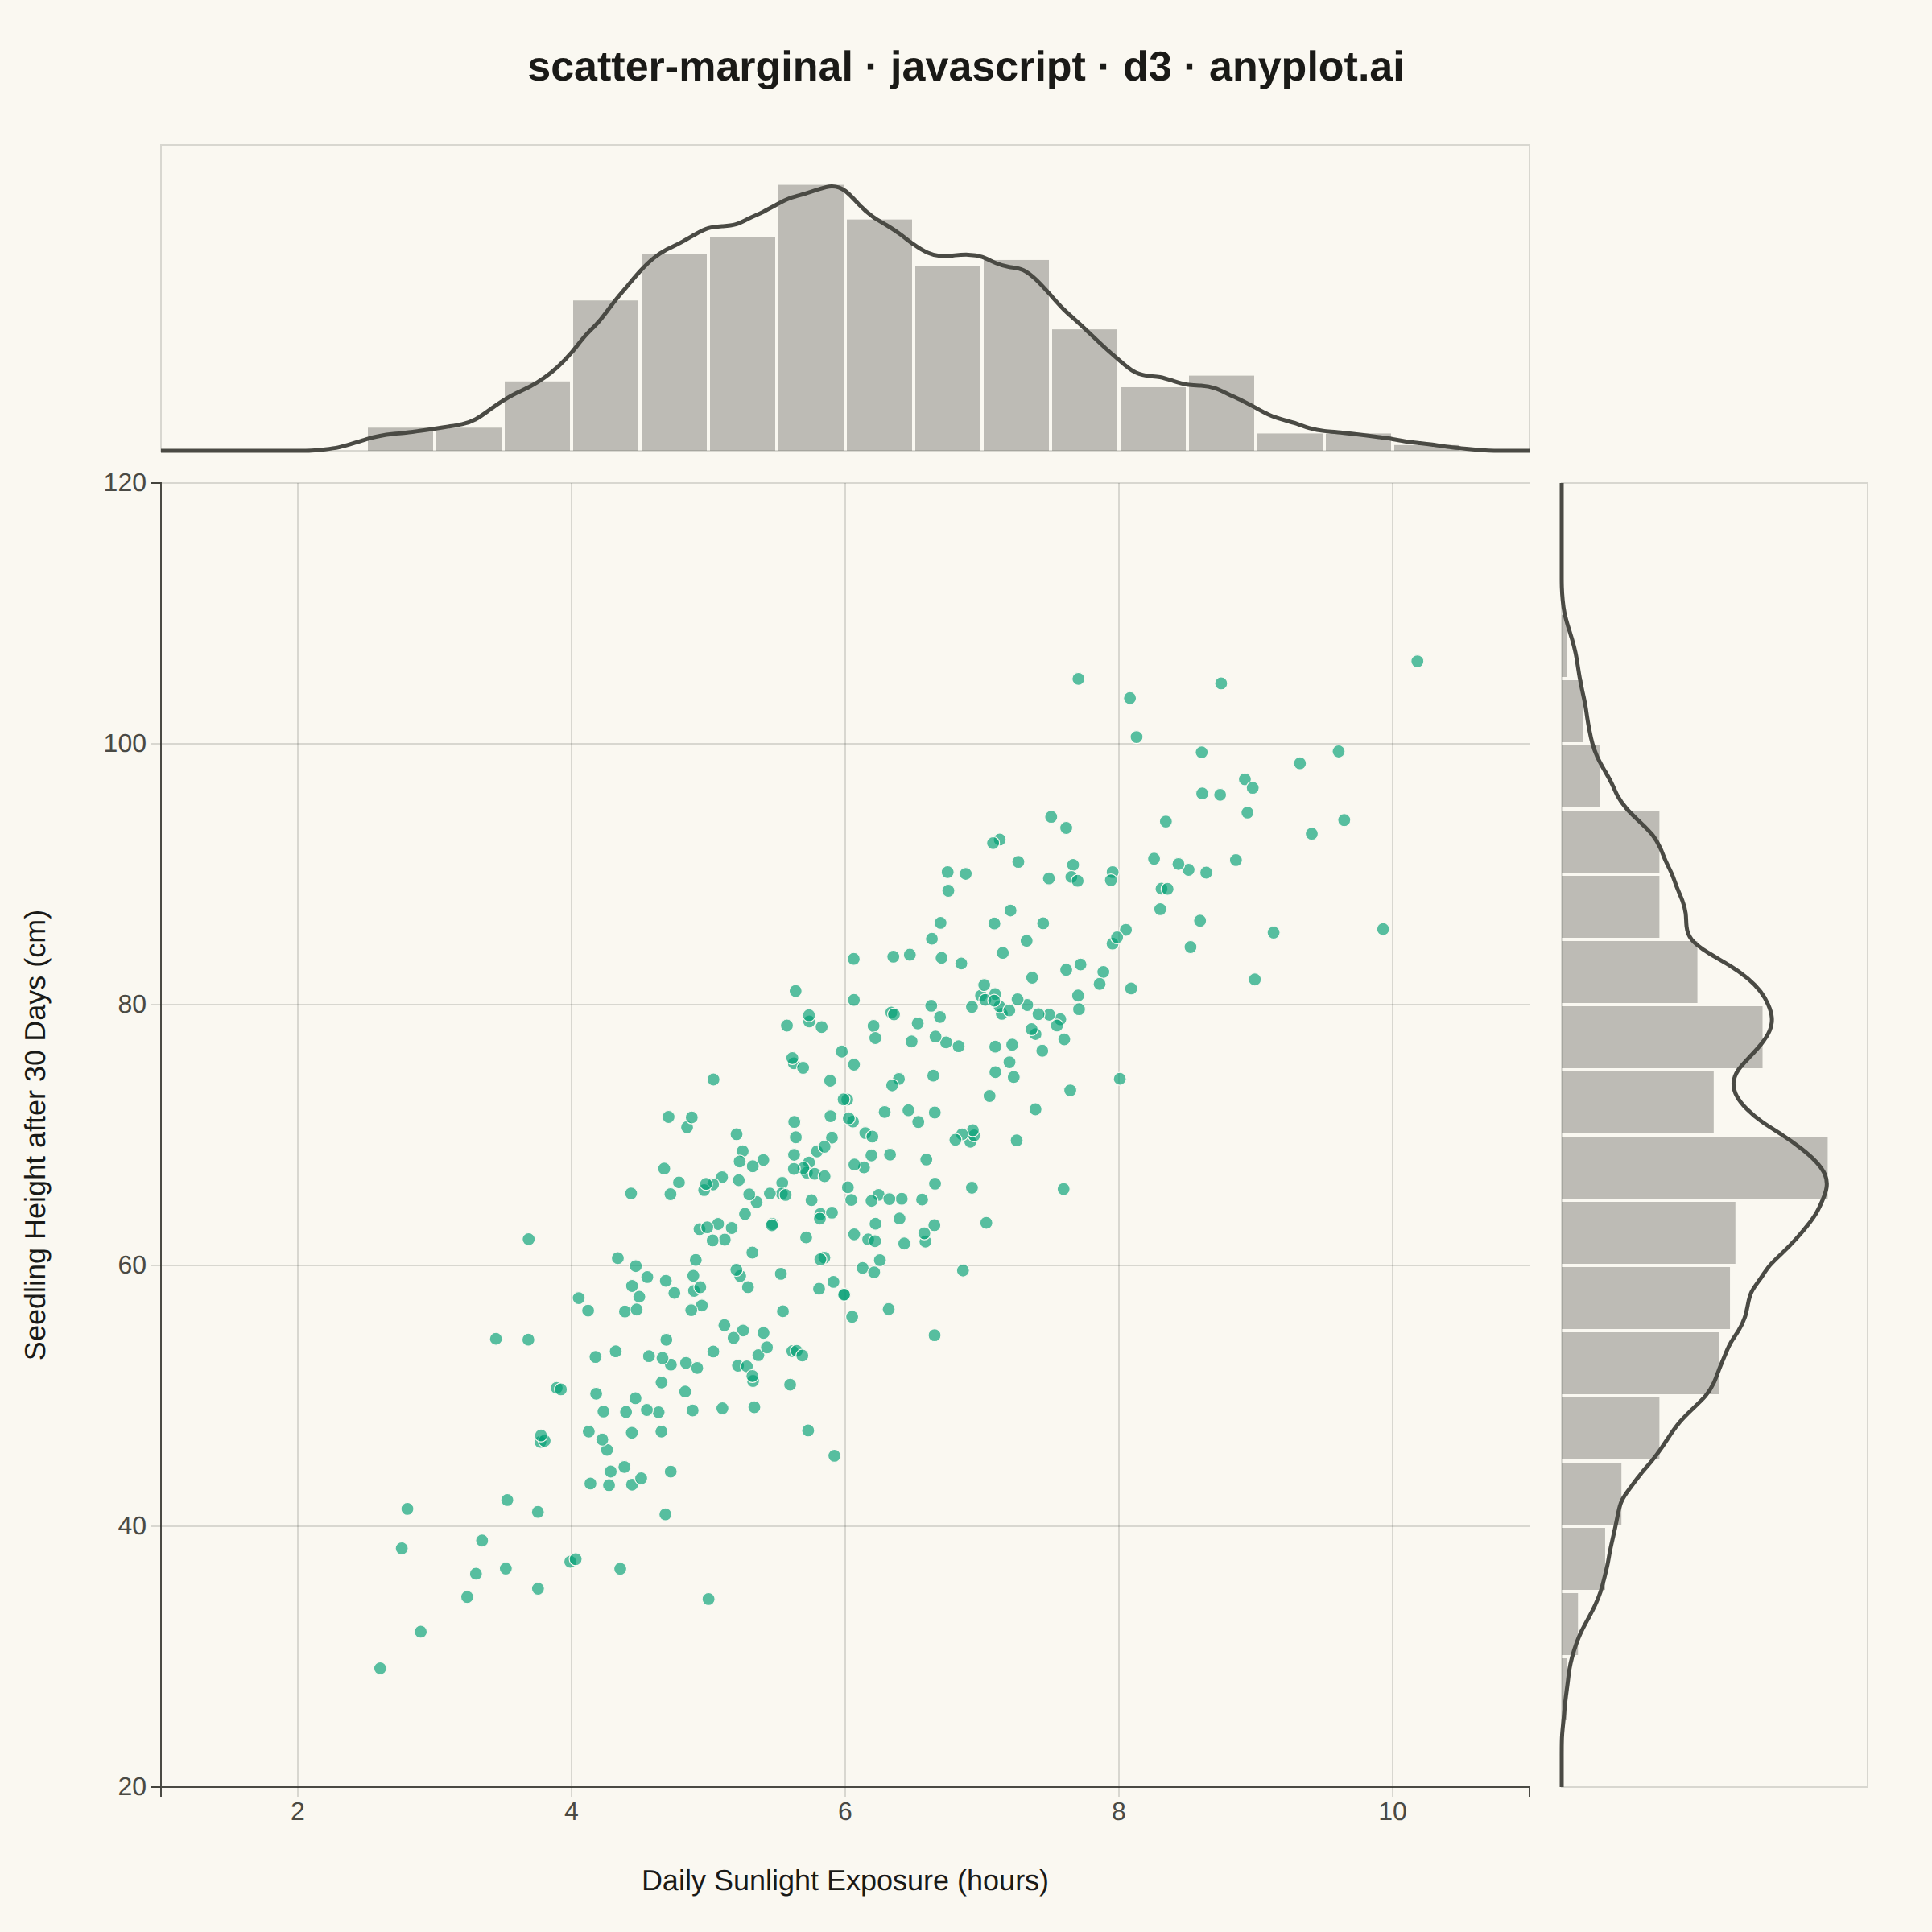
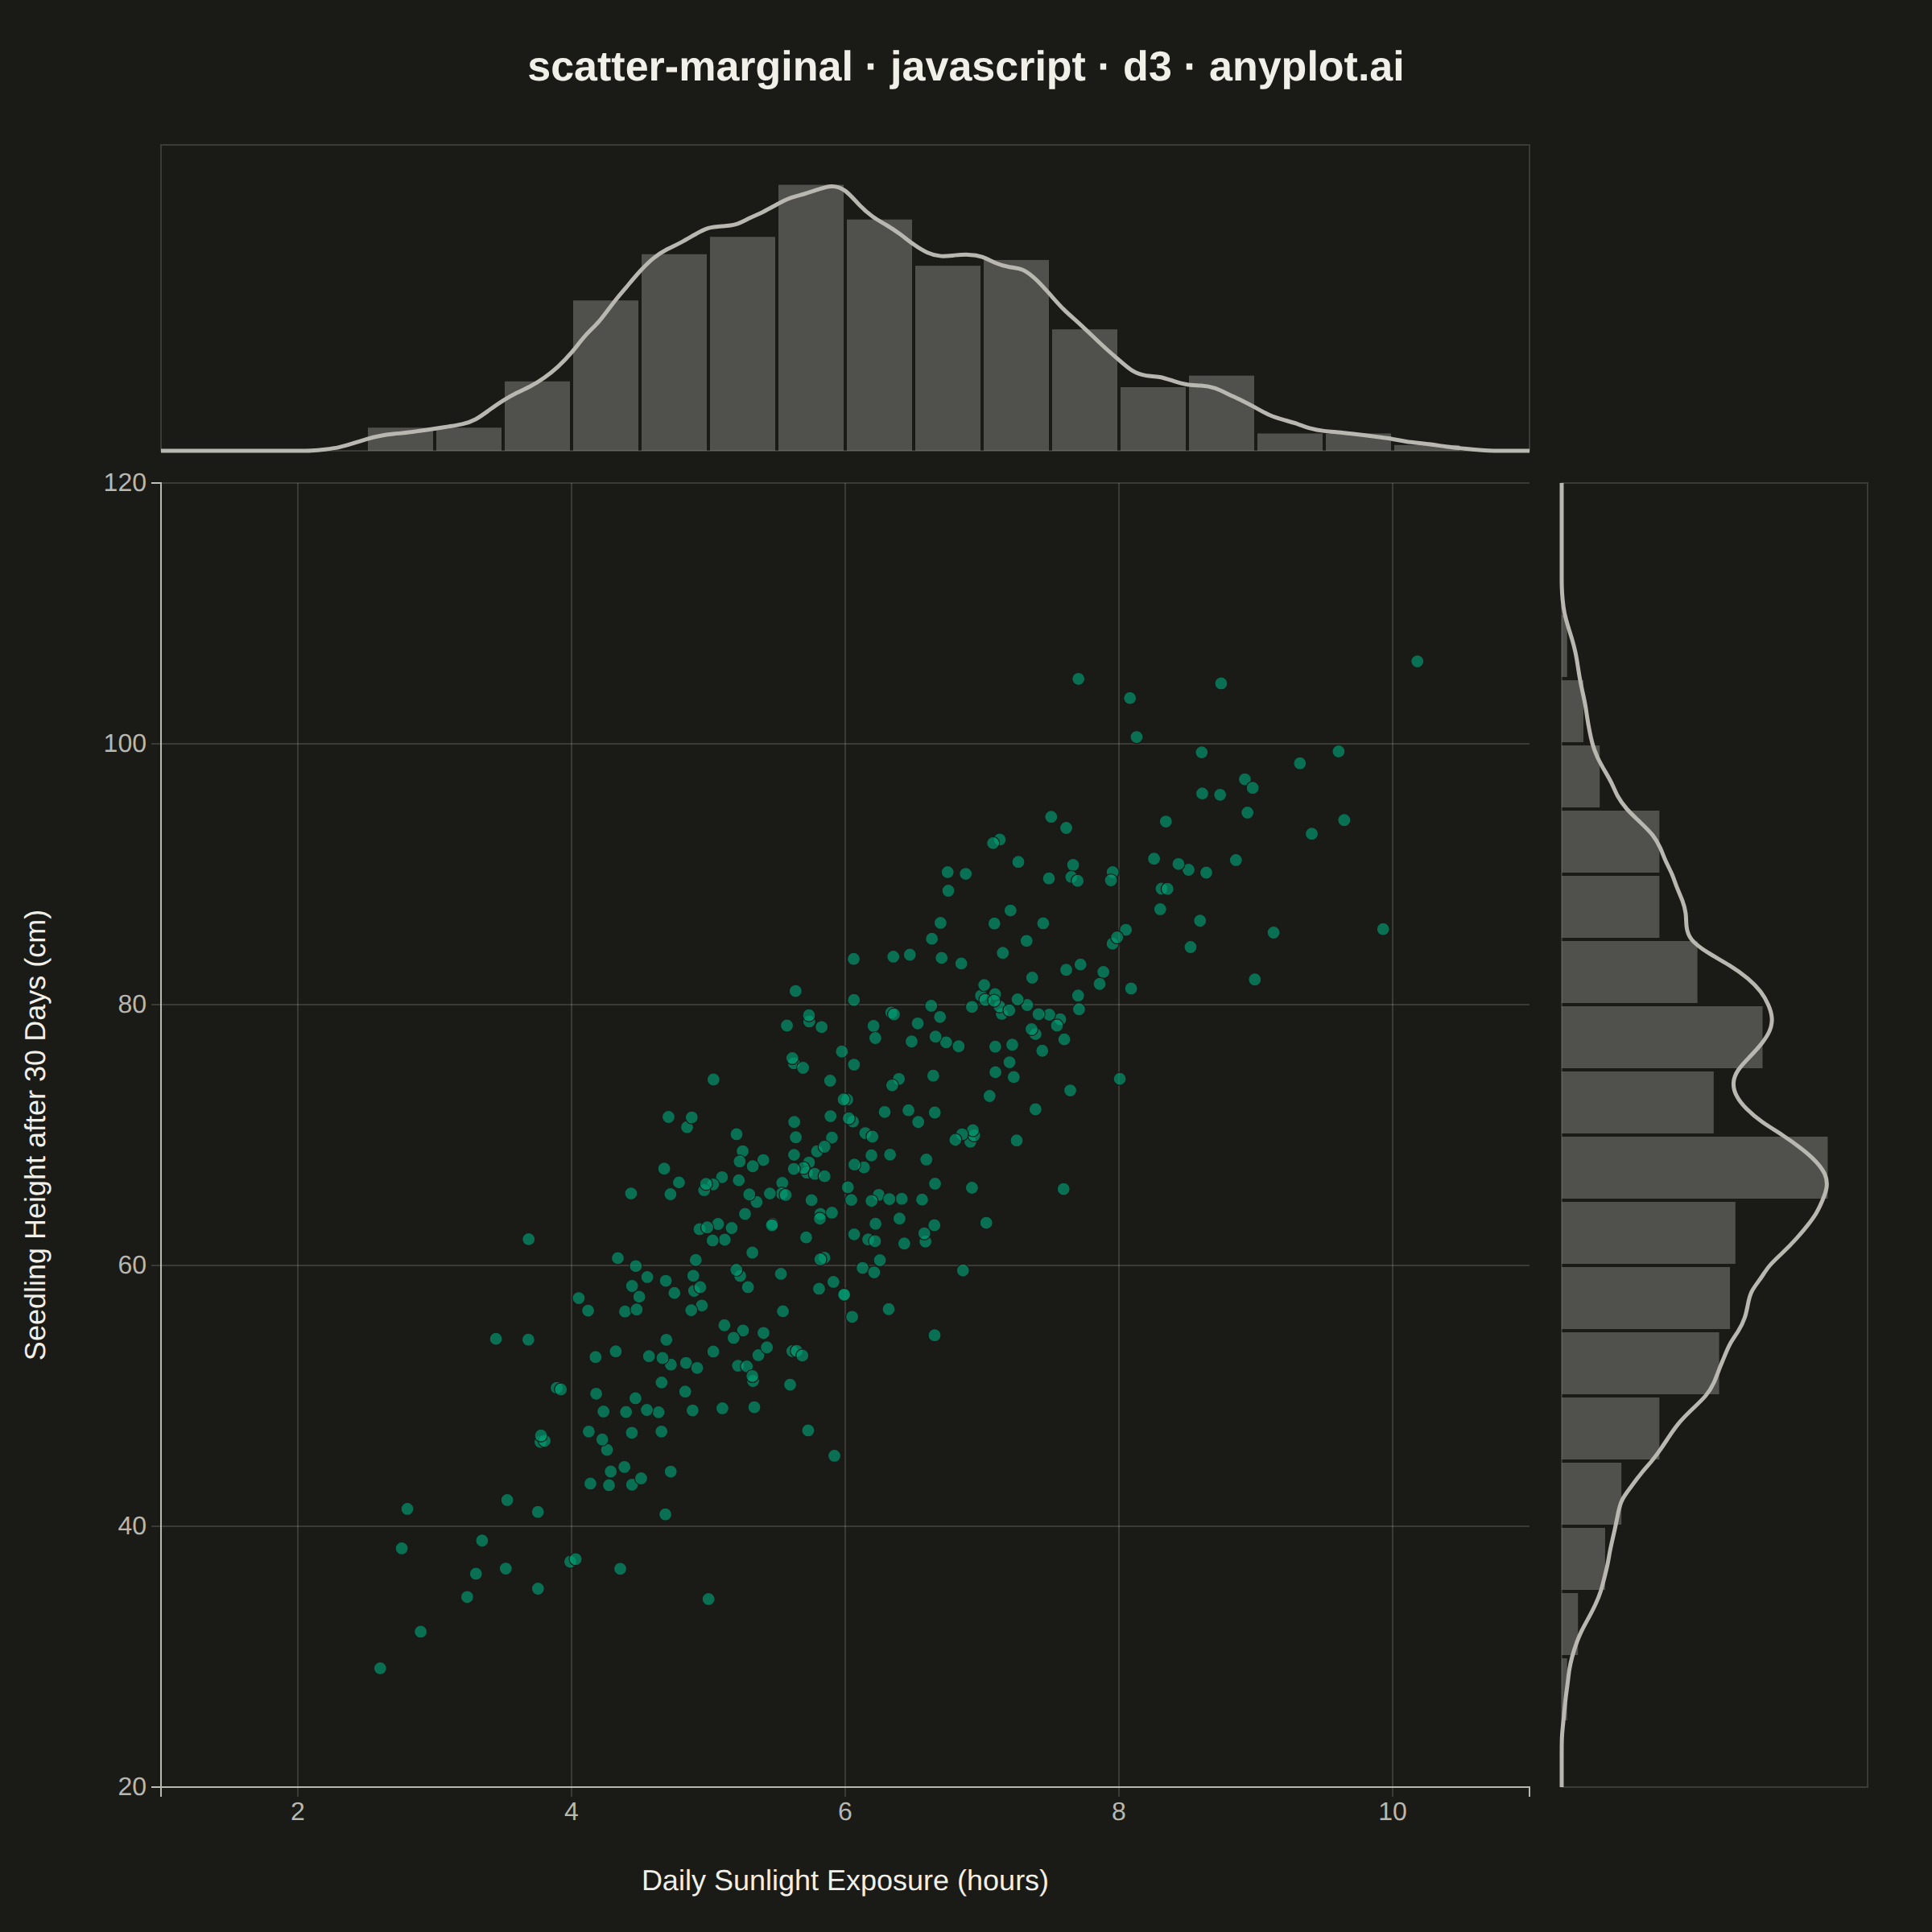
The same plot in 14 other libraries — JavaScript: Chart.js, Apache ECharts, Highcharts, MUI X Charts; Python: Altair, Bokeh, lets-plot, Matplotlib, Plotly, plotnine, Pygal, Seaborn; R: ggplot2; Julia: Makie.jl. Compare all 15 side by side: Scatter Plot with Marginal Distributions in Python, R, Julia and JavaScript.
A scatter plot enhanced with marginal distribution plots (histograms or kernel density estimates) on the top and right axes. This composite visualization simultaneously shows the bivariate relationship between two variables in the central scatter plot while displaying each variable's univariate distribution along its respective axis. It provides a comprehensive view of both the joint and marginal distributions in a single figure.
// anyplot.ai
// scatter-marginal: Scatter Plot with Marginal Distributions
// Library: d3 7.9.0 | JavaScript 22.23.2
// Quality: 89/100 | Created: 2026-09-09

//# anyplot-orientation: square

const t = window.ANYPLOT_TOKENS;
const { width, height } = window.ANYPLOT_SIZE;

// --- Data (in-memory, deterministic) ----------------------------------------
// mulberry32 PRNG + Box-Muller — the browser has no seeded RNG.
function mulberry32(seed) {
  return function () {
    seed |= 0;
    seed = (seed + 0x6d2b79f5) | 0;
    let v = Math.imul(seed ^ (seed >>> 15), 1 | seed);
    v = (v + Math.imul(v ^ (v >>> 7), 61 | v)) ^ v;
    return ((v ^ (v >>> 14)) >>> 0) / 4294967296;
  };
}
function randNormal(rng, mean, std) {
  const u1 = Math.max(rng(), 1e-9);
  const u2 = rng();
  const z = Math.sqrt(-2 * Math.log(u1)) * Math.cos(2 * Math.PI * u2);
  return mean + std * z;
}

const rng = mulberry32(42);
const n = 320;
const points = [];
for (let i = 0; i < n; i++) {
  const sunlight = Math.min(Math.max(randNormal(rng, 6, 1.5), 1), 11);
  const height_cm = Math.max(14 + 9 * sunlight + randNormal(rng, 0, 7.5), 4);
  points.push({ sunlight, height_cm });
}

// --- Layout -------------------------------------------------------------
const outerLeft = 100;
const outerRight = 40;
const outerTop = 90;
const outerBottom = 90;
const gap = 20;
const topPanelH = 190;
const rightPanelW = 190;

const availW = width - outerLeft - outerRight;
const availH = height - outerTop - outerBottom;
const mainW = availW - rightPanelW - gap;
const mainH = availH - topPanelH - gap;
const mainX = outerLeft;
const mainY = outerTop + topPanelH + gap;

// --- Scales -------------------------------------------------------------
const xExtent = d3.extent(points, (d) => d.sunlight);
const yExtent = d3.extent(points, (d) => d.height_cm);
const xPad = (xExtent[1] - xExtent[0]) * 0.08;
const yPad = (yExtent[1] - yExtent[0]) * 0.08;

const x = d3
  .scaleLinear()
  .domain([xExtent[0] - xPad, xExtent[1] + xPad])
  .range([0, mainW])
  .nice();
const y = d3
  .scaleLinear()
  .domain([yExtent[0] - yPad, yExtent[1] + yPad])
  .range([mainH, 0])
  .nice();

// --- Marginal histograms + KDE curves ------------------------------------
const xBins = d3.bin().domain(x.domain()).thresholds(24)(points.map((d) => d.sunlight));
const yBins = d3.bin().domain(y.domain()).thresholds(24)(points.map((d) => d.height_cm));
const xCountMax = d3.max(xBins, (d) => d.length) || 1;
const yCountMax = d3.max(yBins, (d) => d.length) || 1;

const topCountScale = d3.scaleLinear().domain([0, xCountMax * 1.15]).range([topPanelH, 0]);
const rightCountScale = d3.scaleLinear().domain([0, yCountMax * 1.15]).range([0, rightPanelW]);

function kernelEpanechnikov(bandwidth) {
  return (v) => {
    v /= bandwidth;
    return Math.abs(v) <= 1 ? (0.75 * (1 - v * v)) / bandwidth : 0;
  };
}
function kernelDensityEstimator(kernel, thresholds) {
  return (values) => thresholds.map((tv) => [tv, d3.mean(values, (v) => kernel(tv - v))]);
}

// Silverman's rule of thumb: bw = 1.06 * std * n^(-1/5) — a principled
// bandwidth selector rather than a fixed fraction of the domain.
function silvermanBandwidth(values) {
  const std = d3.deviation(values);
  return 1.06 * std * Math.pow(values.length, -1 / 5);
}
const sunlightValues = points.map((d) => d.sunlight);
const heightValues = points.map((d) => d.height_cm);
const bwX = silvermanBandwidth(sunlightValues);
const bwY = silvermanBandwidth(heightValues);
const densityX = kernelDensityEstimator(kernelEpanechnikov(bwX), x.ticks(80))(sunlightValues);
const densityY = kernelDensityEstimator(kernelEpanechnikov(bwY), y.ticks(80))(heightValues);

const topDensityScale = d3
  .scaleLinear()
  .domain([0, d3.max(densityX, (d) => d[1]) * 1.15])
  .range([topPanelH, 0]);
const rightDensityScale = d3
  .scaleLinear()
  .domain([0, d3.max(densityY, (d) => d[1]) * 1.15])
  .range([0, rightPanelW]);

const topLine = d3
  .line()
  .curve(d3.curveBasis)
  .x((d) => x(d[0]))
  .y((d) => topDensityScale(d[1]));
const rightLine = d3
  .line()
  .curve(d3.curveBasis)
  .x((d) => rightDensityScale(d[1]))
  .y((d) => y(d[0]));

// --- SVG mount ------------------------------------------------------------
const svg = d3.select("#container").append("svg").attr("width", width).attr("height", height);

// --- Main scatter -----------------------------------------------------------
const mainG = svg.append("g").attr("transform", `translate(${mainX},${mainY})`);

mainG
  .append("g")
  .selectAll("line")
  .data(x.ticks(7))
  .join("line")
  .attr("x1", (d) => x(d))
  .attr("x2", (d) => x(d))
  .attr("y1", 0)
  .attr("y2", mainH)
  .attr("stroke", t.grid);
mainG
  .append("g")
  .selectAll("line")
  .data(y.ticks(7))
  .join("line")
  .attr("y1", (d) => y(d))
  .attr("y2", (d) => y(d))
  .attr("x1", 0)
  .attr("x2", mainW)
  .attr("stroke", t.grid);

const xAxisG = mainG.append("g").attr("transform", `translate(0,${mainH})`).call(d3.axisBottom(x).ticks(7));
const yAxisG = mainG.append("g").call(d3.axisLeft(y).ticks(7));
for (const ax of [xAxisG, yAxisG]) {
  ax.selectAll("text").attr("fill", t.inkSoft).style("font-size", "16px");
  ax.selectAll("line").attr("stroke", t.grid);
  ax.select(".domain").attr("stroke", t.inkSoft);
}

mainG
  .append("g")
  .selectAll("circle")
  .data(points)
  .join("circle")
  .attr("cx", (d) => x(d.sunlight))
  .attr("cy", (d) => y(d.height_cm))
  .attr("r", 4)
  .attr("fill", t.palette[0])
  .attr("fill-opacity", 0.65)
  .attr("stroke", t.pageBg)
  .attr("stroke-width", 0.6);

mainG
  .append("text")
  .attr("x", mainW / 2)
  .attr("y", mainH + 64)
  .attr("text-anchor", "middle")
  .attr("fill", t.ink)
  .style("font-size", "18px")
  .text("Daily Sunlight Exposure (hours)");

mainG
  .append("text")
  .attr("transform", `translate(${-72},${mainH / 2}) rotate(-90)`)
  .attr("text-anchor", "middle")
  .attr("fill", t.ink)
  .style("font-size", "18px")
  .text("Seedling Height after 30 Days (cm)");

// --- Top marginal (x distribution) -------------------------------------
const topG = svg.append("g").attr("transform", `translate(${mainX},${outerTop})`);

topG
  .append("rect")
  .attr("class", "panel-frame")
  .attr("x", 0)
  .attr("y", 0)
  .attr("width", mainW)
  .attr("height", topPanelH)
  .attr("fill", "none")
  .attr("stroke", t.grid);

topG
  .selectAll("rect.bar")
  .data(xBins)
  .join("rect")
  .attr("class", "bar")
  .attr("x", (d) => x(d.x0) + 1)
  .attr("width", (d) => Math.max(0, x(d.x1) - x(d.x0) - 2))
  .attr("y", (d) => topCountScale(d.length))
  .attr("height", (d) => topPanelH - topCountScale(d.length))
  .attr("fill", t.inkSoft)
  .attr("fill-opacity", 0.35);

topG.append("path").datum(densityX).attr("fill", "none").attr("stroke", t.inkSoft).attr("stroke-width", 2.5).attr("d", topLine);

// --- Right marginal (y distribution) -------------------------------------
const rightG = svg.append("g").attr("transform", `translate(${mainX + mainW + gap},${mainY})`);

rightG
  .append("rect")
  .attr("class", "panel-frame")
  .attr("x", 0)
  .attr("y", 0)
  .attr("width", rightPanelW)
  .attr("height", mainH)
  .attr("fill", "none")
  .attr("stroke", t.grid);

rightG
  .selectAll("rect.bar")
  .data(yBins)
  .join("rect")
  .attr("class", "bar")
  .attr("x", 0)
  .attr("width", (d) => rightCountScale(d.length))
  .attr("y", (d) => y(d.x1) + 1)
  .attr("height", (d) => Math.max(0, y(d.x0) - y(d.x1) - 2))
  .attr("fill", t.inkSoft)
  .attr("fill-opacity", 0.35);

rightG
  .append("path")
  .datum(densityY)
  .attr("fill", "none")
  .attr("stroke", t.inkSoft)
  .attr("stroke-width", 2.5)
  .attr("d", rightLine);

// --- Title ------------------------------------------------------------------
svg
  .append("text")
  .attr("x", width / 2)
  .attr("y", 50)
  .attr("text-anchor", "middle")
  .attr("fill", t.ink)
  .style("font-size", "26px")
  .style("font-weight", "600")
  .text("scatter-marginal · javascript · d3 · anyplot.ai");
Runnable source as JSON, for any HTTP client: https://api.anyplot.ai/specs/scatter-marginal/d3/code. Any spec id and library id listed in llms-full.txt fit the same URL shape; every URL below is complete and callable.
{
  "spec_id": "scatter-marginal",
  "language": "javascript",
  "library": "d3",
  "page": "https://anyplot.ai/scatter-marginal/javascript/d3",
  "hub": "https://anyplot.ai/scatter-marginal",
  "code_json": "https://api.anyplot.ai/specs/scatter-marginal/d3/code",
  "spec_json": "https://api.anyplot.ai/specs/scatter-marginal",
  "render_light_png": "https://storage.googleapis.com/anyplot-images/plots/scatter-marginal/javascript/d3/plot-light.png",
  "render_dark_png": "https://storage.googleapis.com/anyplot-images/plots/scatter-marginal/javascript/d3/plot-dark.png",
  "interactive_light_html": "https://storage.googleapis.com/anyplot-images/plots/scatter-marginal/javascript/d3/plot-light.html",
  "interactive_dark_html": "https://storage.googleapis.com/anyplot-images/plots/scatter-marginal/javascript/d3/plot-dark.html",
  "quality_score": 89.0,
  "license": "MIT",
  "guide": "https://anyplot.ai/llms.txt"
}
Part of Scatter Plot with Marginal Distributions on anyplot.ai.