The same plot in 14 other libraries — JavaScript: D3.js, Apache ECharts, Highcharts, MUI X Charts; Python: Altair, Bokeh, lets-plot, Matplotlib, Plotly, plotnine, Pygal, Seaborn; R: ggplot2; Julia: Makie.jl. Compare all 15 side by side: Scatter Plot with Marginal Distributions in Python, R, Julia and JavaScript.
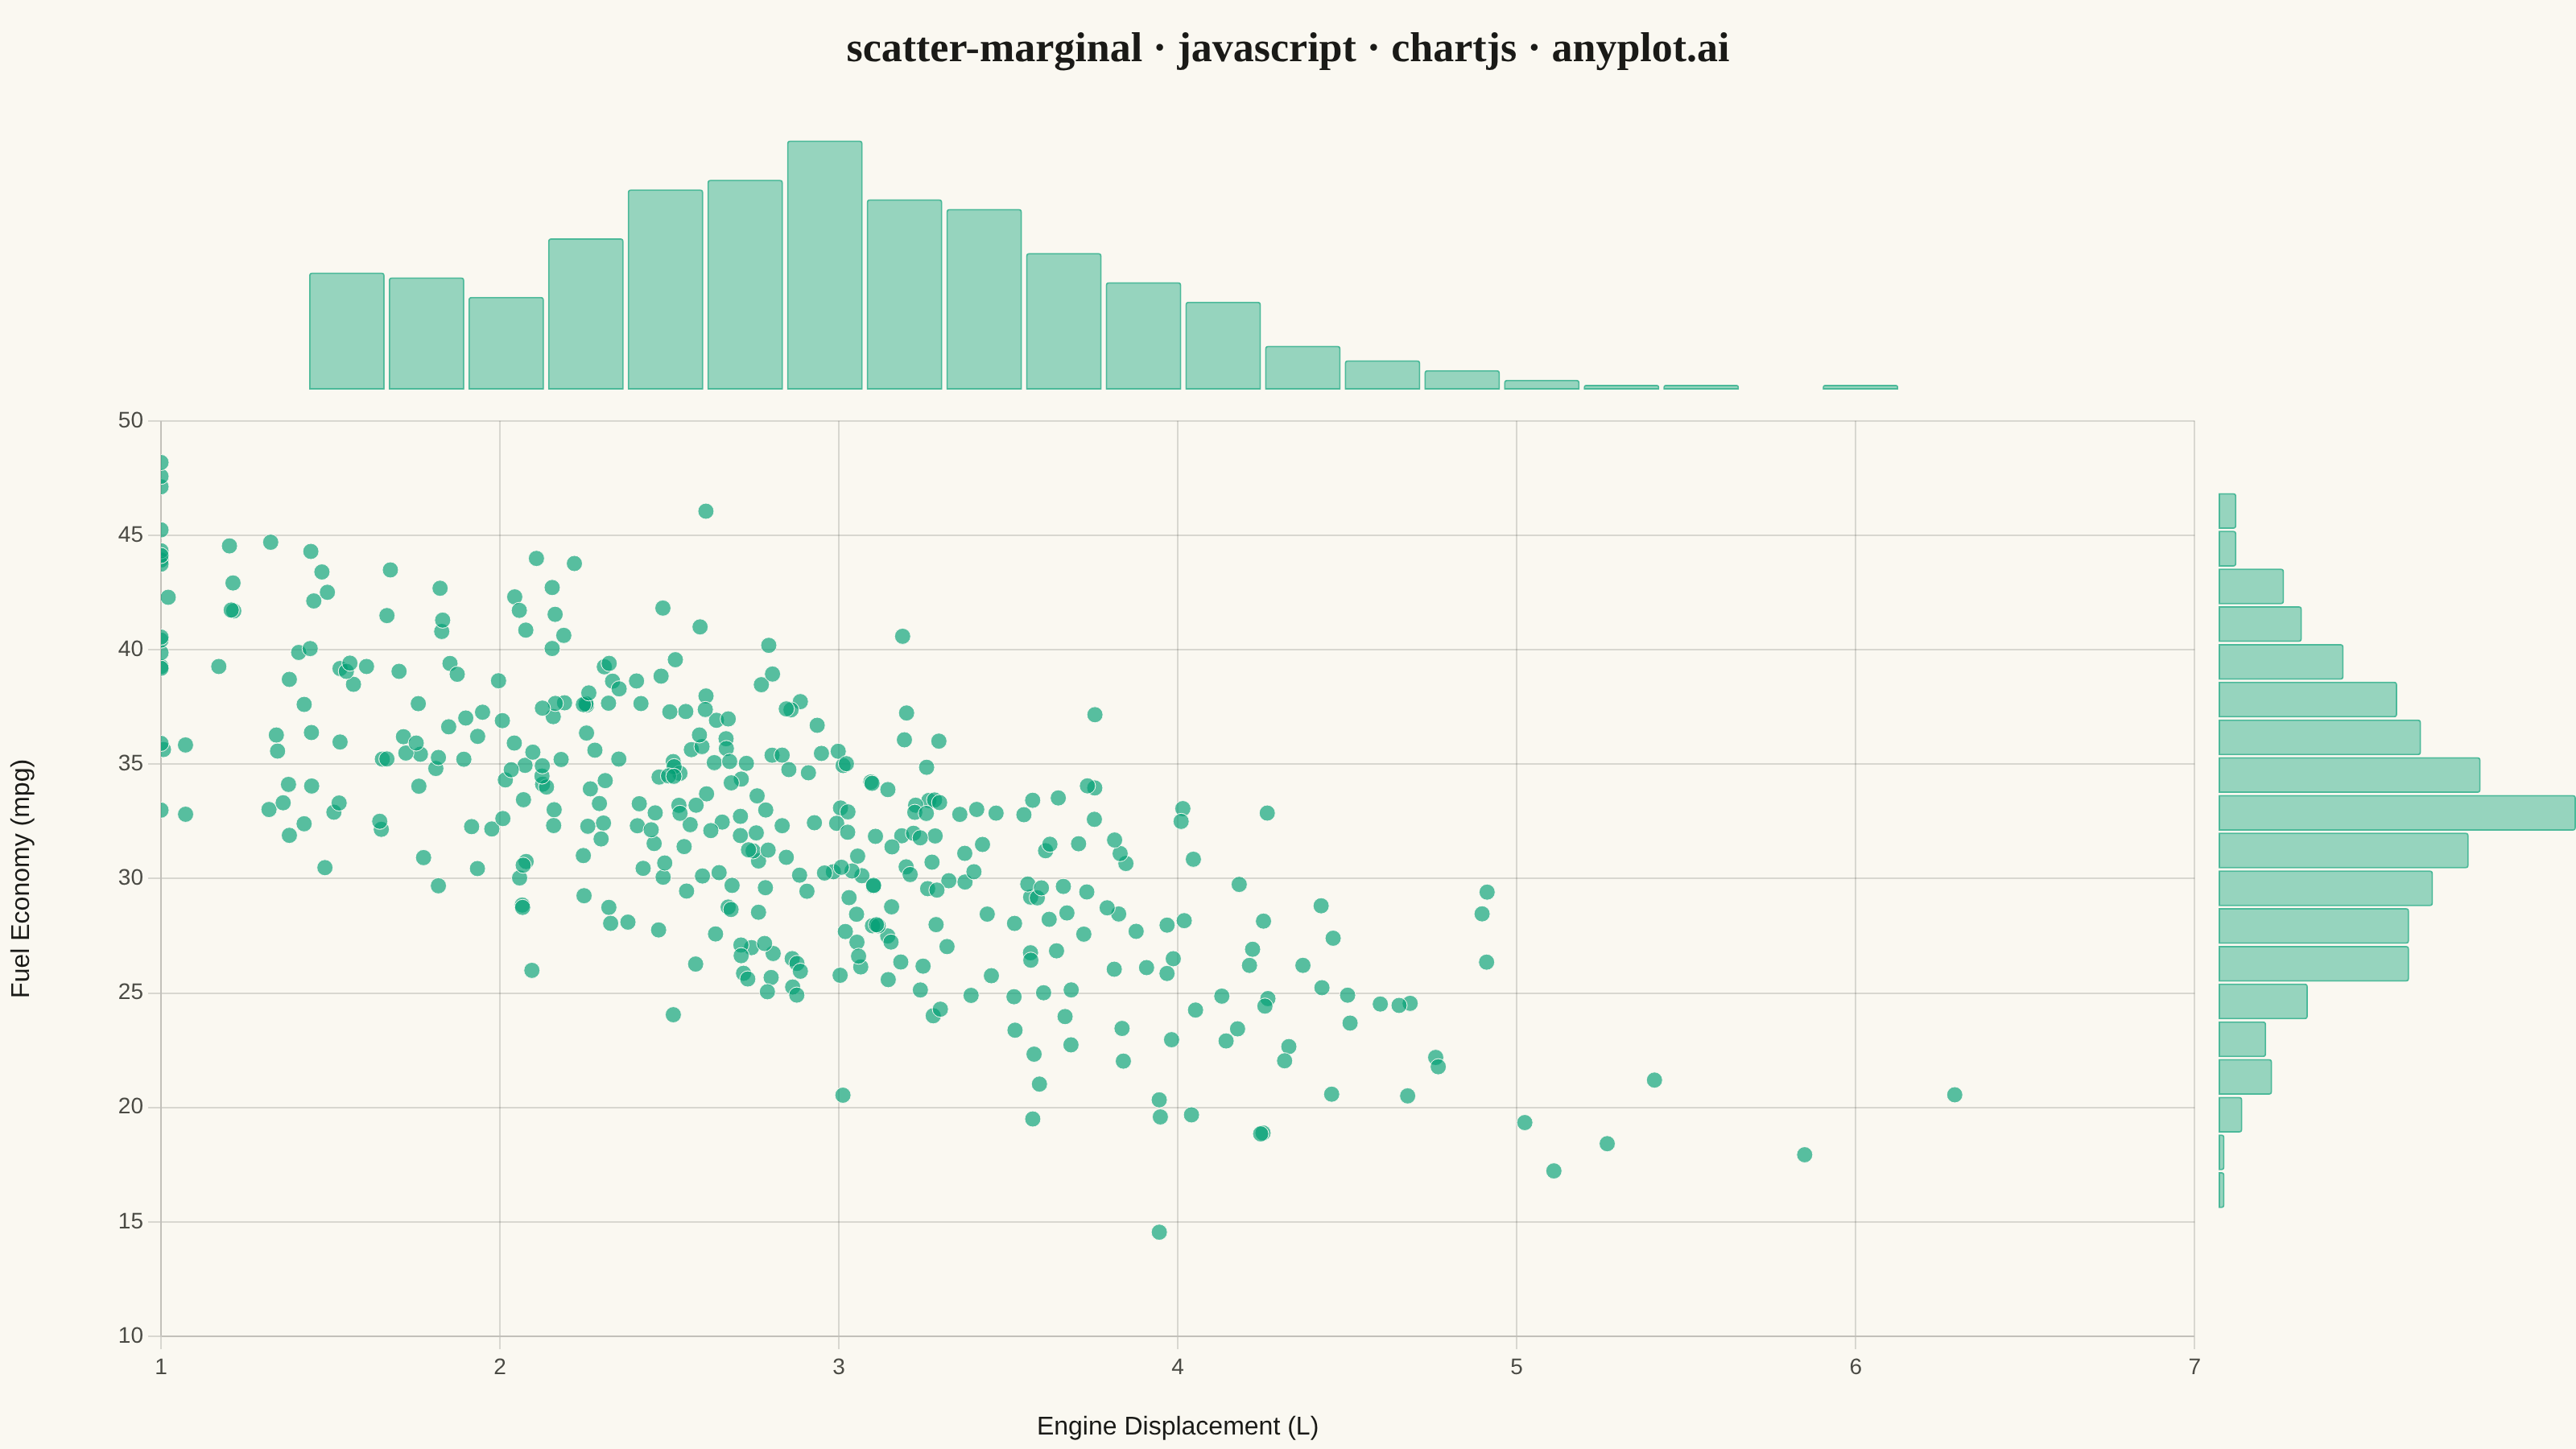
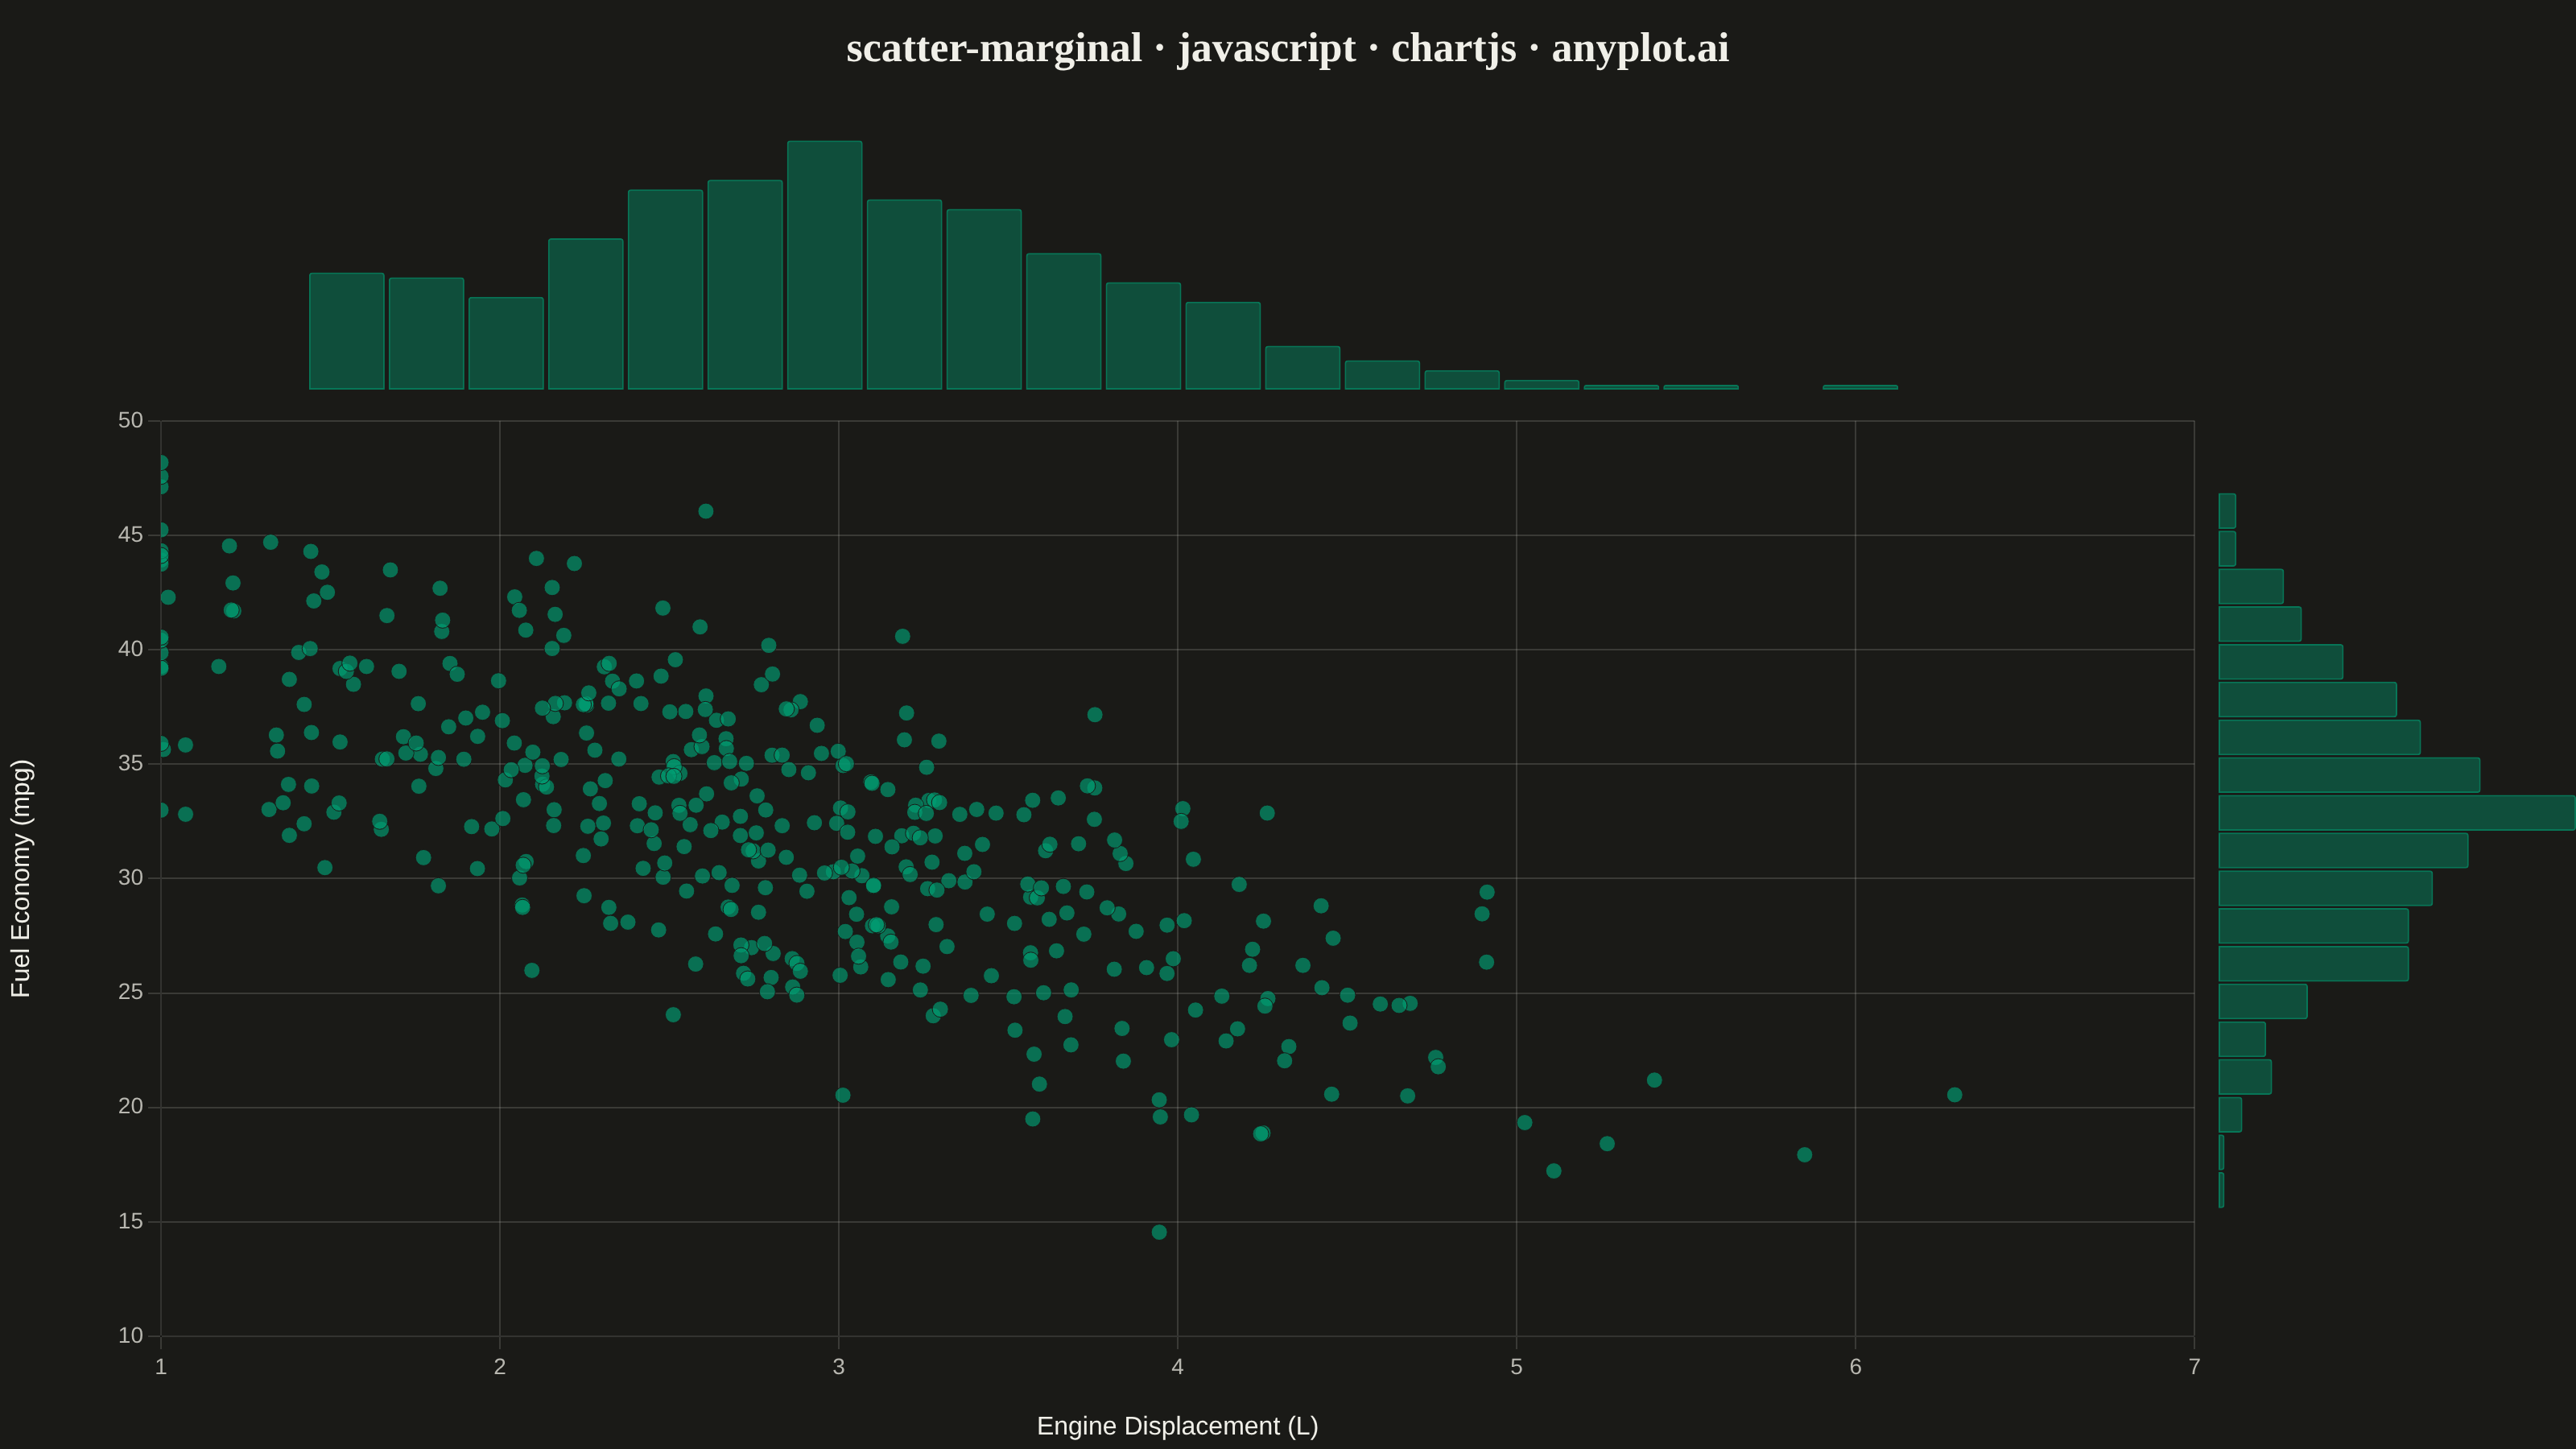
A scatter plot enhanced with marginal distribution plots (histograms or kernel density estimates) on the top and right axes. This composite visualization simultaneously shows the bivariate relationship between two variables in the central scatter plot while displaying each variable's univariate distribution along its respective axis. It provides a comprehensive view of both the joint and marginal distributions in a single figure.
// anyplot.ai
// scatter-marginal: Scatter Plot with Marginal Distributions
// Library: chartjs 4.4.7 | JavaScript 22.23.2
// Quality: 85/100 | Created: 2026-09-09

const t = window.ANYPLOT_TOKENS;

// --- Data (in-memory, deterministic LCG + Box-Muller) -----------------------
let seed = 42;
function lcgRandom() {
  seed = (seed * 1664525 + 1013904223) % 4294967296;
  return seed / 4294967296;
}
function randn() {
  const u1 = Math.max(lcgRandom(), 1e-9);
  const u2 = lcgRandom();
  return Math.sqrt(-2 * Math.log(u1)) * Math.cos(2 * Math.PI * u2);
}

const N = 400;
const RHO = -0.72;
const displacement = [];
const fuelEconomy = [];
for (let i = 0; i < N; i++) {
  const z1 = randn();
  const z2 = randn();
  const zy = RHO * z1 + Math.sqrt(1 - RHO * RHO) * z2;
  displacement.push(Math.max(1.0, 2.8 + z1 * 1.0));
  fuelEconomy.push(Math.max(10, 32 + zy * 6.5));
}
const points = displacement.map((x, i) => ({ x, y: fuelEconomy[i] }));

// "Nice number" axis rounding (Heckbert's algorithm) so the outer scale bounds
// land on round values (e.g. 1.0, 6.5) instead of the raw, jagged data extent.
function niceNum(range, round) {
  const exponent = Math.floor(Math.log10(range));
  const fraction = range / Math.pow(10, exponent);
  let niceFraction;
  if (round) {
    if (fraction < 1.5) niceFraction = 1;
    else if (fraction < 3) niceFraction = 2;
    else if (fraction < 7) niceFraction = 5;
    else niceFraction = 10;
  } else if (fraction <= 1) {
    niceFraction = 1;
  } else if (fraction <= 2) {
    niceFraction = 2;
  } else if (fraction <= 5) {
    niceFraction = 5;
  } else {
    niceFraction = 10;
  }
  return niceFraction * Math.pow(10, exponent);
}

function niceDomain(min, max, targetTicks = 8) {
  const step = niceNum(niceNum(max - min, false) / (targetTicks - 1), true);
  return { min: Math.floor(min / step) * step, max: Math.ceil(max / step) * step };
}

function histogram(data, binCount, domainMin, domainMax) {
  const binWidth = (domainMax - domainMin) / binCount;
  const counts = new Array(binCount).fill(0);
  data.forEach((value) => {
    let idx = Math.floor((value - domainMin) / binWidth);
    idx = Math.min(Math.max(idx, 0), binCount - 1);
    counts[idx]++;
  });
  const centers = counts.map((_, i) => domainMin + (i + 0.5) * binWidth);
  return { counts, centers };
}

const BIN_COUNT = 22;
const xDomain = niceDomain(Math.min(...displacement), Math.max(...displacement));
const yDomain = niceDomain(Math.min(...fuelEconomy), Math.max(...fuelEconomy));
const xHist = histogram(displacement, BIN_COUNT, xDomain.min, xDomain.max);
const yHist = histogram(fuelEconomy, BIN_COUNT, yDomain.min, yDomain.max);

function hexToRgba(hex, alpha) {
  const r = parseInt(hex.slice(1, 3), 16);
  const g = parseInt(hex.slice(3, 5), 16);
  const b = parseInt(hex.slice(5, 7), 16);
  return `rgba(${r}, ${g}, ${b}, ${alpha})`;
}

const BRAND = t.palette[0];
const MARGINAL_COLOR = hexToRgba(BRAND, 0.4);
const MARGINAL_BORDER = hexToRgba(BRAND, 0.7);

// Chart.js linear scales always force a tick at the exact min/max, which can
// crowd the neighbouring "nice" step tick when min/max don't land on a round
// number. Drop a boundary tick that sits too close to its neighbour.
function pruneBoundaryTicks(scale) {
  const ticks = scale.ticks;
  if (ticks.length < 3) return;
  const threshold = (scale.max - scale.min) * 0.04;
  if (ticks[1].value - ticks[0].value < threshold) ticks.shift();
  if (ticks[ticks.length - 1].value - ticks[ticks.length - 2].value < threshold) ticks.pop();
}

// --- Layout ------------------------------------------------------------------
// Fixed reserves (CSS px) shared between the main chart and the hidden axes of
// the marginal charts, so the plot areas line up pixel-for-pixel.
const Y_AXIS_RESERVE = 100; // main y-axis (ticks + title) width
const X_AXIS_RESERVE = 70; // main x-axis (ticks + title) height
const TOP_MARGINAL_SIZE = 190;
const RIGHT_MARGINAL_SIZE = 230;
const TITLE_SIZE = 60;

const container = document.getElementById("container");
container.style.display = "grid";
container.style.gridTemplateColumns = `1fr ${RIGHT_MARGINAL_SIZE}px`;
container.style.gridTemplateRows = `${TITLE_SIZE}px ${TOP_MARGINAL_SIZE}px 1fr`;
container.style.fontFamily = "inherit";

const titleCell = document.createElement("div");
titleCell.style.gridColumn = "1 / span 2";
titleCell.style.display = "flex";
titleCell.style.alignItems = "center";
titleCell.style.justifyContent = "center";
titleCell.style.color = t.ink;
titleCell.style.fontSize = "26px";
titleCell.style.fontWeight = "600";
titleCell.textContent = "scatter-marginal · javascript · chartjs · anyplot.ai";
container.appendChild(titleCell);

const topCell = document.createElement("div");
const cornerCell = document.createElement("div");
const mainCell = document.createElement("div");
const rightCell = document.createElement("div");
[topCell, mainCell, cornerCell, rightCell].forEach((cell) => {
  cell.style.position = "relative";
  cell.style.width = "100%";
  cell.style.height = "100%";
});
container.appendChild(topCell);
container.appendChild(cornerCell);
container.appendChild(mainCell);
container.appendChild(rightCell);

function makeCanvas(cell) {
  const canvas = document.createElement("canvas");
  cell.appendChild(canvas);
  return canvas;
}

// --- Main scatter --------------------------------------------------------
new Chart(makeCanvas(mainCell), {
  type: "scatter",
  data: {
    datasets: [
      {
        label: "Vehicles",
        data: points,
        backgroundColor: hexToRgba(BRAND, 0.65),
        borderColor: t.pageBg,
        borderWidth: 0.5,
        radius: 5,
        hoverRadius: 6,
      },
    ],
  },
  options: {
    responsive: true,
    maintainAspectRatio: false,
    animation: false,
    plugins: { legend: { display: false } },
    scales: {
      x: {
        type: "linear",
        min: xDomain.min,
        max: xDomain.max,
        title: { display: true, text: "Engine Displacement (L)", color: t.ink, font: { size: 16 } },
        ticks: { color: t.inkSoft, font: { size: 14 } },
        grid: { color: t.grid },
        afterBuildTicks: pruneBoundaryTicks,
        afterFit: (scale) => {
          scale.height = X_AXIS_RESERVE;
        },
      },
      y: {
        type: "linear",
        min: yDomain.min,
        max: yDomain.max,
        title: { display: true, text: "Fuel Economy (mpg)", color: t.ink, font: { size: 16 } },
        ticks: { color: t.inkSoft, font: { size: 14 } },
        grid: { color: t.grid },
        afterBuildTicks: pruneBoundaryTicks,
        afterFit: (scale) => {
          scale.width = Y_AXIS_RESERVE;
        },
      },
    },
  },
});

// --- Top marginal: distribution of x (Engine Displacement) -----------------
new Chart(makeCanvas(topCell), {
  type: "bar",
  data: {
    datasets: [
      {
        data: xHist.centers.map((center, i) => ({ x: center, y: xHist.counts[i] })),
        backgroundColor: MARGINAL_COLOR,
        borderColor: MARGINAL_BORDER,
        borderWidth: 1,
        borderRadius: { topLeft: 2, topRight: 2 },
        borderSkipped: false,
        barPercentage: 1.0,
        categoryPercentage: 0.95,
      },
    ],
  },
  options: {
    responsive: true,
    maintainAspectRatio: false,
    animation: false,
    plugins: { legend: { display: false } },
    scales: {
      x: {
        type: "linear",
        min: xDomain.min,
        max: xDomain.max,
        display: true,
        ticks: { display: false },
        grid: { display: false },
        border: { display: false },
      },
      y: {
        type: "linear",
        beginAtZero: true,
        display: true,
        ticks: { display: false },
        grid: { display: false },
        border: { display: false },
        afterFit: (scale) => {
          scale.width = Y_AXIS_RESERVE;
        },
      },
    },
  },
});

// --- Right marginal: distribution of y (Fuel Economy) -----------------------
new Chart(makeCanvas(rightCell), {
  type: "bar",
  data: {
    datasets: [
      {
        data: yHist.centers.map((center, i) => ({ x: yHist.counts[i], y: center })),
        backgroundColor: MARGINAL_COLOR,
        borderColor: MARGINAL_BORDER,
        borderWidth: 1,
        borderRadius: { topRight: 2, bottomRight: 2 },
        borderSkipped: false,
        barPercentage: 1.0,
        categoryPercentage: 0.95,
      },
    ],
  },
  options: {
    indexAxis: "y",
    responsive: true,
    maintainAspectRatio: false,
    animation: false,
    plugins: { legend: { display: false } },
    scales: {
      x: {
        type: "linear",
        beginAtZero: true,
        display: true,
        ticks: { display: false },
        grid: { display: false },
        border: { display: false },
        afterFit: (scale) => {
          scale.height = X_AXIS_RESERVE;
        },
      },
      y: {
        type: "linear",
        min: yDomain.min,
        max: yDomain.max,
        display: true,
        ticks: { display: false },
        grid: { display: false },
        border: { display: false },
      },
    },
  },
});
Runnable source as JSON, for any HTTP client: https://api.anyplot.ai/specs/scatter-marginal/chartjs/code. Any spec id and library id listed in llms-full.txt fit the same URL shape; every URL below is complete and callable.
{
  "spec_id": "scatter-marginal",
  "language": "javascript",
  "library": "chartjs",
  "page": "https://anyplot.ai/scatter-marginal/javascript/chartjs",
  "hub": "https://anyplot.ai/scatter-marginal",
  "code_json": "https://api.anyplot.ai/specs/scatter-marginal/chartjs/code",
  "spec_json": "https://api.anyplot.ai/specs/scatter-marginal",
  "render_light_png": "https://storage.googleapis.com/anyplot-images/plots/scatter-marginal/javascript/chartjs/plot-light.png",
  "render_dark_png": "https://storage.googleapis.com/anyplot-images/plots/scatter-marginal/javascript/chartjs/plot-dark.png",
  "interactive_light_html": "https://storage.googleapis.com/anyplot-images/plots/scatter-marginal/javascript/chartjs/plot-light.html",
  "interactive_dark_html": "https://storage.googleapis.com/anyplot-images/plots/scatter-marginal/javascript/chartjs/plot-dark.html",
  "quality_score": 85.0,
  "license": "MIT",
  "guide": "https://anyplot.ai/llms.txt"
}
Part of Scatter Plot with Marginal Distributions on anyplot.ai.