The same plot in 14 other libraries — Python: Altair, Bokeh, lets-plot, Matplotlib, Plotly, plotnine, Pygal, Seaborn; R: ggplot2; JavaScript: Chart.js, D3.js, Apache ECharts, Highcharts, MUI X Charts. Compare all 15 side by side: Scatter Plot with Marginal Distributions in Python, R, Julia and JavaScript.
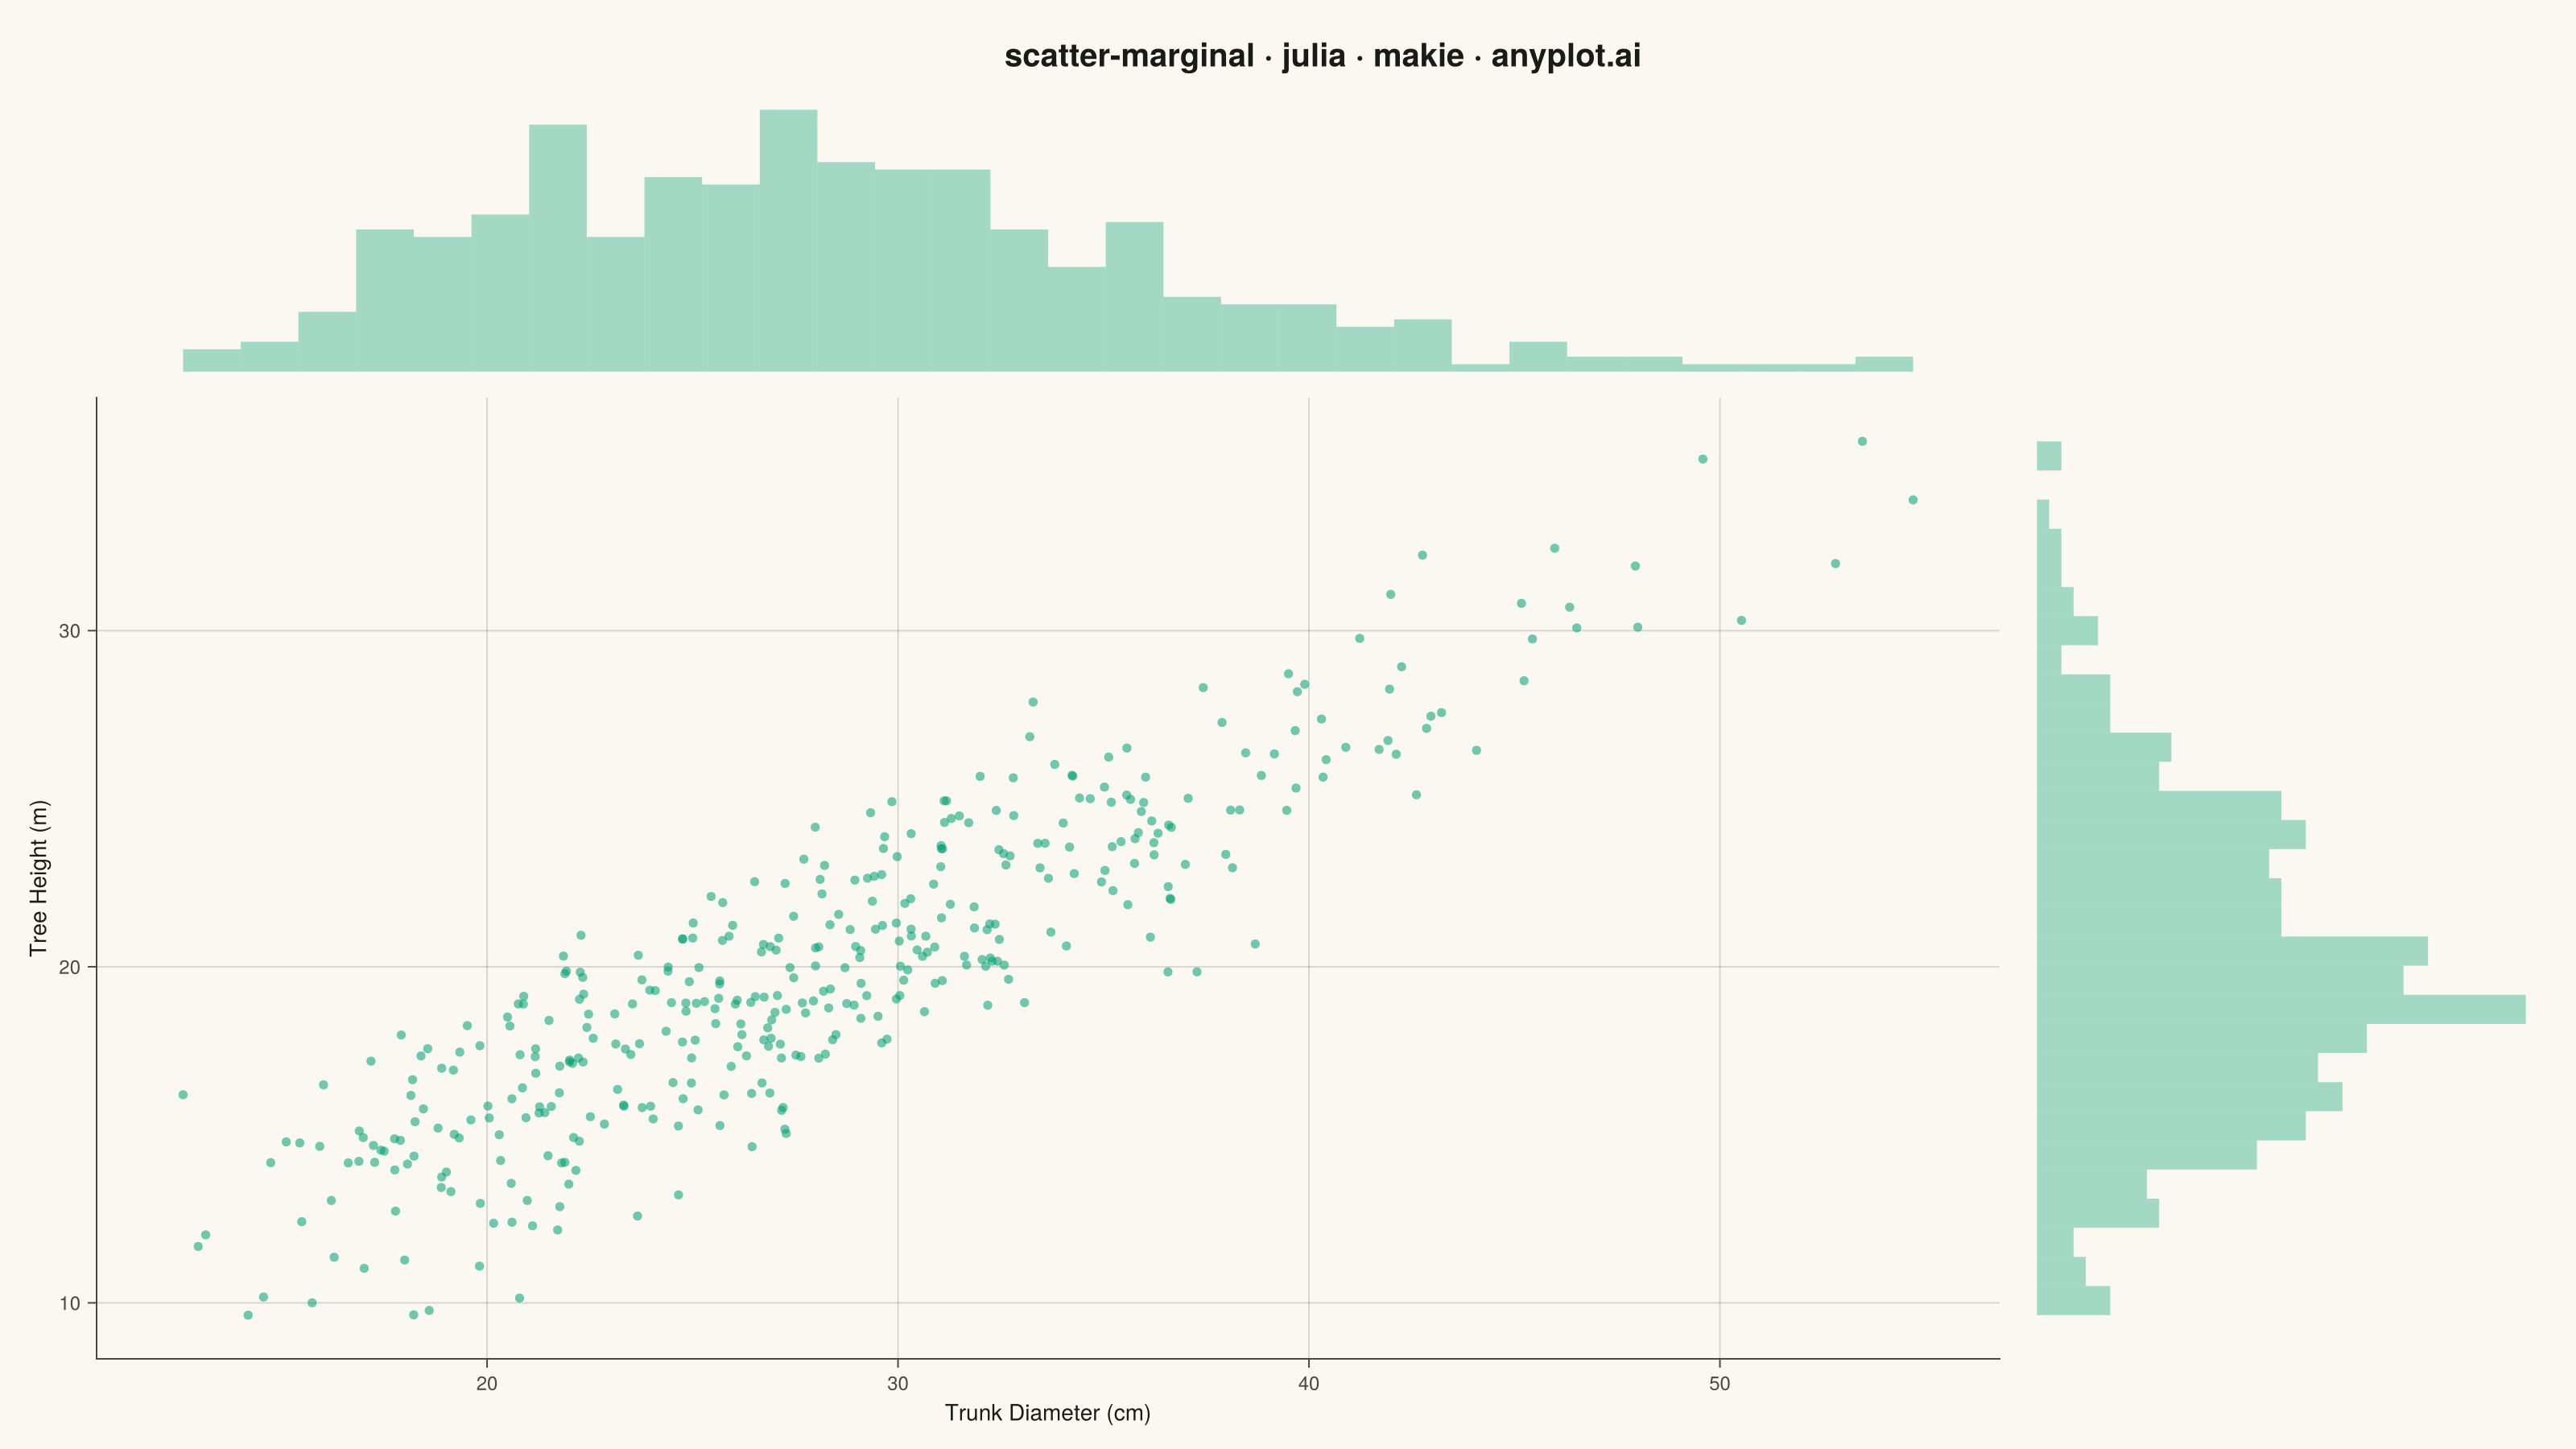
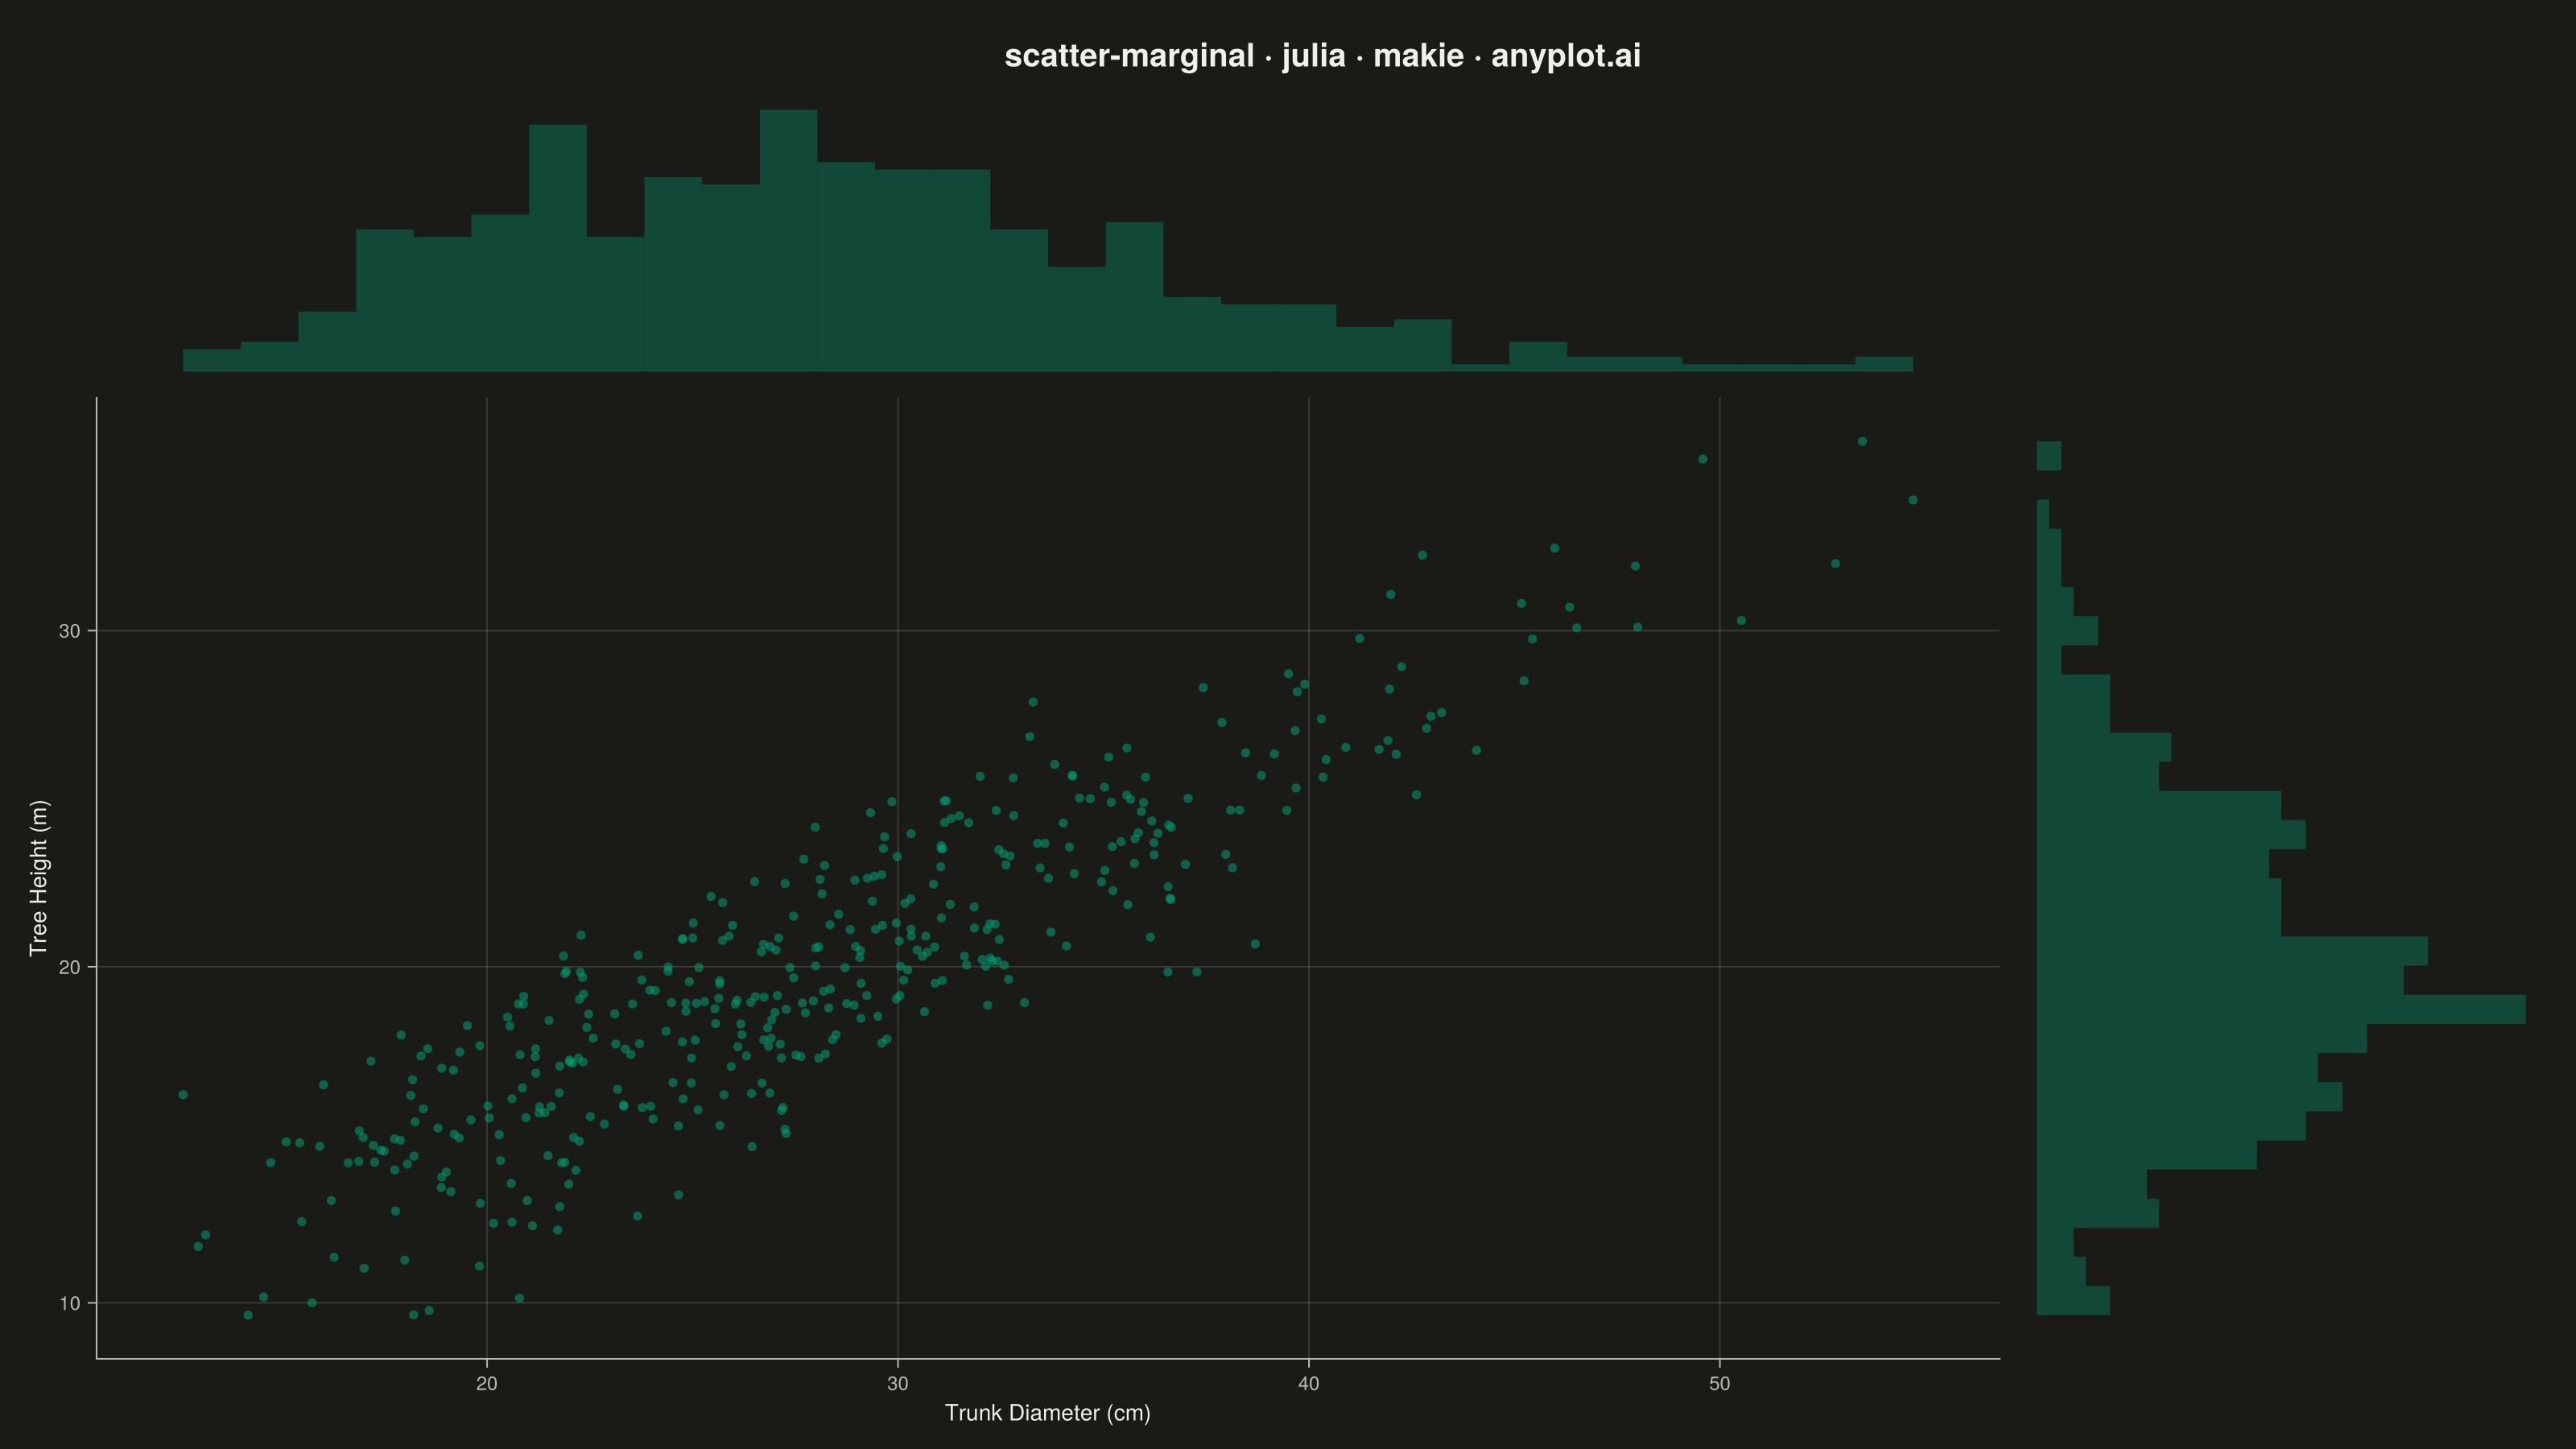
A scatter plot enhanced with marginal distribution plots (histograms or kernel density estimates) on the top and right axes. This composite visualization simultaneously shows the bivariate relationship between two variables in the central scatter plot while displaying each variable's univariate distribution along its respective axis. It provides a comprehensive view of both the joint and marginal distributions in a single figure.
# anyplot.ai
# scatter-marginal: Scatter Plot with Marginal Distributions
# Library: makie 0.21.9 | Julia 1.11.9
# Quality: 90/100 | Created: 2026-09-09

using CairoMakie
using Colors
using Random

Random.seed!(42)

# --- Theme tokens ------------------------------------------------------------
const THEME    = get(ENV, "ANYPLOT_THEME", "light")
const PAGE_BG  = THEME == "light" ? colorant"#FAF8F1" : colorant"#1A1A17"
const INK      = THEME == "light" ? colorant"#1A1A17" : colorant"#F0EFE8"
const INK_SOFT = THEME == "light" ? colorant"#4A4A44" : colorant"#B8B7B0"

const IMPRINT_PALETTE = [
    colorant"#009E73", colorant"#C475FD", colorant"#4467A3", colorant"#BD8233",
    colorant"#AE3030", colorant"#2ABCCD", colorant"#954477", colorant"#99B314",
]
const BRAND = IMPRINT_PALETTE[1]

# --- Data ---------------------------------------------------------------------
# Forestry measurements: trunk diameter (right-skewed, small trees are common,
# large ones rarer) and the resulting tree height, correlated with diameter.
n = 400
trunk_diameter_cm = 28.0 .* exp.(0.28 .* randn(n))
tree_height_m = 4.5 .+ 0.55 .* trunk_diameter_cm .+ 2.2 .* randn(n)

# --- Plot ----------------------------------------------------------------------
title_str = "scatter-marginal · julia · makie · anyplot.ai"

fig = Figure(
    resolution      = (1600, 900),
    fontsize        = 14,
    backgroundcolor = PAGE_BG,
)

main_ax = Axis(
    fig[3, 1];
    xlabel            = "Trunk Diameter (cm)",
    ylabel            = "Tree Height (m)",
    xlabelcolor       = INK,
    ylabelcolor       = INK,
    xticklabelcolor   = INK_SOFT,
    yticklabelcolor   = INK_SOFT,
    xtickcolor        = INK_SOFT,
    ytickcolor        = INK_SOFT,
    xlabelsize        = 14,
    ylabelsize        = 14,
    xticklabelsize    = 12,
    yticklabelsize    = 12,
    backgroundcolor   = PAGE_BG,
    topspinevisible   = false,
    rightspinevisible = false,
    leftspinecolor    = INK_SOFT,
    bottomspinecolor  = INK_SOFT,
    xgridcolor        = RGBAf(INK.r, INK.g, INK.b, 0.15),
    ygridcolor        = RGBAf(INK.r, INK.g, INK.b, 0.15),
    xminorgridvisible = false,
    yminorgridvisible = false,
)

top_ax = Axis(
    fig[2, 1];
    backgroundcolor = PAGE_BG,
)

right_ax = Axis(
    fig[3, 2];
    backgroundcolor = PAGE_BG,
)

Label(
    fig[1, 1:2], title_str;
    fontsize = 20, color = INK, font = :bold,
)

linkxaxes!(main_ax, top_ax)
linkyaxes!(main_ax, right_ax)

rowsize!(fig.layout, 1, Fixed(36))
rowsize!(fig.layout, 2, Relative(0.22))
colsize!(fig.layout, 2, Relative(0.22))
rowgap!(fig.layout, 8)
colgap!(fig.layout, 8)

scatter!(
    main_ax, trunk_diameter_cm, tree_height_m;
    color = (BRAND, 0.55), markersize = 8, strokewidth = 0,
)

hist!(top_ax, trunk_diameter_cm; bins = 30, color = (BRAND, 0.35), strokewidth = 0)
hist!(right_ax, tree_height_m; bins = 30, direction = :x, color = (BRAND, 0.35), strokewidth = 0)

hidedecorations!(top_ax)
hidedecorations!(right_ax)
hidespines!(top_ax)
hidespines!(right_ax)

# --- Save -----------------------------------------------------------------------
save("plot-$(THEME).png", fig; px_per_unit = 2)
Runnable source as JSON, for any HTTP client: https://api.anyplot.ai/specs/scatter-marginal/makie/code. Any spec id and library id listed in llms-full.txt fit the same URL shape; every URL below is complete and callable.
{
  "spec_id": "scatter-marginal",
  "language": "julia",
  "library": "makie",
  "page": "https://anyplot.ai/scatter-marginal/julia/makie",
  "hub": "https://anyplot.ai/scatter-marginal",
  "code_json": "https://api.anyplot.ai/specs/scatter-marginal/makie/code",
  "spec_json": "https://api.anyplot.ai/specs/scatter-marginal",
  "render_light_png": "https://storage.googleapis.com/anyplot-images/plots/scatter-marginal/julia/makie/plot-light.png",
  "render_dark_png": "https://storage.googleapis.com/anyplot-images/plots/scatter-marginal/julia/makie/plot-dark.png",
  "quality_score": 90.0,
  "license": "MIT",
  "guide": "https://anyplot.ai/llms.txt"
}
Part of Scatter Plot with Marginal Distributions on anyplot.ai.