The same plot in 14 other libraries — JavaScript: Chart.js, D3.js, Apache ECharts, Highcharts; Python: Altair, Bokeh, lets-plot, Matplotlib, Plotly, plotnine, Pygal, Seaborn; R: ggplot2; Julia: Makie.jl. Compare all 15 side by side: Scatter Plot with Marginal Distributions in Python, R, Julia and JavaScript.
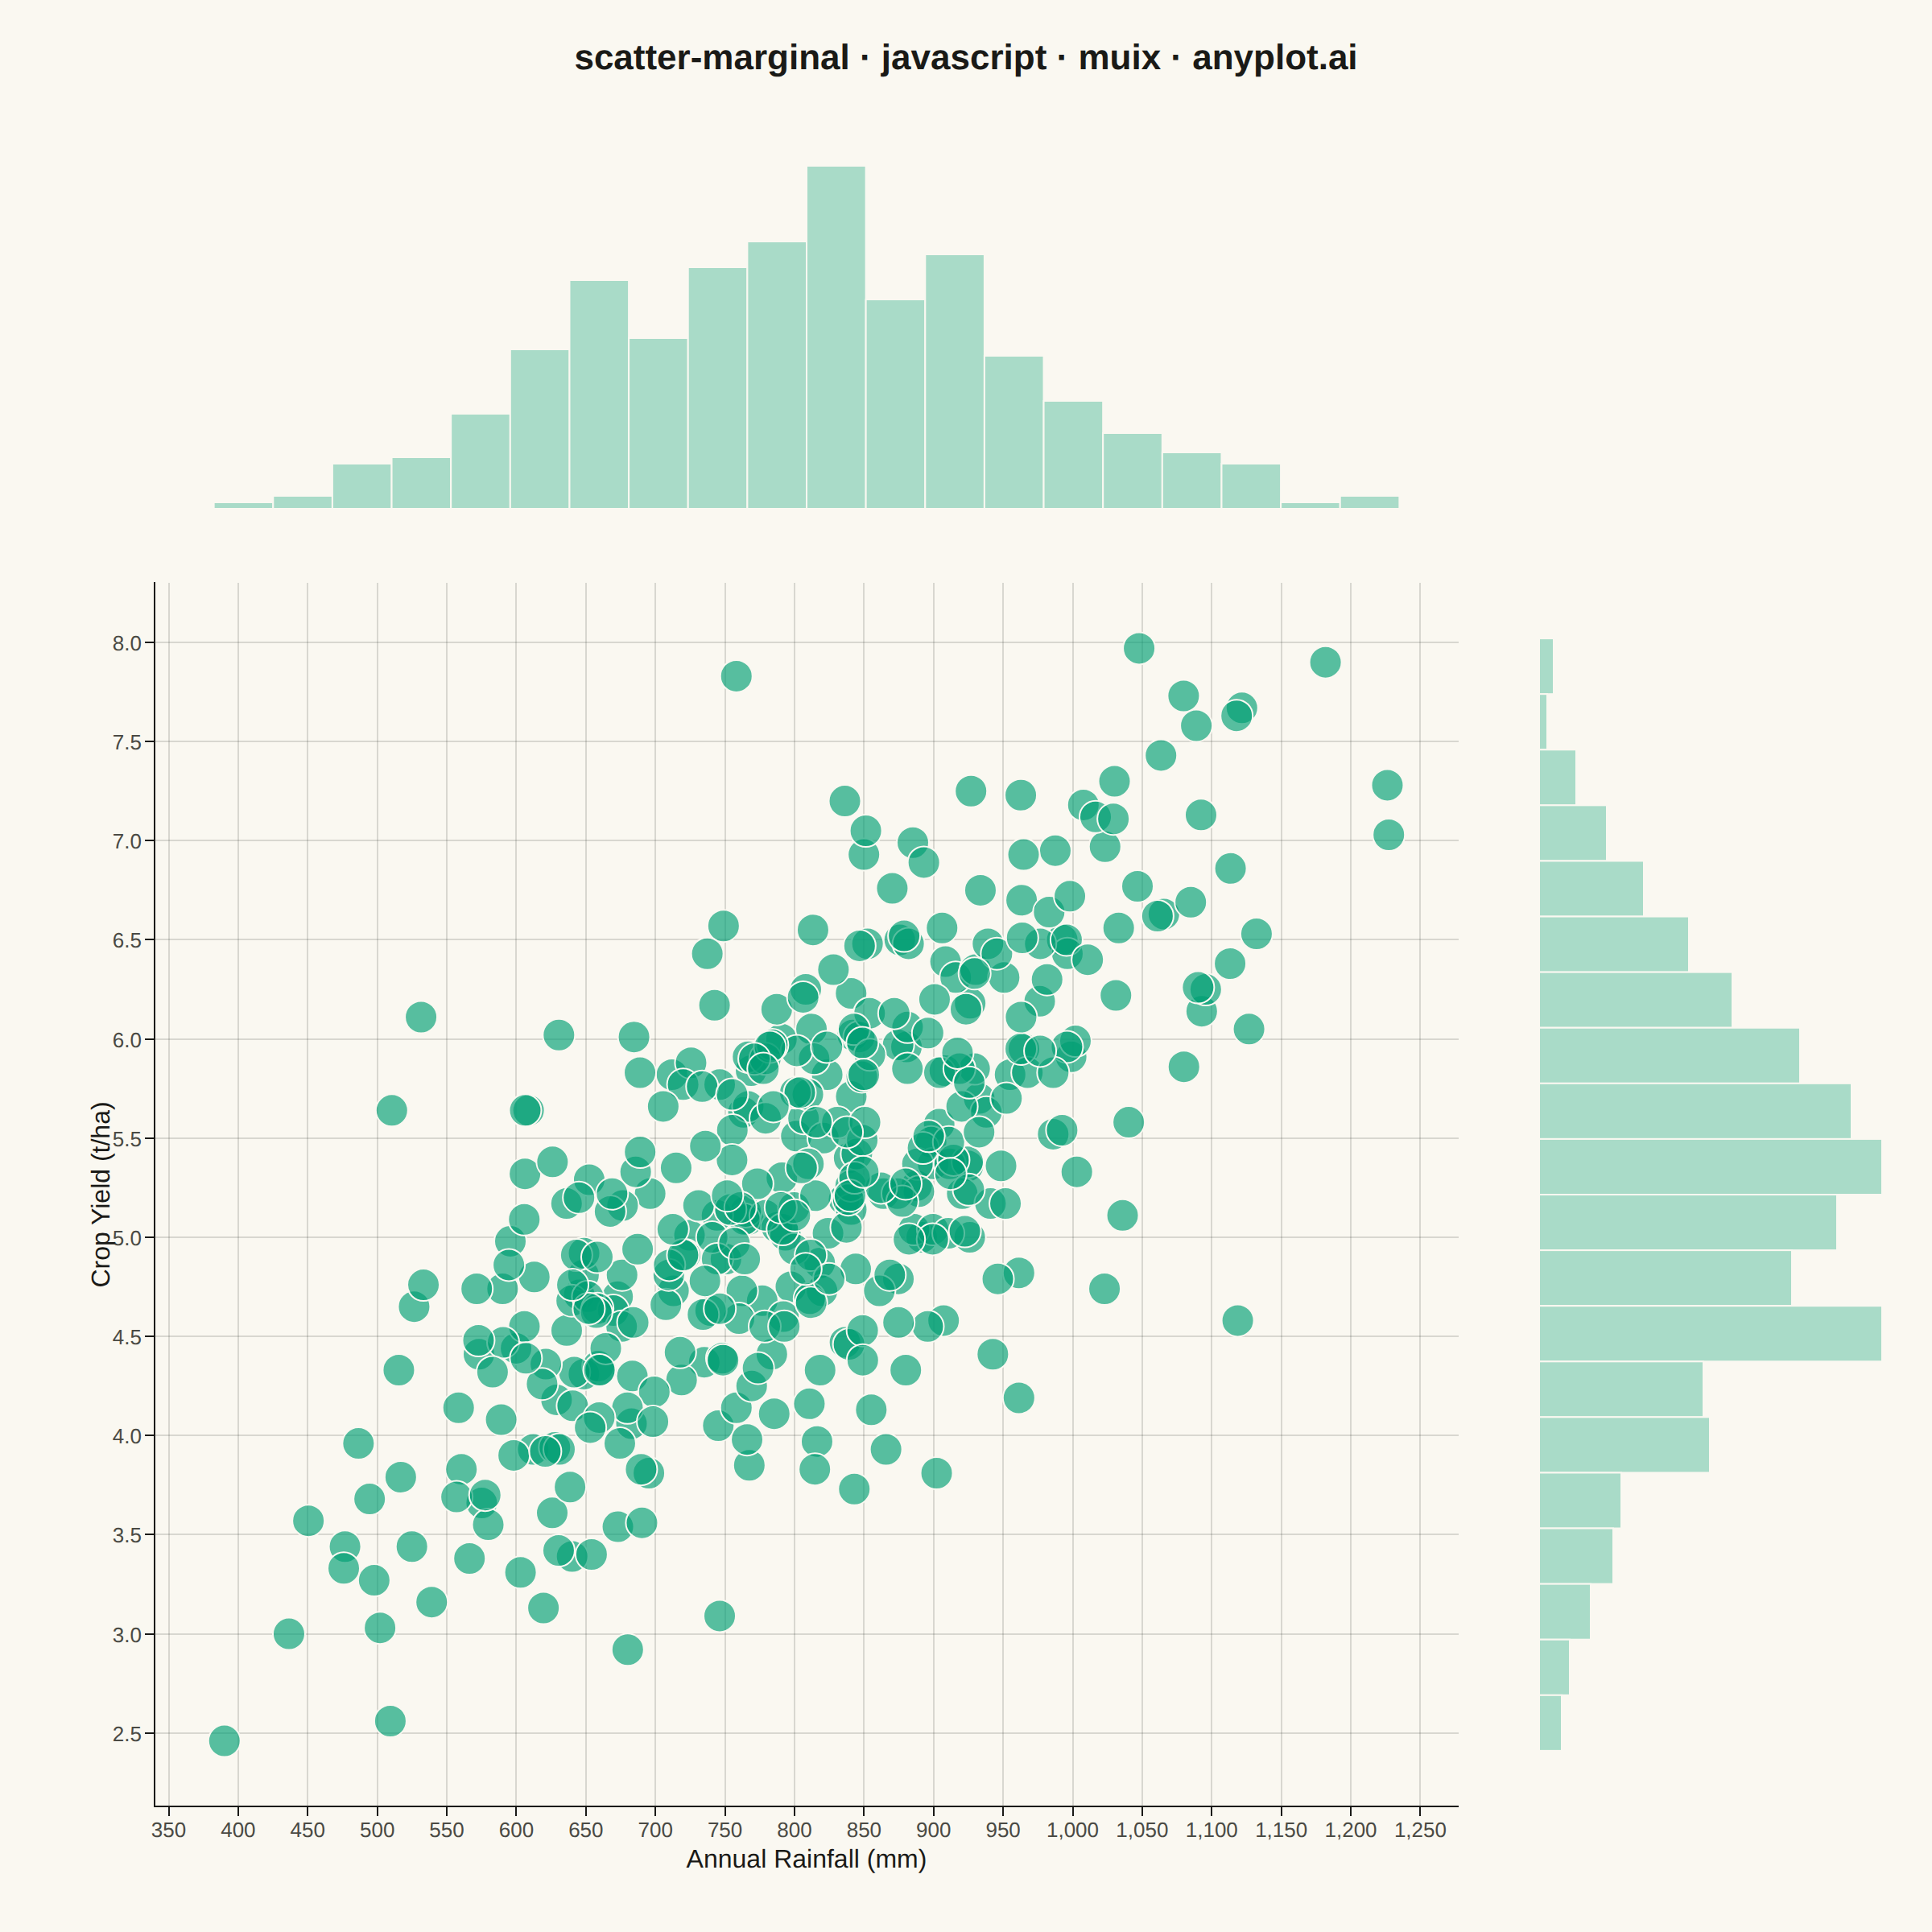
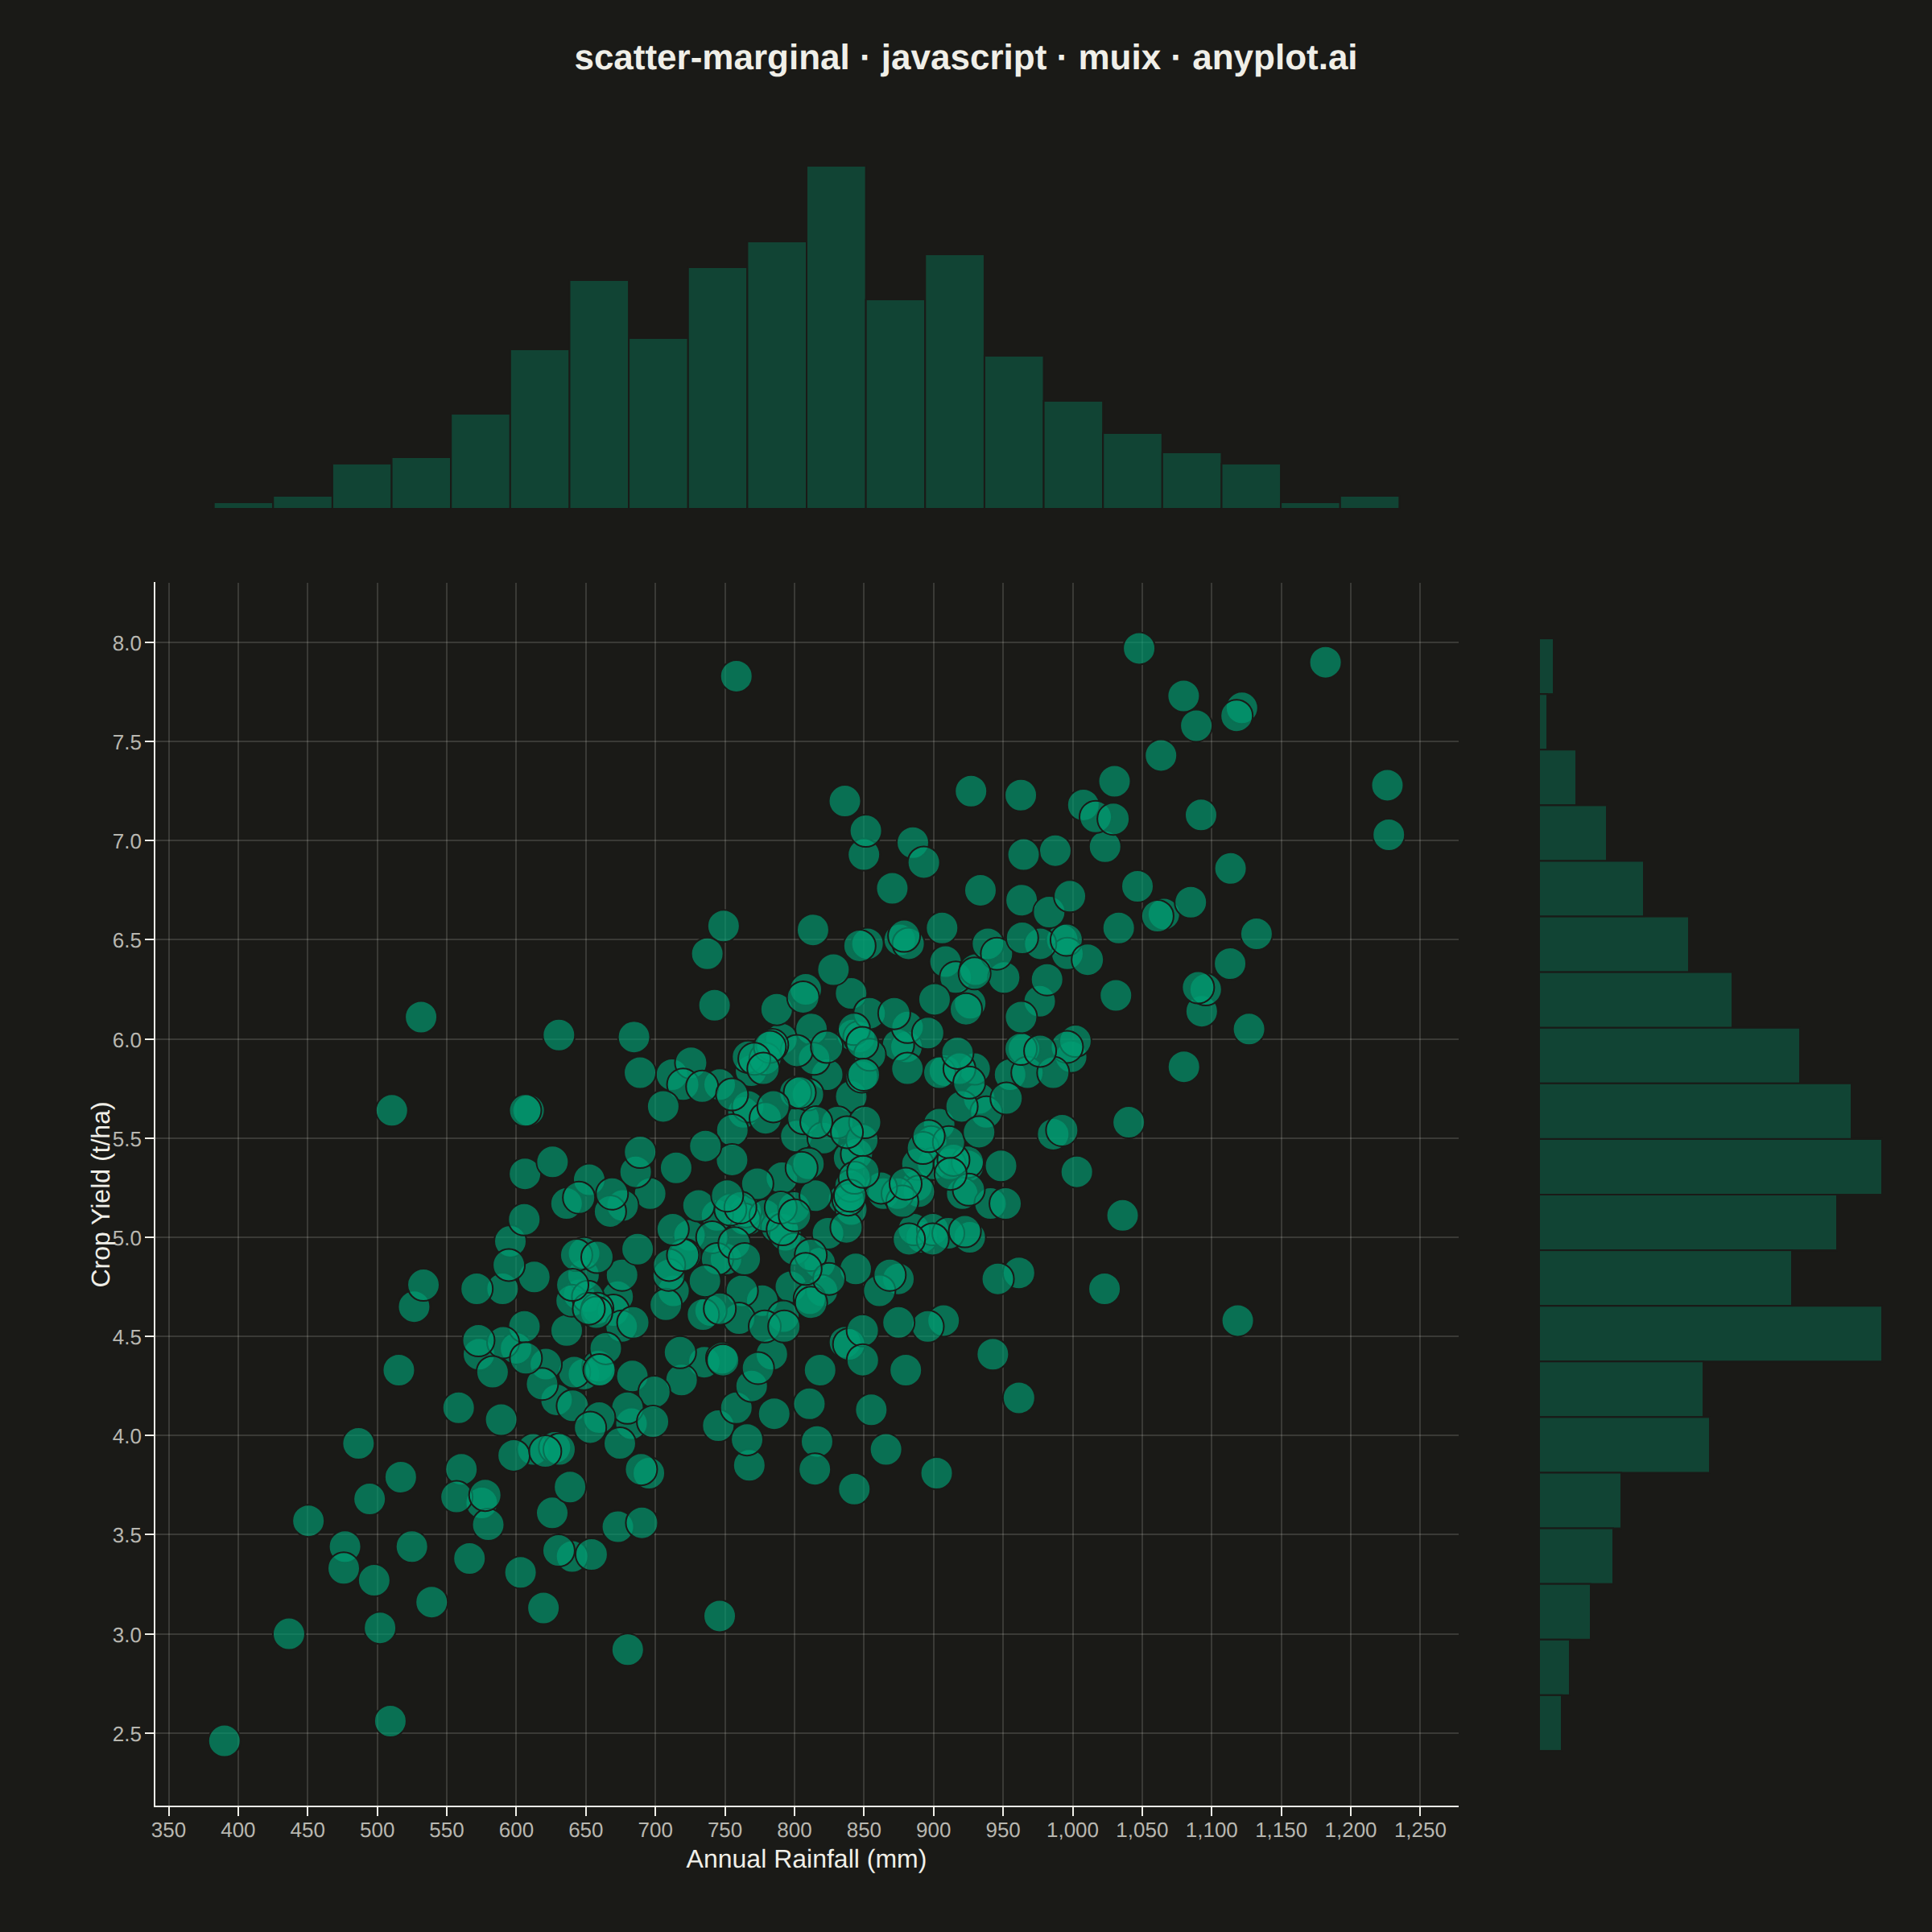
A scatter plot enhanced with marginal distribution plots (histograms or kernel density estimates) on the top and right axes. This composite visualization simultaneously shows the bivariate relationship between two variables in the central scatter plot while displaying each variable's univariate distribution along its respective axis. It provides a comprehensive view of both the joint and marginal distributions in a single figure.
// anyplot.ai
// scatter-marginal: Scatter Plot with Marginal Distributions
// Library: muix 7.29.1 | JavaScript 22.23.2
// Quality: 87/100 | Created: 2026-09-09
//# anyplot-orientation: square
import { ScatterChart } from "@mui/x-charts/ScatterChart";
import { BarChart } from "@mui/x-charts/BarChart";

const t = window.ANYPLOT_TOKENS;
const { width, height } = window.ANYPLOT_SIZE;

// --- Data (in-memory, deterministic) ----------------------------------------
// Field-trial data: seasonal rainfall vs. crop yield across 400 plots. Yield
// tracks rainfall with a moderate positive correlation plus agronomic noise,
// so both the joint relationship and each variable's own spread are visible.
let seed = 42;
const nextRandom = () => {
  seed = (Math.imul(seed, 1103515245) + 12345) & 0x7fffffff;
  return seed / 0x7fffffff;
};
const nextGaussian = () => {
  const u1 = Math.max(nextRandom(), 1e-9);
  const u2 = nextRandom();
  return Math.sqrt(-2 * Math.log(u1)) * Math.cos(2 * Math.PI * u2);
};

const POINT_COUNT = 400;
const points = [];
for (let i = 0; i < POINT_COUNT; i += 1) {
  const rainfall = 800 + 150 * nextGaussian();
  const yieldPerHectare = Math.max(0.6, 1.6 + 0.0046 * rainfall + 0.7 * nextGaussian());
  points.push({
    id: i,
    x: Number(rainfall.toFixed(1)),
    y: Number(yieldPerHectare.toFixed(2)),
  });
}

const rainfallValues = points.map((p) => p.x);
const yieldValues = points.map((p) => p.y);

// Shared axis domains — the SAME min/max drive both the main scatter's axes
// and the marginal histograms' binning, which is what keeps the three panels
// pixel-aligned.
const domainPad = (values) => {
  const lo = Math.min(...values);
  const hi = Math.max(...values);
  const pad = (hi - lo) * 0.06;
  return [lo - pad, hi + pad];
};
const [xMin, xMax] = domainPad(rainfallValues);
const [yMin, yMax] = domainPad(yieldValues);

const BIN_COUNT = 22;
const histogram = (values, min, max, bins) => {
  const binWidth = (max - min) / bins;
  const counts = new Array(bins).fill(0);
  values.forEach((value) => {
    const idx = Math.min(bins - 1, Math.max(0, Math.floor((value - min) / binWidth)));
    counts[idx] += 1;
  });
  const centers = counts.map((_, i) => Number((min + (i + 0.5) * binWidth).toFixed(2)));
  return { counts, centers };
};
const { counts: countsX, centers: centersX } = histogram(rainfallValues, xMin, xMax, BIN_COUNT);
const { counts: countsY, centers: centersY } = histogram(yieldValues, yMin, yMax, BIN_COUNT);
const maxCountX = Math.max(...countsX);
const maxCountY = Math.max(...countsY);

// Points get moderate transparency to reveal density (spec: alpha ~0.6-0.7);
// marginal histograms stay subtle so they don't compete with the scatter.
const withAlpha = (hex, alpha) => {
  const n = parseInt(hex.slice(1), 16);
  const r = (n >> 16) & 255;
  const g = (n >> 8) & 255;
  const b = n & 255;
  return `rgba(${r}, ${g}, ${b}, ${alpha})`;
};
const BRAND = t.palette[0];
const MARKER_FILL = withAlpha(BRAND, 0.65);
const MARGINAL_FILL = withAlpha(BRAND, 0.32);

// --- Layout — main scatter lower-left, marginal histograms top + right -----
const TITLE_H = 72;
const GAP = 24;
const MARGIN_PANEL = 250;
const plotAreaH = height - TITLE_H;
const mainWidth = width - GAP - MARGIN_PANEL;
const mainHeight = plotAreaH - GAP - MARGIN_PANEL;
// Shared left/right and top/bottom margins keep the histogram bins aligned
// with the main plot's axis ticks (same drawable-area geometry on both axes).
const MAIN_MARGIN = { left: 96, right: 20, top: 16, bottom: 78 };

// --- Title (fontsize scales with title length, see plot-generator.md) -------
const TITLE = "scatter-marginal · javascript · muix · anyplot.ai";
const TITLE_FONTSIZE = Math.round(22 * (TITLE.length > 67 ? 67 / TITLE.length : 1));

const HIDE_AXIS_SX = { "& .MuiChartsAxis-root": { display: "none" } };
// Thin background-colored strokes separate adjacent marks (bars) and
// overlapping marks (scatter points) from one another — same edge color as
// the page background so it reads as a "cutout" gap in both themes.
const MARGIN_BAR_SX = { ...HIDE_AXIS_SX, "& .MuiBarElement-root": { stroke: t.pageBg, strokeWidth: 1 } };
const SCATTER_MARKER_SX = { "& circle": { stroke: t.pageBg, strokeWidth: 1 } };

// --- Chart (default-exported component — the harness mounts it) -------------
export default function Chart() {
  return (
    <div style={{ width, height, display: "flex", flexDirection: "column" }}>
      <div
        style={{
          height: TITLE_H,
          display: "flex",
          alignItems: "center",
          justifyContent: "center",
          fontSize: TITLE_FONTSIZE,
          fontWeight: 600,
          color: t.ink,
          fontFamily: "Roboto, Helvetica, Arial, sans-serif",
        }}
      >
        {TITLE}
      </div>
      <div
        style={{
          width,
          height: plotAreaH,
          display: "grid",
          gridTemplateColumns: `${mainWidth}px ${GAP}px ${MARGIN_PANEL}px`,
          gridTemplateRows: `${MARGIN_PANEL}px ${GAP}px ${mainHeight}px`,
        }}
      >
        <div style={{ gridColumn: 1, gridRow: 1 }}>
          <BarChart
            width={mainWidth}
            height={MARGIN_PANEL}
            skipAnimation
            legend={{ hidden: true }}
            margin={{ left: MAIN_MARGIN.left, right: MAIN_MARGIN.right, top: 14, bottom: 6 }}
            xAxis={[{ scaleType: "band", data: centersX, categoryGapRatio: 0 }]}
            yAxis={[{ min: 0, max: maxCountX * 1.08 }]}
            series={[{ data: countsX, color: MARGINAL_FILL }]}
            sx={MARGIN_BAR_SX}
          />
        </div>
        <div style={{ gridColumn: 1, gridRow: 3 }}>
          <ScatterChart
            width={mainWidth}
            height={mainHeight}
            skipAnimation
            legend={{ hidden: true }}
            grid={{ horizontal: true, vertical: true }}
            margin={MAIN_MARGIN}
            xAxis={[
              {
                min: xMin,
                max: xMax,
                label: "Annual Rainfall (mm)",
                labelStyle: { fontSize: 16, fill: t.ink },
                tickLabelStyle: { fontSize: 13, fill: t.inkSoft },
              },
            ]}
            yAxis={[
              {
                min: yMin,
                max: yMax,
                label: "Crop Yield (t/ha)",
                labelStyle: { fontSize: 16, fill: t.ink },
                tickLabelStyle: { fontSize: 13, fill: t.inkSoft },
              },
            ]}
            series={[{ data: points, markerSize: 10, color: MARKER_FILL }]}
            sx={SCATTER_MARKER_SX}
          />
        </div>
        <div style={{ gridColumn: 3, gridRow: 3 }}>
          <BarChart
            layout="horizontal"
            width={MARGIN_PANEL}
            height={mainHeight}
            skipAnimation
            legend={{ hidden: true }}
            margin={{ top: MAIN_MARGIN.top, bottom: MAIN_MARGIN.bottom, left: 6, right: 14 }}
            yAxis={[{ scaleType: "band", data: centersY, categoryGapRatio: 0 }]}
            xAxis={[{ min: 0, max: maxCountY * 1.08 }]}
            series={[{ data: countsY, color: MARGINAL_FILL }]}
            sx={MARGIN_BAR_SX}
          />
        </div>
      </div>
    </div>
  );
}
Runnable source as JSON, for any HTTP client: https://api.anyplot.ai/specs/scatter-marginal/muix/code. Any spec id and library id listed in llms-full.txt fit the same URL shape; every URL below is complete and callable.
{
  "spec_id": "scatter-marginal",
  "language": "javascript",
  "library": "muix",
  "page": "https://anyplot.ai/scatter-marginal/javascript/muix",
  "hub": "https://anyplot.ai/scatter-marginal",
  "code_json": "https://api.anyplot.ai/specs/scatter-marginal/muix/code",
  "spec_json": "https://api.anyplot.ai/specs/scatter-marginal",
  "render_light_png": "https://storage.googleapis.com/anyplot-images/plots/scatter-marginal/javascript/muix/plot-light.png",
  "render_dark_png": "https://storage.googleapis.com/anyplot-images/plots/scatter-marginal/javascript/muix/plot-dark.png",
  "interactive_light_html": "https://storage.googleapis.com/anyplot-images/plots/scatter-marginal/javascript/muix/plot-light.html",
  "interactive_dark_html": "https://storage.googleapis.com/anyplot-images/plots/scatter-marginal/javascript/muix/plot-dark.html",
  "quality_score": 87.0,
  "license": "MIT",
  "guide": "https://anyplot.ai/llms.txt"
}
Part of Scatter Plot with Marginal Distributions on anyplot.ai.