The same plot in 14 other libraries — JavaScript: Chart.js, D3.js, Highcharts, MUI X Charts; Python: Altair, Bokeh, lets-plot, Matplotlib, Plotly, plotnine, Pygal, Seaborn; R: ggplot2; Julia: Makie.jl. Compare all 15 side by side: Scatter Plot with Marginal Distributions in Python, R, Julia and JavaScript.
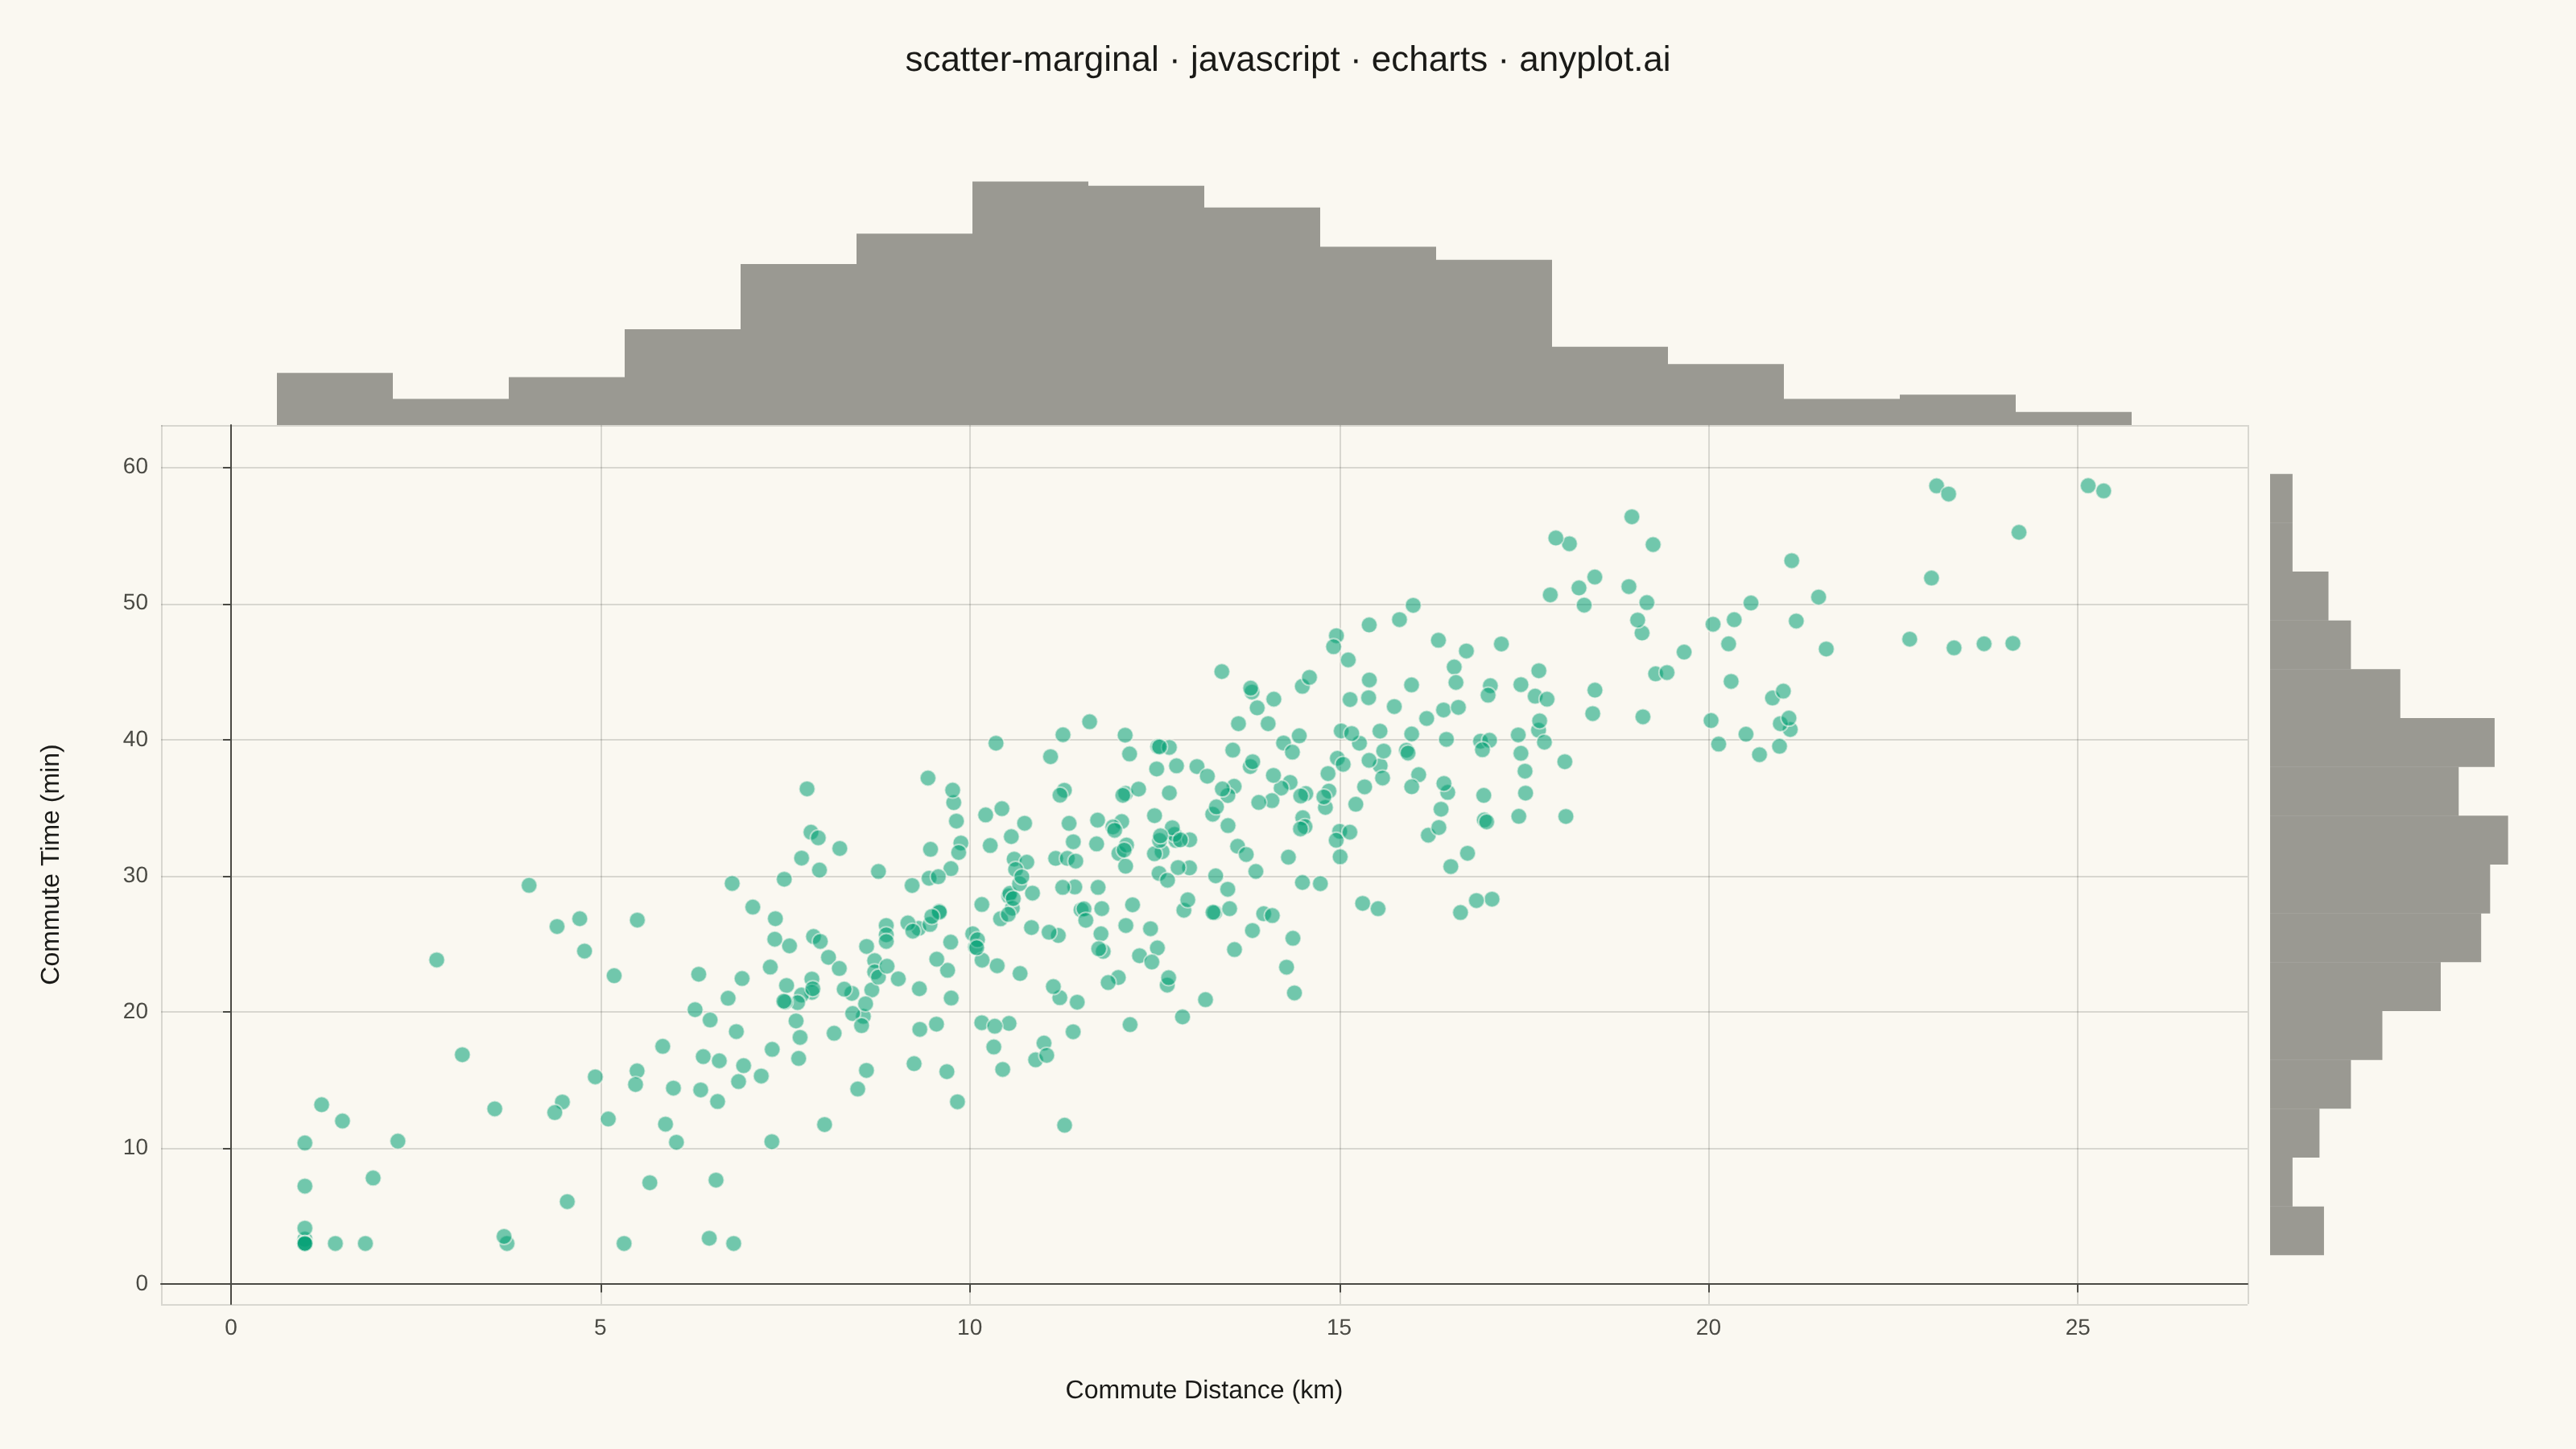
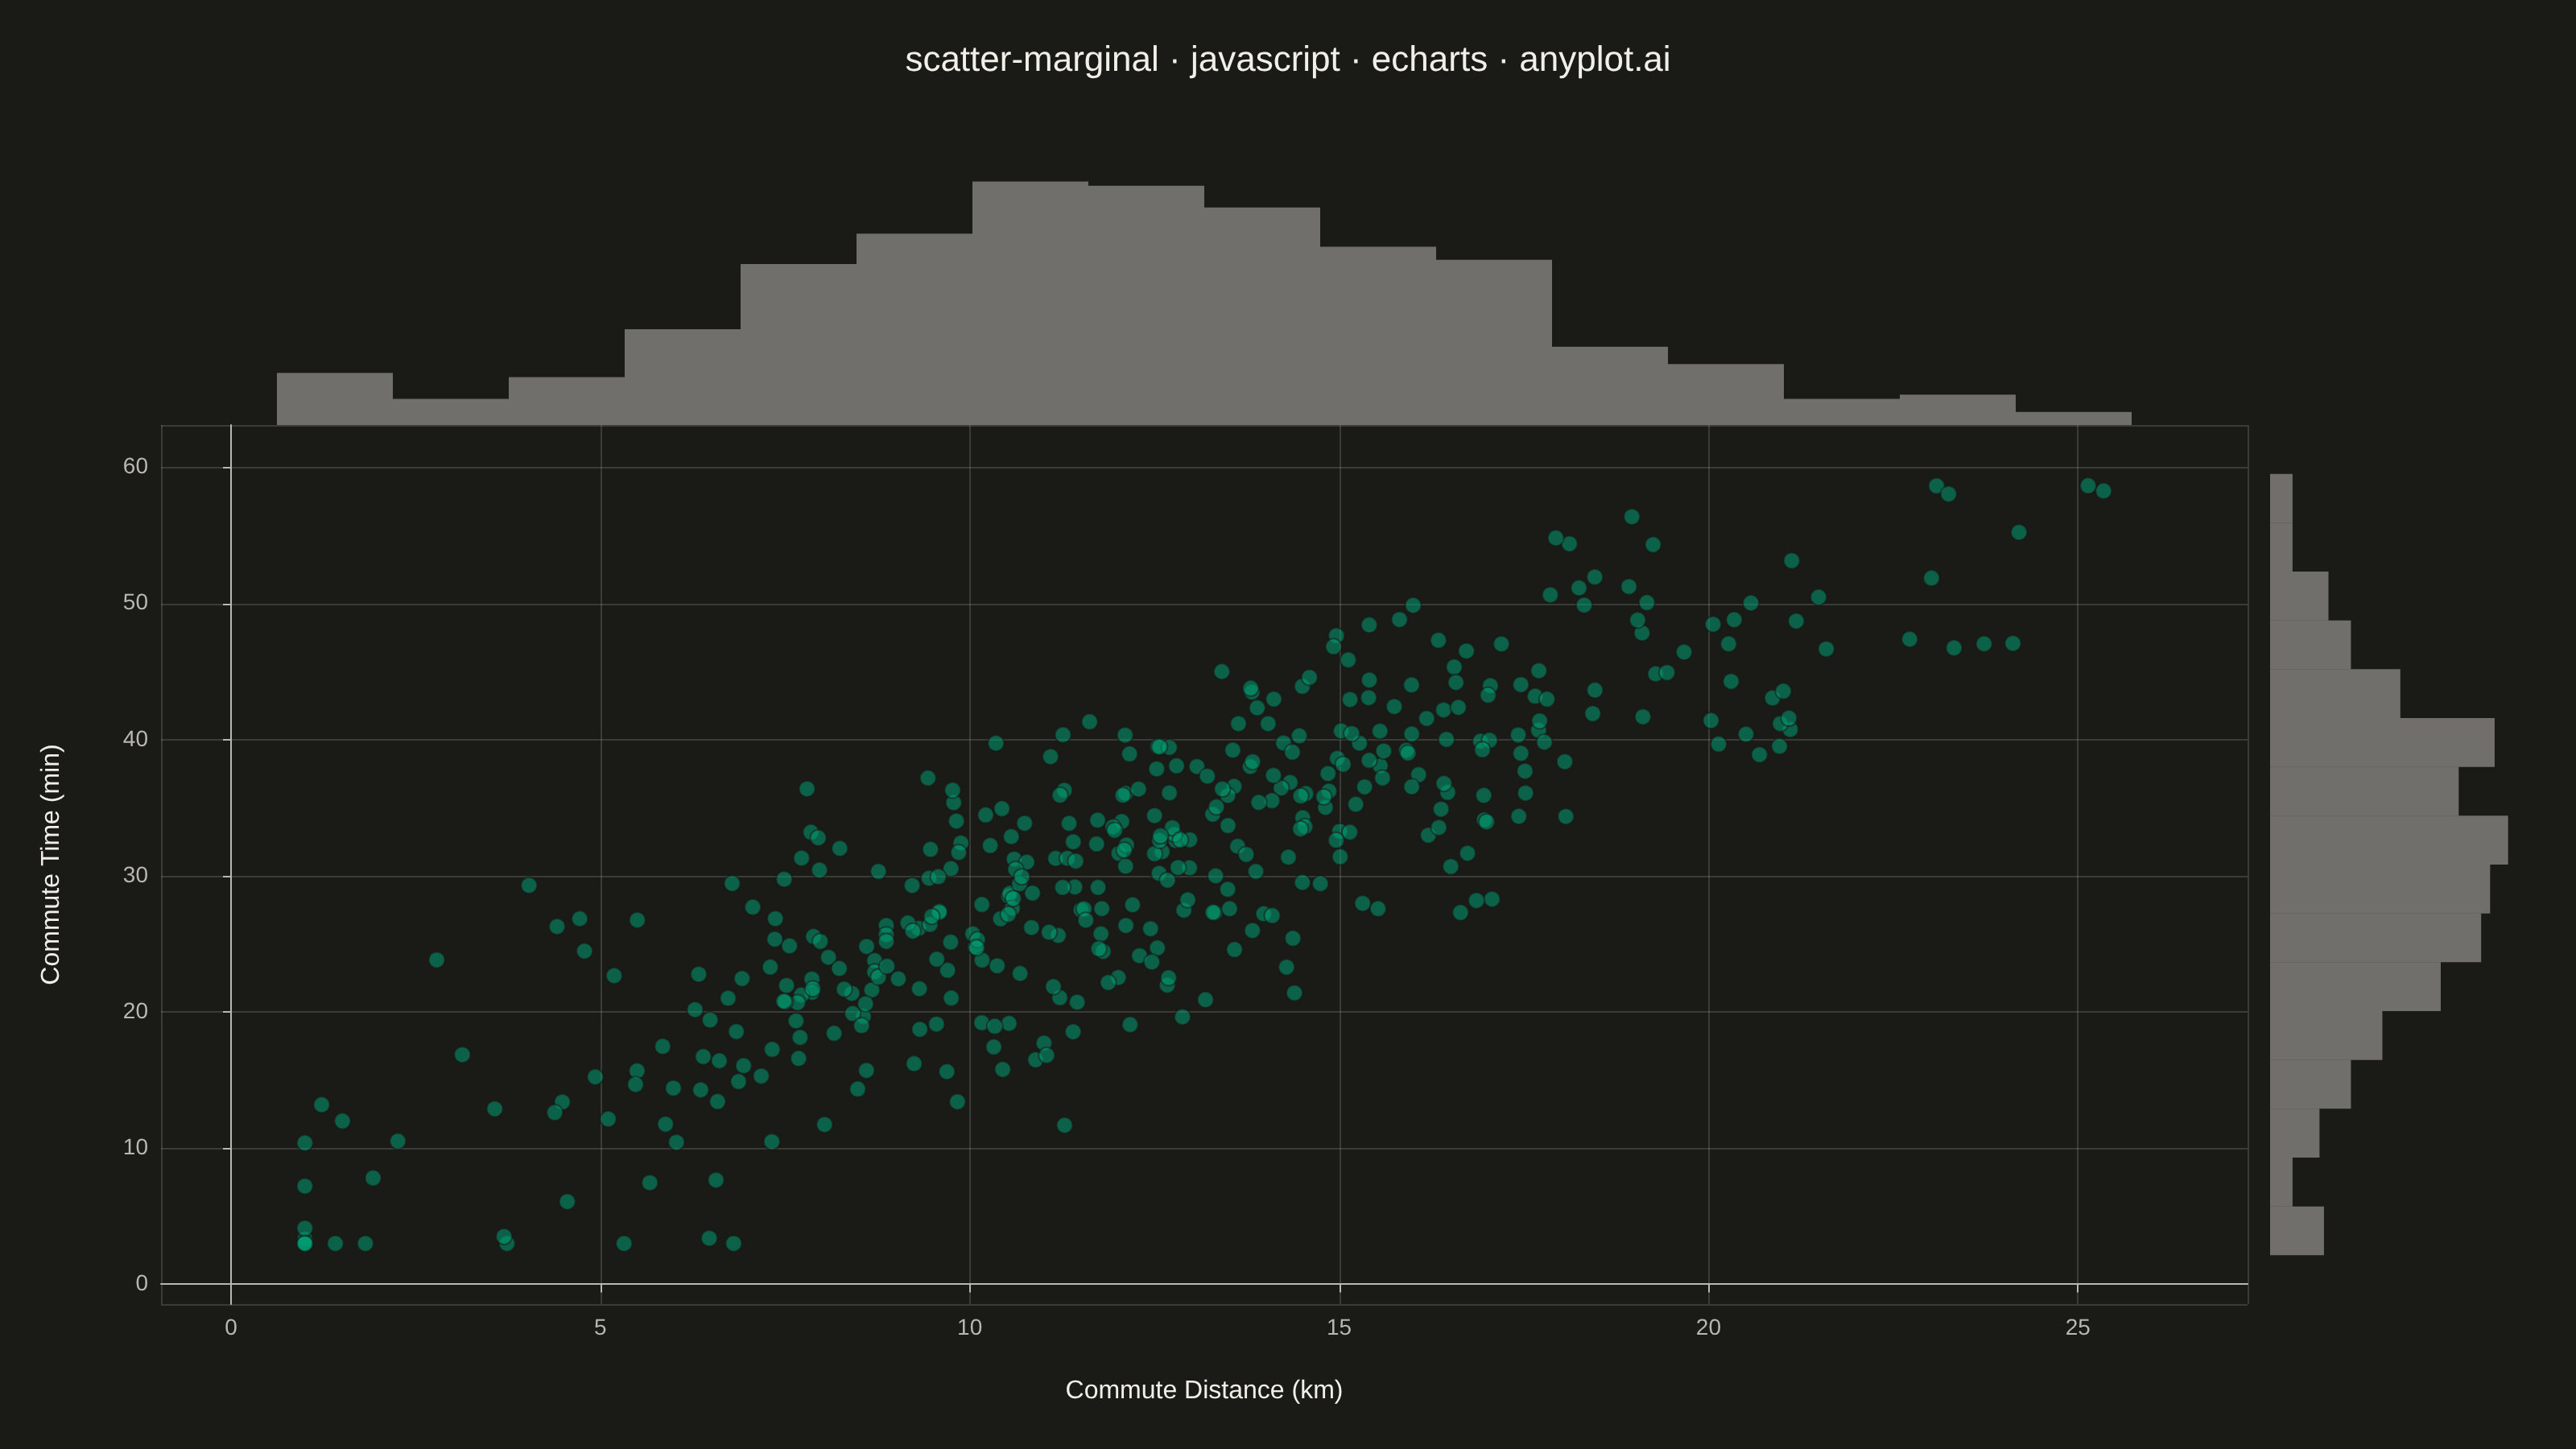
A scatter plot enhanced with marginal distribution plots (histograms or kernel density estimates) on the top and right axes. This composite visualization simultaneously shows the bivariate relationship between two variables in the central scatter plot while displaying each variable's univariate distribution along its respective axis. It provides a comprehensive view of both the joint and marginal distributions in a single figure.
// anyplot.ai
// scatter-marginal: Scatter Plot with Marginal Distributions
// Library: echarts 6.1.0 | JavaScript 22.23.2
// Quality: 91/100 | Created: 2026-09-09

const t = window.ANYPLOT_TOKENS;
const size = window.ANYPLOT_SIZE;

// --- Deterministic PRNG (LCG) + Box-Muller normal samples -------------------
let seed = 42;
function lcg() {
  seed = (seed * 1103515245 + 12345) & 0x7fffffff;
  return seed / 0x7fffffff;
}
function randNormal() {
  const u1 = Math.max(lcg(), 1e-9);
  const u2 = lcg();
  return Math.sqrt(-2 * Math.log(u1)) * Math.cos(2 * Math.PI * u2);
}

// --- Data: daily commute distance vs. commute time ---------------------------
const N = 420;
const points = [];
for (let i = 0; i < N; i++) {
  const distance = Math.min(34, Math.max(1, 12 + 5 * randNormal()));
  const time = Math.min(95, Math.max(3, 2.1 * distance + 5 + 6 * randNormal()));
  points.push([distance, time]);
}
const xs = points.map((p) => p[0]);
const ys = points.map((p) => p[1]);

// --- Histogram binning --------------------------------------------------------
function histogram(values, min, max, binCount) {
  const binWidth = (max - min) / binCount;
  const counts = new Array(binCount).fill(0);
  values.forEach((v) => {
    let idx = Math.floor((v - min) / binWidth);
    if (idx >= binCount) idx = binCount - 1;
    if (idx < 0) idx = 0;
    counts[idx]++;
  });
  return counts.map((count, i) => ({
    start: min + i * binWidth,
    end: min + (i + 1) * binWidth,
    count,
  }));
}

const xPad = (Math.max(...xs) - Math.min(...xs)) * 0.08;
const yPad = (Math.max(...ys) - Math.min(...ys)) * 0.08;
const xMin = Math.min(...xs) - xPad;
const xMax = Math.max(...xs) + xPad;
const yMin = Math.min(...ys) - yPad;
const yMax = Math.max(...ys) + yPad;

const BIN_COUNT = 18;
const xBins = histogram(xs, xMin, xMax, BIN_COUNT);
const yBins = histogram(ys, yMin, yMax, BIN_COUNT);
const xCountMax = Math.max(...xBins.map((b) => b.count)) * 1.15;
const yCountMax = Math.max(...yBins.map((b) => b.count)) * 1.15;

// --- Layout: three grids sharing pixel-aligned axis ranges -------------------
const W = (size && size.width) || 1600;
const H = (size && size.height) || 900;
const OUTER = 20;
const GRID_LEFT = 100;
const TOP_MARGIN = 90;
const TOP_HIST_H = 160;
const RIGHT_HIST_W = 170;
const GAP = 14;
const BOTTOM_MARGIN = 90;

const mainRight = OUTER + RIGHT_HIST_W + GAP;
const mainTop = TOP_MARGIN + TOP_HIST_H + GAP;

const mainGrid = { left: GRID_LEFT, right: mainRight, top: mainTop, bottom: BOTTOM_MARGIN };
const topGrid = { left: GRID_LEFT, right: mainRight, top: TOP_MARGIN, bottom: H - mainTop };
const rightGrid = { left: W - OUTER - RIGHT_HIST_W, right: OUTER, top: mainTop, bottom: BOTTOM_MARGIN };

// Subtle, theme-adaptive fill for the marginal histograms so they read as
// context rather than competing with the brand-green scatter points.
const MARGINAL_COLOR = t.inkSoft;

// A custom "rect" renderer draws each histogram bar directly in pixel space
// via api.coord(), which is the only way to get true value-axis-aligned bars
// (ECharts' built-in bar series always treats the x axis as the base axis
// when neither axis is categorical, so it cannot draw the horizontal bars
// the right-hand marginal needs).
function rectRenderItem(p0, p1, params, api) {
  const shape = echarts.graphic.clipRectByRect(
    { x: Math.min(p0[0], p1[0]), y: Math.min(p0[1], p1[1]), width: Math.abs(p1[0] - p0[0]), height: Math.abs(p1[1] - p0[1]) },
    { x: params.coordSys.x, y: params.coordSys.y, width: params.coordSys.width, height: params.coordSys.height }
  );
  return shape && { type: "rect", shape, style: api.style() };
}

// --- ECharts option ------------------------------------------------------------
const chart = echarts.init(document.getElementById("container"));
chart.setOption({
  animation: false,
  backgroundColor: "transparent",
  title: {
    text: "scatter-marginal · javascript · echarts · anyplot.ai",
    left: "center",
    top: 22,
    textStyle: { color: t.ink, fontSize: 22, fontWeight: 500 },
  },
  grid: [mainGrid, topGrid, rightGrid],
  xAxis: [
    {
      gridIndex: 0,
      type: "value",
      min: xMin,
      max: xMax,
      name: "Commute Distance (km)",
      nameLocation: "middle",
      nameGap: 46,
      nameTextStyle: { color: t.ink, fontSize: 16 },
      axisLabel: { color: t.inkSoft, fontSize: 14, showMaxLabel: false },
      axisLine: { lineStyle: { color: t.inkSoft } },
      splitLine: { lineStyle: { color: t.grid } },
    },
    {
      gridIndex: 1,
      type: "value",
      min: xMin,
      max: xMax,
      show: false,
      axisLabel: { show: false },
      axisLine: { show: false },
      axisTick: { show: false },
      splitLine: { show: false },
    },
    {
      gridIndex: 2,
      type: "value",
      min: 0,
      max: yCountMax,
      show: false,
      axisLabel: { show: false },
      axisLine: { show: false },
      axisTick: { show: false },
      splitLine: { show: false },
    },
  ],
  yAxis: [
    {
      gridIndex: 0,
      type: "value",
      min: yMin,
      max: yMax,
      name: "Commute Time (min)",
      nameLocation: "middle",
      nameGap: 60,
      nameTextStyle: { color: t.ink, fontSize: 16 },
      axisLabel: { color: t.inkSoft, fontSize: 14, showMaxLabel: false },
      axisLine: { lineStyle: { color: t.inkSoft } },
      splitLine: { lineStyle: { color: t.grid } },
    },
    {
      gridIndex: 1,
      type: "value",
      min: 0,
      max: xCountMax,
      show: false,
      axisLabel: { show: false },
      axisLine: { show: false },
      axisTick: { show: false },
      splitLine: { show: false },
    },
    {
      gridIndex: 2,
      type: "value",
      min: yMin,
      max: yMax,
      show: false,
      axisLabel: { show: false },
      axisLine: { show: false },
      axisTick: { show: false },
      splitLine: { show: false },
    },
  ],
  series: [
    {
      type: "scatter",
      xAxisIndex: 0,
      yAxisIndex: 0,
      data: points,
      symbolSize: 10,
      itemStyle: { color: t.palette[0], opacity: 0.55, borderColor: t.pageBg, borderWidth: 1 },
    },
    {
      // Top marginal: vertical bars, one per x bin, growing upward from the
      // grid line adjacent to the main scatter plot.
      type: "custom",
      xAxisIndex: 1,
      yAxisIndex: 1,
      data: xBins.map((b) => [b.start, b.end, b.count]),
      renderItem: (params, api) => {
        const start = api.value(0);
        const end = api.value(1);
        const count = api.value(2);
        const p0 = api.coord([start, 0]);
        const p1 = api.coord([end, count]);
        return rectRenderItem(p0, p1, params, api);
      },
      itemStyle: { color: MARGINAL_COLOR, opacity: 0.55 },
      silent: true,
    },
    {
      // Right marginal: horizontal bars, one per y bin, growing rightward
      // from the grid line adjacent to the main scatter plot.
      type: "custom",
      xAxisIndex: 2,
      yAxisIndex: 2,
      data: yBins.map((b) => [b.start, b.end, b.count]),
      renderItem: (params, api) => {
        const start = api.value(0);
        const end = api.value(1);
        const count = api.value(2);
        const p0 = api.coord([0, start]);
        const p1 = api.coord([count, end]);
        return rectRenderItem(p0, p1, params, api);
      },
      itemStyle: { color: MARGINAL_COLOR, opacity: 0.55 },
      silent: true,
    },
  ],
});
Runnable source as JSON, for any HTTP client: https://api.anyplot.ai/specs/scatter-marginal/echarts/code. Any spec id and library id listed in llms-full.txt fit the same URL shape; every URL below is complete and callable.
{
  "spec_id": "scatter-marginal",
  "language": "javascript",
  "library": "echarts",
  "page": "https://anyplot.ai/scatter-marginal/javascript/echarts",
  "hub": "https://anyplot.ai/scatter-marginal",
  "code_json": "https://api.anyplot.ai/specs/scatter-marginal/echarts/code",
  "spec_json": "https://api.anyplot.ai/specs/scatter-marginal",
  "render_light_png": "https://storage.googleapis.com/anyplot-images/plots/scatter-marginal/javascript/echarts/plot-light.png",
  "render_dark_png": "https://storage.googleapis.com/anyplot-images/plots/scatter-marginal/javascript/echarts/plot-dark.png",
  "interactive_light_html": "https://storage.googleapis.com/anyplot-images/plots/scatter-marginal/javascript/echarts/plot-light.html",
  "interactive_dark_html": "https://storage.googleapis.com/anyplot-images/plots/scatter-marginal/javascript/echarts/plot-dark.html",
  "quality_score": 91.0,
  "license": "MIT",
  "guide": "https://anyplot.ai/llms.txt"
}
Part of Scatter Plot with Marginal Distributions on anyplot.ai.