The same plot in 14 other libraries — JavaScript: D3.js, Apache ECharts, Highcharts, MUI X Charts; Python: Altair, Bokeh, lets-plot, Matplotlib, Plotly, plotnine, Pygal, Seaborn; R: ggplot2; Julia: Makie.jl. Compare all 15 side by side: SHAP Waterfall Plot for Feature Attribution in Python, R, Julia and JavaScript.
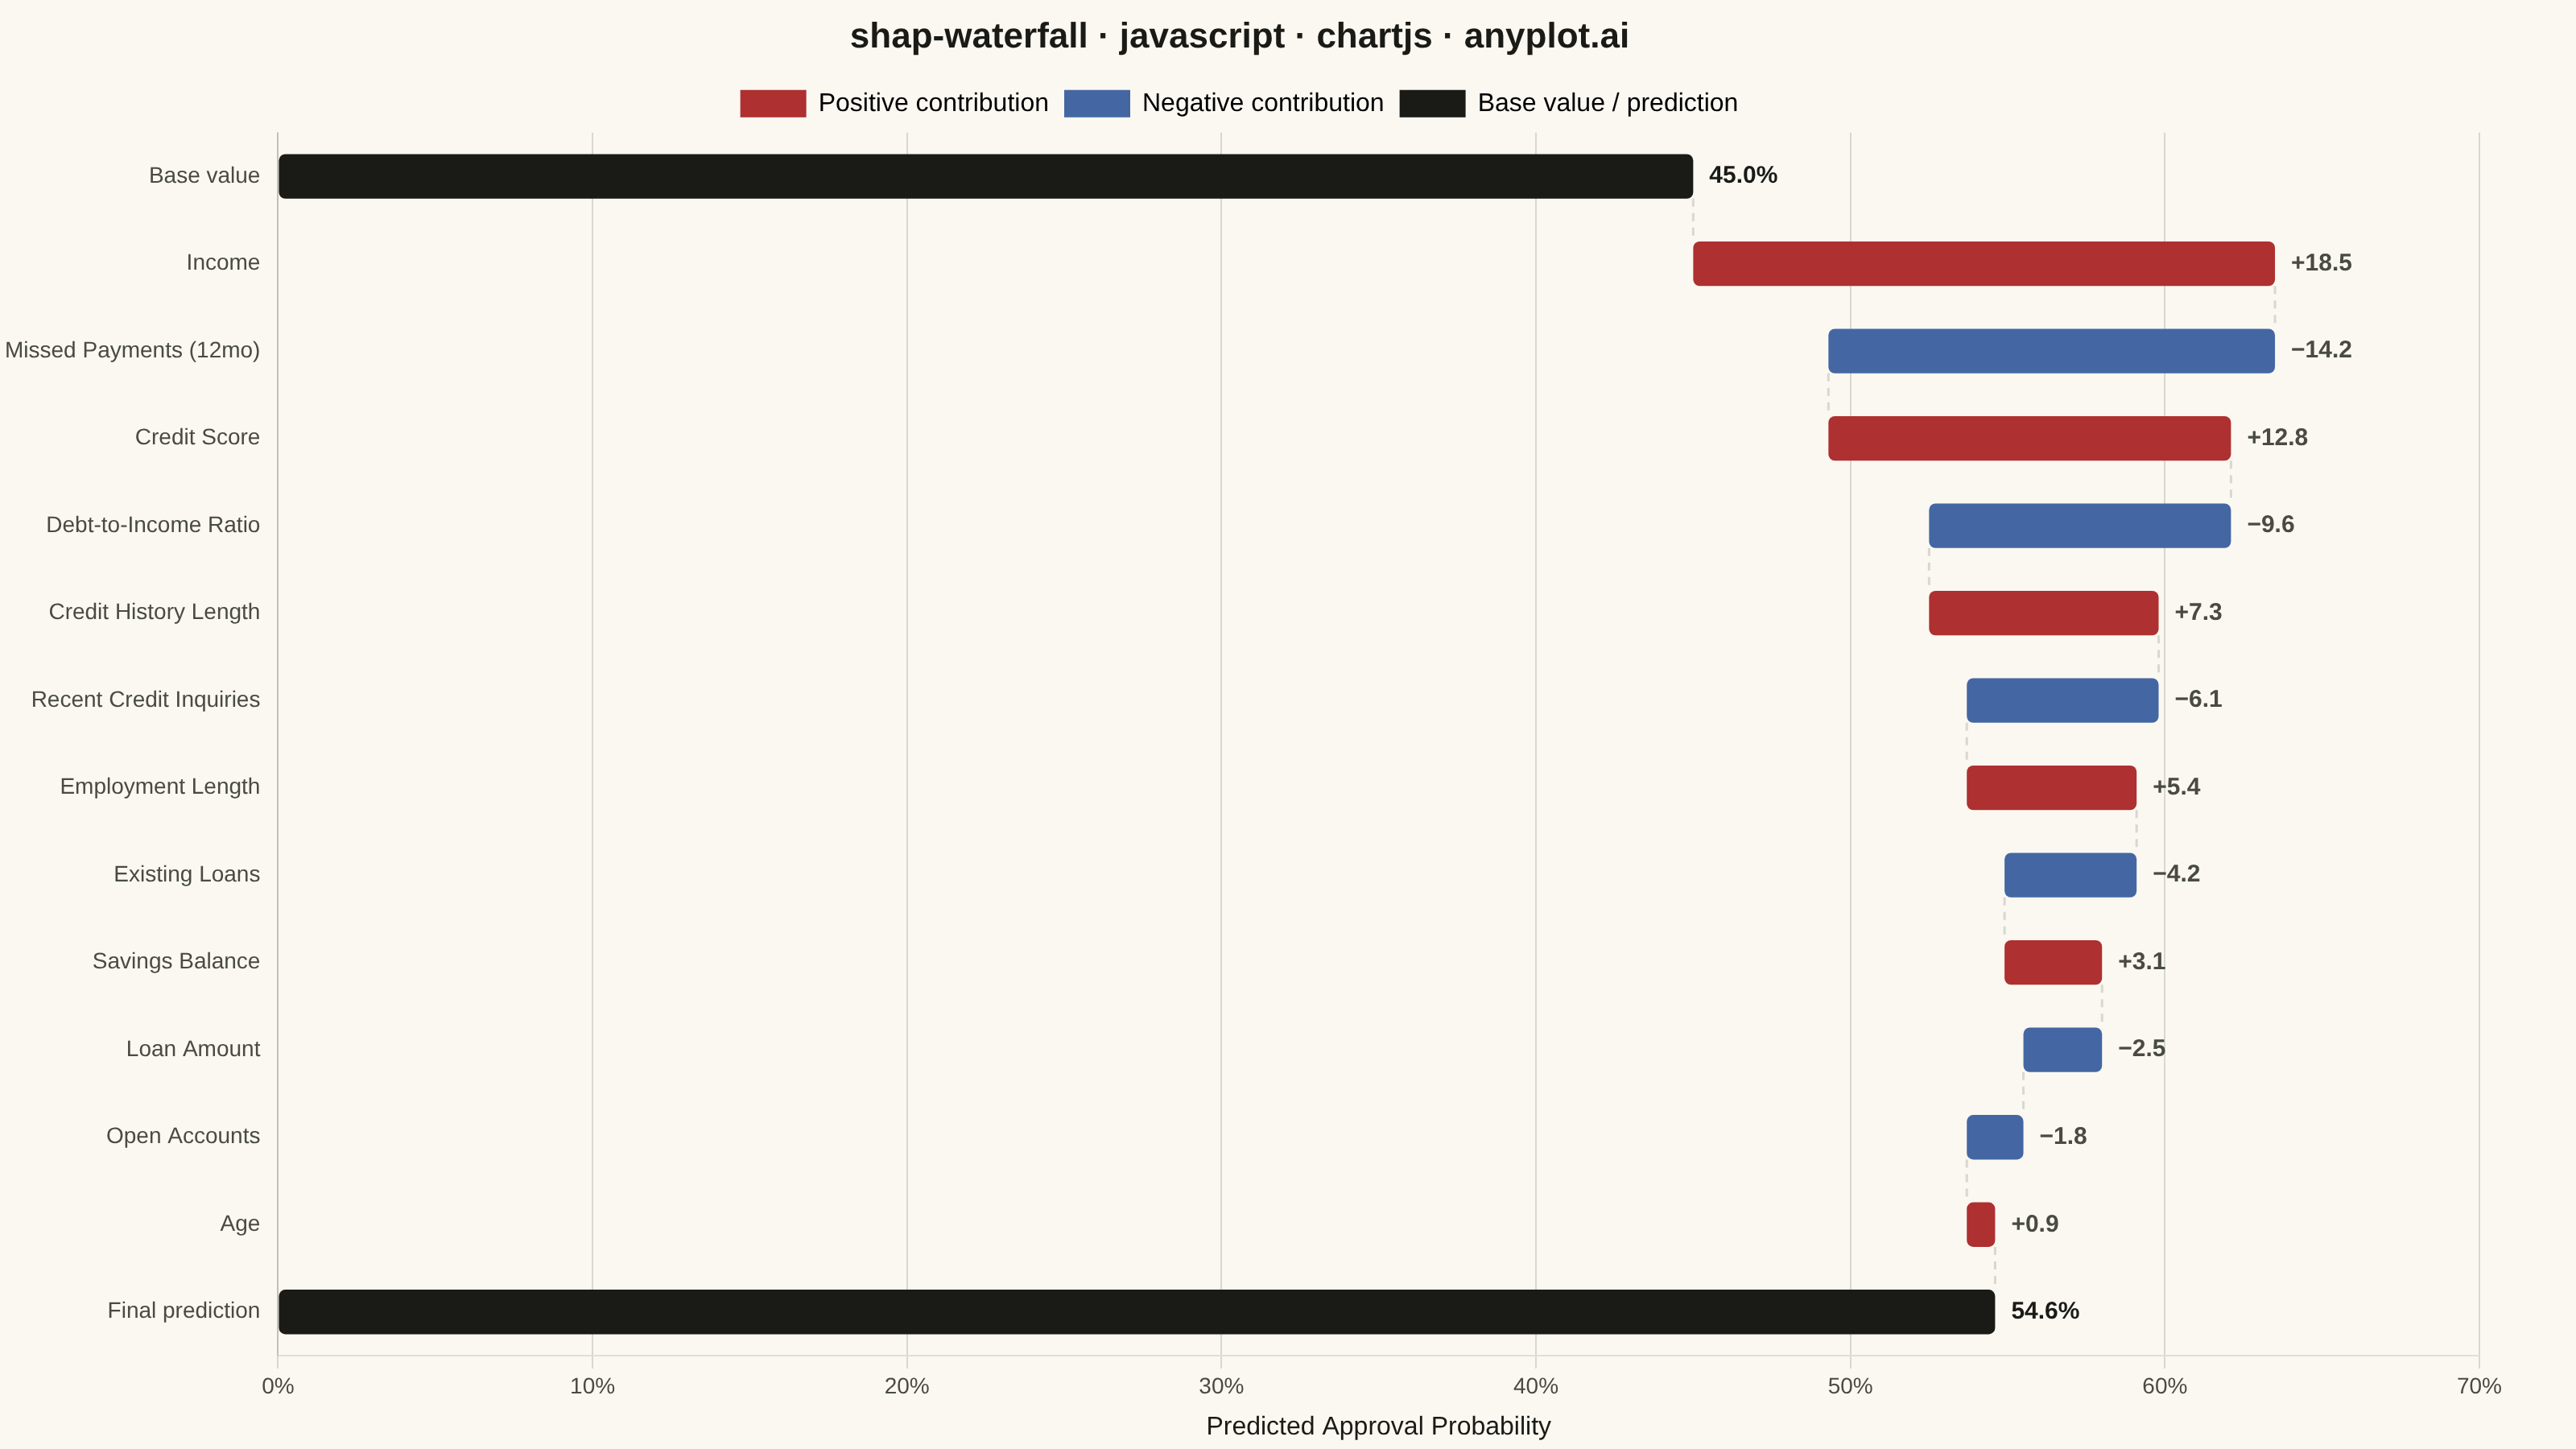
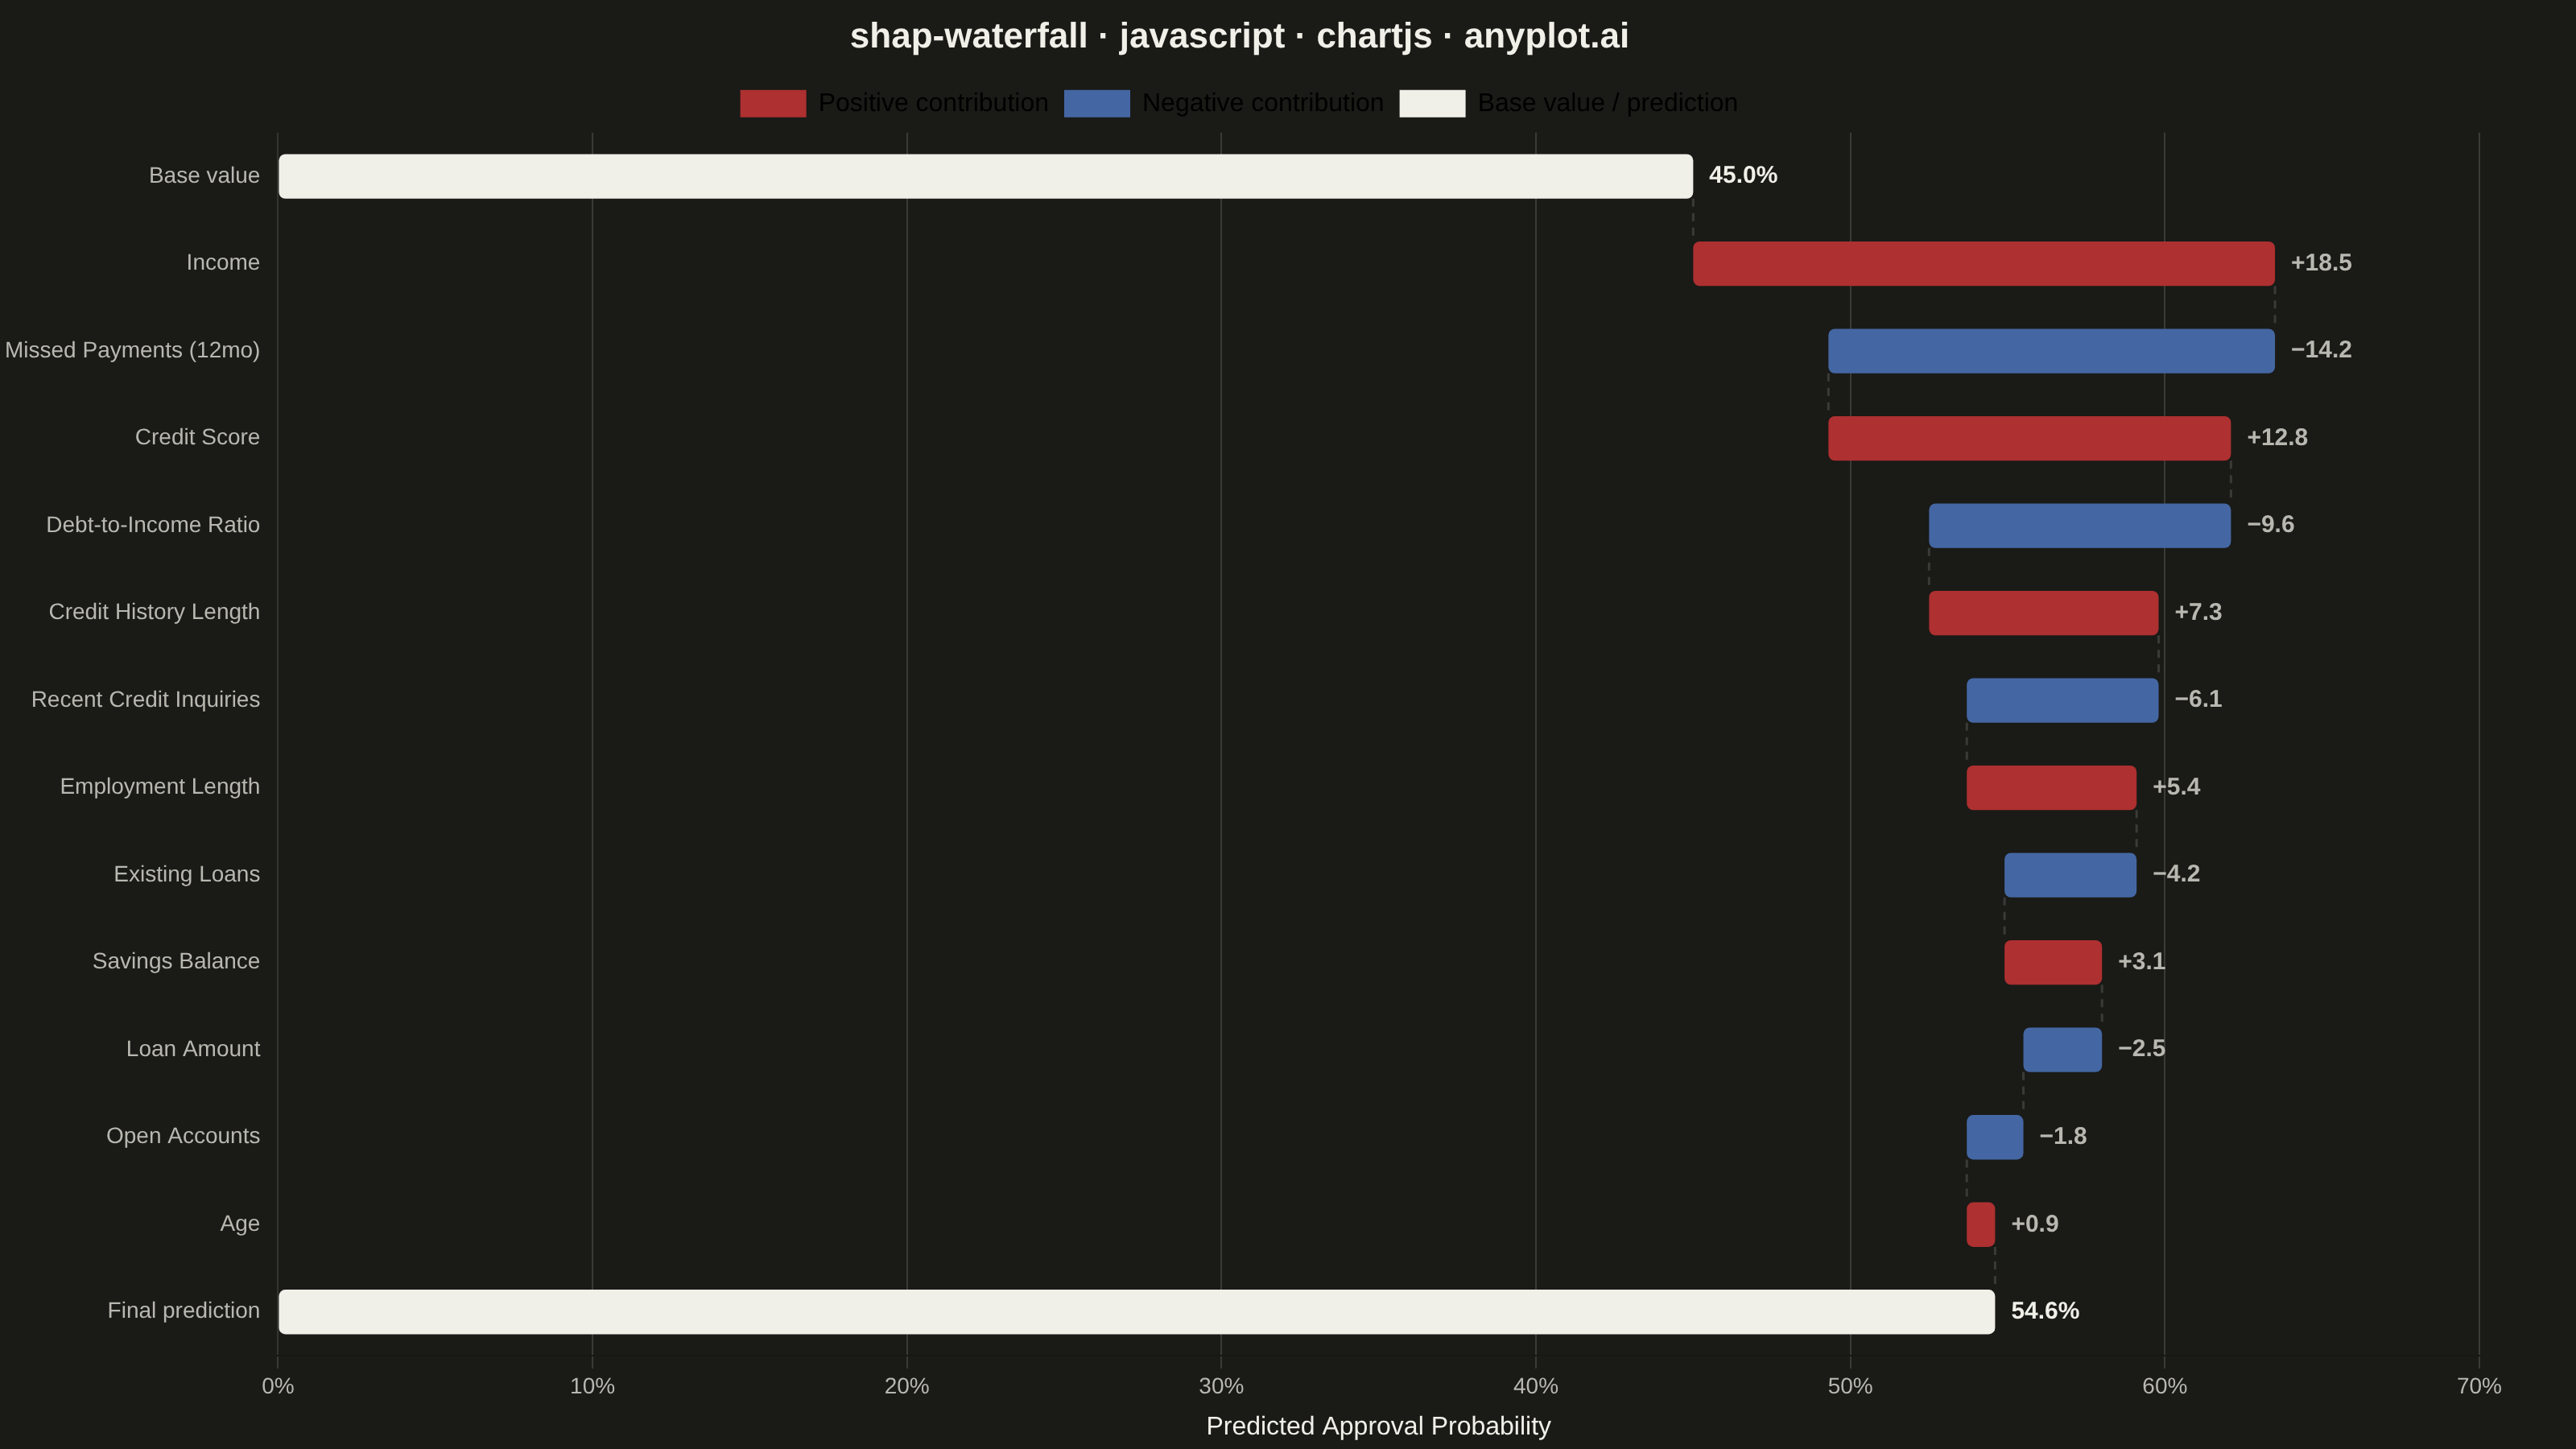
A waterfall-style chart showing how each feature contributes to pushing a model prediction from a base value (expected model output) to the final predicted value. Horizontal bar segments extend right for positive SHAP values and left for negative SHAP values, stacking cumulatively so the viewer can trace the path from baseline to prediction. This is a core ML explainability visualization for explaining individual predictions, complementing the SHAP summary plot which shows feature effects across many samples.
// anyplot.ai
// shap-waterfall: SHAP Waterfall Plot for Feature Attribution
// Library: chartjs 4.4.7 | JavaScript 22.23.2
// Quality: 91/100 | Created: 2026-09-09

const t = window.ANYPLOT_TOKENS;
const POSITIVE_COLOR = t.palette[4]; // #AE3030 matte red (Imprint) — SHAP convention: pushes prediction up
const NEGATIVE_COLOR = t.palette[2]; // #4467A3 blue (Imprint) — SHAP convention: pushes prediction down
const TOTAL_COLOR = t.ink; // neutral — theme-adaptive baseline/total anchor

// --- Data (in-memory, deterministic) ----------------------------------------
// Loan-approval model: SHAP attribution for a single applicant's predicted
// approval probability, ordered by descending absolute contribution.
const BASE_VALUE = 45.0;
const contributions = [
  { feature: "Income", shap: 18.5 },
  { feature: "Missed Payments (12mo)", shap: -14.2 },
  { feature: "Credit Score", shap: 12.8 },
  { feature: "Debt-to-Income Ratio", shap: -9.6 },
  { feature: "Credit History Length", shap: 7.3 },
  { feature: "Recent Credit Inquiries", shap: -6.1 },
  { feature: "Employment Length", shap: 5.4 },
  { feature: "Existing Loans", shap: -4.2 },
  { feature: "Savings Balance", shap: 3.1 },
  { feature: "Loan Amount", shap: -2.5 },
  { feature: "Open Accounts", shap: -1.8 },
  { feature: "Age", shap: 0.9 },
];
const FINAL_VALUE = contributions.reduce((sum, c) => sum + c.shap, BASE_VALUE);

// Build cumulative waterfall rows: a leading "Base value" total, one floating
// segment per feature (already sorted by |shap| descending), a trailing
// "Final prediction" total.
let running = BASE_VALUE;
const rows = [{ label: "Base value", start: 0, end: BASE_VALUE, kind: "total", displayValue: BASE_VALUE }];
for (const { feature, shap } of contributions) {
  const start = running;
  running += shap;
  rows.push({
    label: feature,
    start,
    end: running,
    kind: shap >= 0 ? "positive" : "negative",
    displayValue: shap,
  });
}
rows.push({ label: "Final prediction", start: 0, end: FINAL_VALUE, kind: "total", displayValue: FINAL_VALUE });

const rowColor = (row) =>
  row.kind === "total" ? TOTAL_COLOR : row.kind === "positive" ? POSITIVE_COLOR : NEGATIVE_COLOR;

// --- Mount -------------------------------------------------------------------
const canvas = document.createElement("canvas");
document.getElementById("container").appendChild(canvas);

// --- Custom plugin: cumulative-flow connectors + per-bar value labels --------
// (native Chart.js plugin API — plain canvas drawing, no external package)
const waterfallAnnotations = {
  id: "shapWaterfallAnnotations",
  afterDatasetsDraw(chart) {
    const { ctx, scales } = chart;
    const meta = chart.getDatasetMeta(0);
    const xScale = scales.x;

    ctx.save();
    ctx.setLineDash([5, 4]);
    ctx.strokeStyle = t.grid;
    ctx.lineWidth = 1.5;
    for (let i = 0; i < rows.length - 1; i++) {
      const barA = meta.data[i].getProps(["y", "height"], true);
      const barB = meta.data[i + 1].getProps(["y", "height"], true);
      const xPix = xScale.getPixelForValue(rows[i].end);
      ctx.beginPath();
      ctx.moveTo(xPix, barA.y + barA.height / 2);
      ctx.lineTo(xPix, barB.y - barB.height / 2);
      ctx.stroke();
    }
    ctx.setLineDash([]);

    ctx.font = `600 15px ${Chart.defaults.font.family}`;
    ctx.textBaseline = "middle";
    ctx.textAlign = "left";
    rows.forEach((row, i) => {
      const bar = meta.data[i].getProps(["y"], true);
      const rightEdge = Math.max(xScale.getPixelForValue(row.start), xScale.getPixelForValue(row.end));
      if (row.kind === "total") {
        ctx.fillStyle = t.ink;
        ctx.fillText(`${row.displayValue.toFixed(1)}%`, rightEdge + 10, bar.y);
      } else {
        const sign = row.displayValue > 0 ? "+" : "−";
        ctx.fillStyle = t.inkSoft;
        ctx.fillText(`${sign}${Math.abs(row.displayValue).toFixed(1)}`, rightEdge + 10, bar.y);
      }
    });
    ctx.restore();
  },
};

// --- Chart ---------------------------------------------------------------
new Chart(canvas, {
  type: "bar",
  data: {
    labels: rows.map((r) => r.label),
    datasets: [
      {
        data: rows.map((r) => [r.start, r.end]),
        backgroundColor: rows.map(rowColor),
        borderRadius: 4,
        borderSkipped: false,
        barPercentage: 0.6,
        categoryPercentage: 0.85,
      },
    ],
  },
  options: {
    indexAxis: "y",
    responsive: true,
    maintainAspectRatio: false,
    animation: false,
    layout: { padding: { right: 60 } },
    plugins: {
      title: {
        display: true,
        text: "shap-waterfall · javascript · chartjs · anyplot.ai",
        color: t.ink,
        font: { size: 22 },
      },
      legend: {
        position: "top",
        onClick: () => {},
        labels: {
          color: t.ink,
          font: { size: 16 },
          generateLabels: () => [
            { text: "Positive contribution", fillStyle: POSITIVE_COLOR, strokeStyle: POSITIVE_COLOR, index: 0 },
            { text: "Negative contribution", fillStyle: NEGATIVE_COLOR, strokeStyle: NEGATIVE_COLOR, index: 1 },
            { text: "Base value / prediction", fillStyle: TOTAL_COLOR, strokeStyle: TOTAL_COLOR, index: 2 },
          ],
        },
      },
      tooltip: {
        callbacks: {
          title: () => "",
          label: (ctx) => {
            const row = rows[ctx.dataIndex];
            if (row.kind === "total") return `${row.label}: ${row.displayValue.toFixed(1)}%`;
            const sign = row.displayValue > 0 ? "+" : "";
            return `${row.label}: ${sign}${row.displayValue.toFixed(1)} pts`;
          },
        },
      },
    },
    scales: {
      x: {
        min: 0,
        max: Math.ceil((Math.max(...rows.map((r) => Math.max(r.start, r.end))) * 1.1) / 10) * 10,
        ticks: { color: t.inkSoft, font: { size: 14 }, callback: (v) => `${v}%` },
        grid: { color: t.grid },
        title: { display: true, text: "Predicted Approval Probability", color: t.ink, font: { size: 16 } },
      },
      y: {
        ticks: { color: t.inkSoft, font: { size: 14 } },
        grid: { display: false },
      },
    },
  },
  plugins: [waterfallAnnotations],
});
Runnable source as JSON, for any HTTP client: https://api.anyplot.ai/specs/shap-waterfall/chartjs/code. Any spec id and library id listed in llms-full.txt fit the same URL shape; every URL below is complete and callable.
{
  "spec_id": "shap-waterfall",
  "language": "javascript",
  "library": "chartjs",
  "page": "https://anyplot.ai/shap-waterfall/javascript/chartjs",
  "hub": "https://anyplot.ai/shap-waterfall",
  "code_json": "https://api.anyplot.ai/specs/shap-waterfall/chartjs/code",
  "spec_json": "https://api.anyplot.ai/specs/shap-waterfall",
  "render_light_png": "https://storage.googleapis.com/anyplot-images/plots/shap-waterfall/javascript/chartjs/plot-light.png",
  "render_dark_png": "https://storage.googleapis.com/anyplot-images/plots/shap-waterfall/javascript/chartjs/plot-dark.png",
  "interactive_light_html": "https://storage.googleapis.com/anyplot-images/plots/shap-waterfall/javascript/chartjs/plot-light.html",
  "interactive_dark_html": "https://storage.googleapis.com/anyplot-images/plots/shap-waterfall/javascript/chartjs/plot-dark.html",
  "quality_score": 91.0,
  "license": "MIT",
  "guide": "https://anyplot.ai/llms.txt"
}
Part of SHAP Waterfall Plot for Feature Attribution on anyplot.ai.