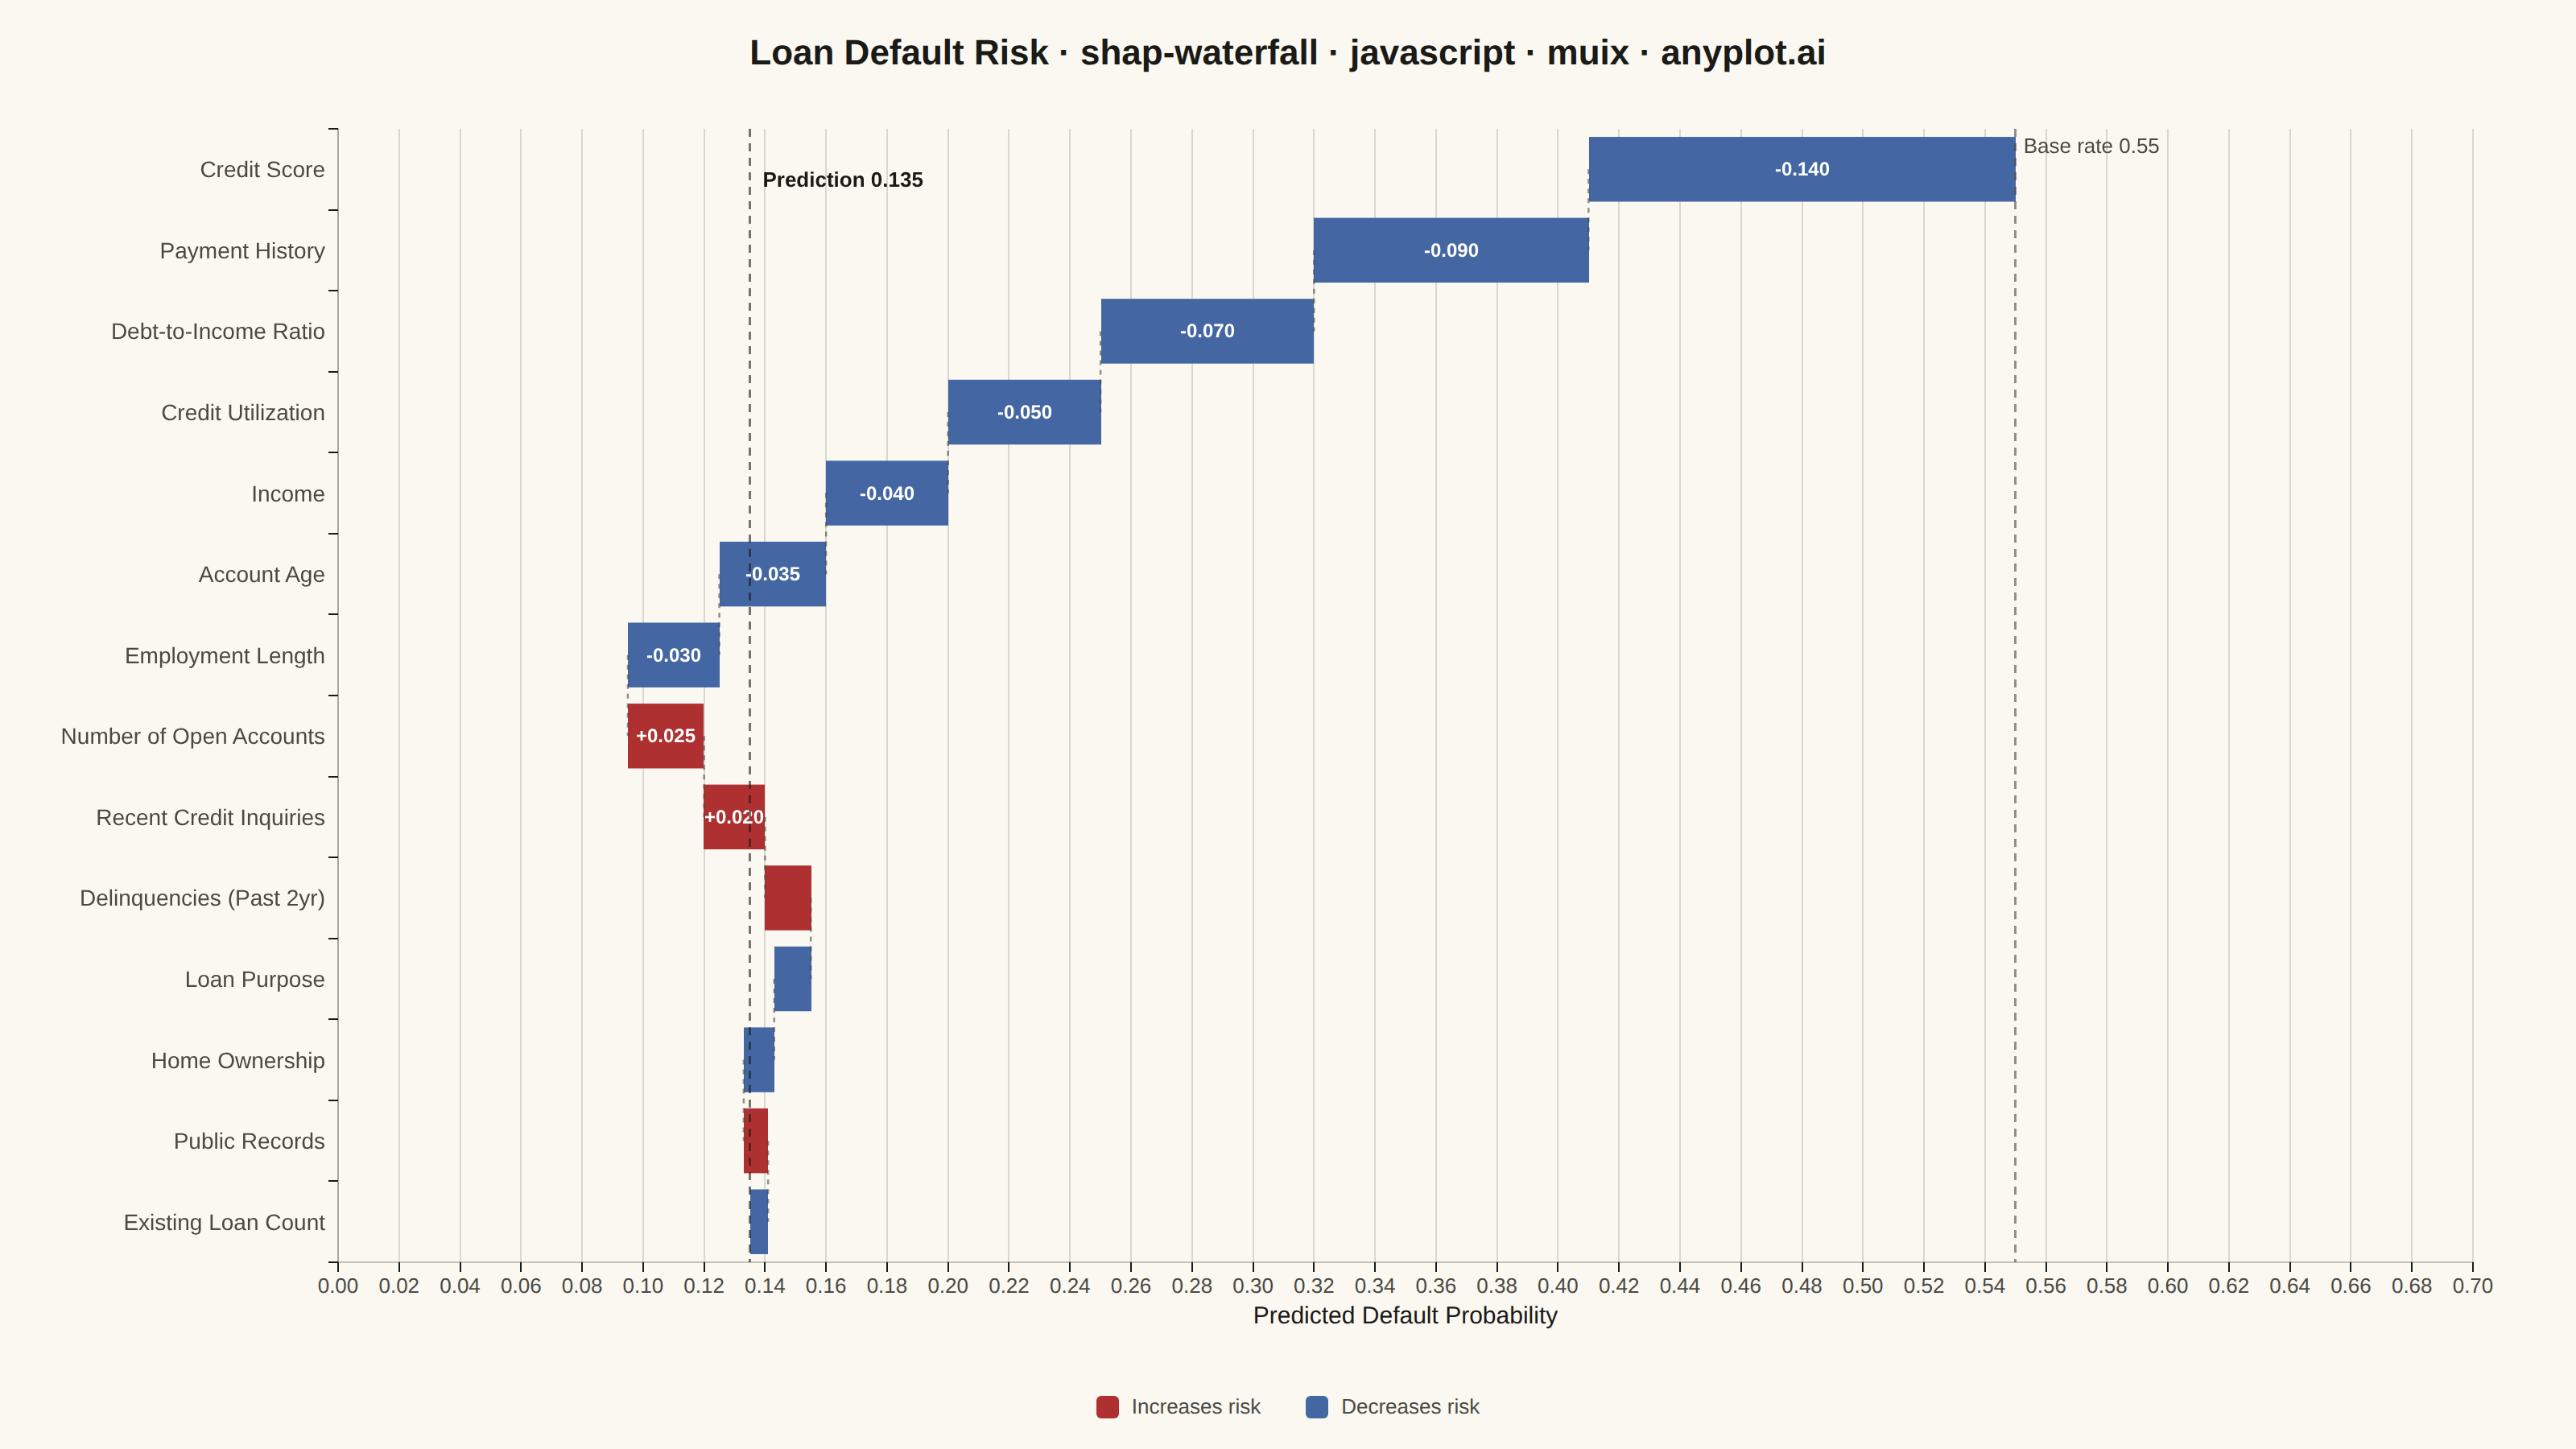
The same plot in 14 other libraries — JavaScript: Chart.js, D3.js, Apache ECharts, Highcharts; Python: Altair, Bokeh, lets-plot, Matplotlib, Plotly, plotnine, Pygal, Seaborn; R: ggplot2; Julia: Makie.jl. Compare all 15 side by side: SHAP Waterfall Plot for Feature Attribution in Python, R, Julia and JavaScript.
A waterfall-style chart showing how each feature contributes to pushing a model prediction from a base value (expected model output) to the final predicted value. Horizontal bar segments extend right for positive SHAP values and left for negative SHAP values, stacking cumulatively so the viewer can trace the path from baseline to prediction. This is a core ML explainability visualization for explaining individual predictions, complementing the SHAP summary plot which shows feature effects across many samples.
// anyplot.ai
// shap-waterfall: SHAP Waterfall Plot for Feature Attribution
// Library: muix 7.29.1 | JavaScript 22.23.2
// Quality: 86/100 | Created: 2026-09-09
import { BarChart } from "@mui/x-charts/BarChart";
import { ChartsReferenceLine } from "@mui/x-charts/ChartsReferenceLine";
import { useXScale, useYScale } from "@mui/x-charts/hooks";
import Box from "@mui/material/Box";
import Typography from "@mui/material/Typography";

const t = window.ANYPLOT_TOKENS;

// --- Data (in-memory, deterministic) ----------------------------------------
// A credit-scoring model's predicted probability of loan default for one
// applicant, decomposed into per-feature SHAP contributions. Rows are ordered
// by descending |SHAP value| (largest driver first), matching how SHAP
// waterfalls are conventionally read from top to bottom.
const BASE_VALUE = 0.55; // expected default probability across the training population
const FINAL_VALUE = 0.135; // this applicant's actual predicted default probability

const ROWS = [
  { feature: "Credit Score", shap: -0.14, start: 0.55, end: 0.41 },
  { feature: "Payment History", shap: -0.09, start: 0.41, end: 0.32 },
  { feature: "Debt-to-Income Ratio", shap: -0.07, start: 0.32, end: 0.25 },
  { feature: "Credit Utilization", shap: -0.05, start: 0.25, end: 0.2 },
  { feature: "Income", shap: -0.04, start: 0.2, end: 0.16 },
  { feature: "Account Age", shap: -0.035, start: 0.16, end: 0.125 },
  { feature: "Employment Length", shap: -0.03, start: 0.125, end: 0.095 },
  { feature: "Number of Open Accounts", shap: 0.025, start: 0.095, end: 0.12 },
  { feature: "Recent Credit Inquiries", shap: 0.02, start: 0.12, end: 0.14 },
  { feature: "Delinquencies (Past 2yr)", shap: 0.015, start: 0.14, end: 0.155 },
  { feature: "Loan Purpose", shap: -0.012, start: 0.155, end: 0.143 },
  { feature: "Home Ownership", shap: -0.01, start: 0.143, end: 0.133 },
  { feature: "Public Records", shap: 0.008, start: 0.133, end: 0.141 },
  { feature: "Existing Loan Count", shap: -0.006, start: 0.141, end: 0.135 },
];

// MUI X BarChart has no native floating-bar mode, so each waterfall segment
// is built from a transparent "offset" bar (raises the stack to the lower of
// start/end) topped by a colored "increase" or "decrease" bar sized to the
// SHAP magnitude — the standard stacked-bar waterfall technique.
const CATEGORIES = ROWS.map((r) => r.feature);
const OFFSET = ROWS.map((r) => Math.min(r.start, r.end));
const INCREASE = ROWS.map((r) => (r.shap > 0 ? Math.abs(r.end - r.start) : 0));
const DECREASE = ROWS.map((r) => (r.shap < 0 ? Math.abs(r.end - r.start) : 0));

const RISK_UP = t.palette[4]; // matte red — positive SHAP, pushes default risk up
const RISK_DOWN = t.palette[2]; // blue — negative SHAP, pushes default risk down

function formatSigned(value: number): string {
  return `${value > 0 ? "+" : ""}${value.toFixed(3)}`;
}

// Connects the end of each bar to the start of the next — same x value, one
// row apart — to make the cumulative "staircase" flow from base to final
// value easy to trace, per the spec's "connector line" suggestion.
function ConnectorLines() {
  const xScale = useXScale() as any;
  const yScale = useYScale() as any;
  if (!xScale || !yScale) return null;
  const bandwidth = yScale.bandwidth ? yScale.bandwidth() : 0;

  return (
    <g>
      {ROWS.slice(0, -1).map((row, i) => {
        const next = ROWS[i + 1];
        const x = xScale(row.end);
        const y1 = (yScale(row.feature) ?? 0) + bandwidth / 2;
        const y2 = (yScale(next.feature) ?? 0) + bandwidth / 2;
        return (
          <line
            key={row.feature}
            x1={x}
            y1={y1}
            x2={x}
            y2={y2}
            stroke={t.inkSoft}
            strokeWidth={1.25}
            strokeDasharray="3 3"
            strokeOpacity={0.6}
          />
        );
      })}
    </g>
  );
}

const TITLE = "Loan Default Risk · shap-waterfall · javascript · muix · anyplot.ai";

// --- Chart (default-exported component — the harness mounts it) ------------
export default function Chart() {
  const W = window.ANYPLOT_SIZE.width;
  const H = window.ANYPLOT_SIZE.height;
  const titleSize = TITLE.length > 67 ? Math.max(14, Math.round((22 * 67) / TITLE.length)) : 22;

  const TITLE_H = 64;
  const LEGEND_H = 52;
  const chartH = H - TITLE_H - LEGEND_H;

  return (
    <Box
      sx={{
        width: W,
        height: H,
        bgcolor: t.pageBg,
        display: "flex",
        flexDirection: "column",
        fontFamily: "'Roboto', 'Helvetica Neue', Arial, sans-serif",
        boxSizing: "border-box",
      }}
    >
      <Box sx={{ height: TITLE_H, display: "flex", alignItems: "center", justifyContent: "center" }}>
        <Typography sx={{ color: t.ink, fontSize: titleSize, fontWeight: 600 }}>{TITLE}</Typography>
      </Box>

      <BarChart
        width={W}
        height={chartH}
        layout="horizontal"
        skipAnimation
        margin={{ top: 16, right: 64, bottom: 64, left: 210 }}
        series={[
          { id: "offset", data: OFFSET, stack: "waterfall", color: "transparent" },
          {
            id: "increase",
            label: "Increases risk",
            data: INCREASE,
            stack: "waterfall",
            color: RISK_UP,
            valueFormatter: (v, ctx) => (v ? formatSigned(ROWS[ctx.dataIndex].shap) : null),
          },
          {
            id: "decrease",
            label: "Decreases risk",
            data: DECREASE,
            stack: "waterfall",
            color: RISK_DOWN,
            valueFormatter: (v, ctx) => (v ? formatSigned(ROWS[ctx.dataIndex].shap) : null),
          },
        ]}
        xAxis={[
          {
            min: 0,
            max: 0.7,
            label: "Predicted Default Probability",
            valueFormatter: (v: number) => v.toFixed(2),
            tickLabelStyle: { fontSize: 13, fill: t.inkSoft },
            labelStyle: { fontSize: 15, fill: t.ink },
          },
        ]}
        yAxis={[
          {
            scaleType: "band",
            data: CATEGORIES,
            tickLabelStyle: { fontSize: 14, fill: t.inkSoft },
          },
        ]}
        grid={{ vertical: true }}
        barLabel={(item, context) => {
          if (item.seriesId === "offset" || item.value == null || item.value === 0) return null;
          if (context.bar.width < 30) return null;
          return formatSigned(ROWS[item.dataIndex].shap);
        }}
        slotProps={{
          legend: { hidden: true },
          barLabel: { style: { fill: "#FFFFFF", fontSize: 12, fontWeight: 600 } },
        }}
        sx={{
          "& .MuiChartsAxis-line": { stroke: t.inkSoft, strokeOpacity: 0.25 },
          "& .MuiChartsGrid-line": { stroke: t.grid },
        }}
      >
        <ChartsReferenceLine
          x={BASE_VALUE}
          label={`Base rate ${BASE_VALUE.toFixed(2)}`}
          labelAlign="start"
          lineStyle={{ stroke: t.inkSoft, strokeDasharray: "5 4", strokeWidth: 1.25, strokeOpacity: 0.6 }}
          labelStyle={{ fill: t.inkSoft, fontSize: 13 }}
        />
        <ChartsReferenceLine
          x={FINAL_VALUE}
          label={`Prediction ${FINAL_VALUE.toFixed(3)}`}
          labelAlign="start"
          spacing={{ x: 8, y: 26 }}
          lineStyle={{ stroke: t.ink, strokeDasharray: "5 4", strokeWidth: 1.25, strokeOpacity: 0.6 }}
          labelStyle={{ fill: t.ink, fontSize: 13, fontWeight: 600 }}
        />
        <ConnectorLines />
      </BarChart>

      <Box sx={{ height: LEGEND_H, display: "flex", alignItems: "center", justifyContent: "center", gap: "28px" }}>
        {[
          { label: "Increases risk", color: RISK_UP },
          { label: "Decreases risk", color: RISK_DOWN },
        ].map((entry) => (
          <Box key={entry.label} sx={{ display: "flex", alignItems: "center", gap: "8px" }}>
            <Box sx={{ width: 14, height: 14, borderRadius: "3px", bgcolor: entry.color }} />
            <Typography sx={{ color: t.inkSoft, fontSize: 13, fontWeight: 500 }}>{entry.label}</Typography>
          </Box>
        ))}
      </Box>
    </Box>
  );
}
Runnable source as JSON, for any HTTP client: https://api.anyplot.ai/specs/shap-waterfall/muix/code. Any spec id and library id listed in llms-full.txt fit the same URL shape; every URL below is complete and callable.
{
  "spec_id": "shap-waterfall",
  "language": "javascript",
  "library": "muix",
  "page": "https://anyplot.ai/shap-waterfall/javascript/muix",
  "hub": "https://anyplot.ai/shap-waterfall",
  "code_json": "https://api.anyplot.ai/specs/shap-waterfall/muix/code",
  "spec_json": "https://api.anyplot.ai/specs/shap-waterfall",
  "render_light_png": "https://storage.googleapis.com/anyplot-images/plots/shap-waterfall/javascript/muix/plot-light.png",
  "render_dark_png": "https://storage.googleapis.com/anyplot-images/plots/shap-waterfall/javascript/muix/plot-dark.png",
  "interactive_light_html": "https://storage.googleapis.com/anyplot-images/plots/shap-waterfall/javascript/muix/plot-light.html",
  "interactive_dark_html": "https://storage.googleapis.com/anyplot-images/plots/shap-waterfall/javascript/muix/plot-dark.html",
  "quality_score": 86.0,
  "license": "MIT",
  "guide": "https://anyplot.ai/llms.txt"
}
Part of SHAP Waterfall Plot for Feature Attribution on anyplot.ai.