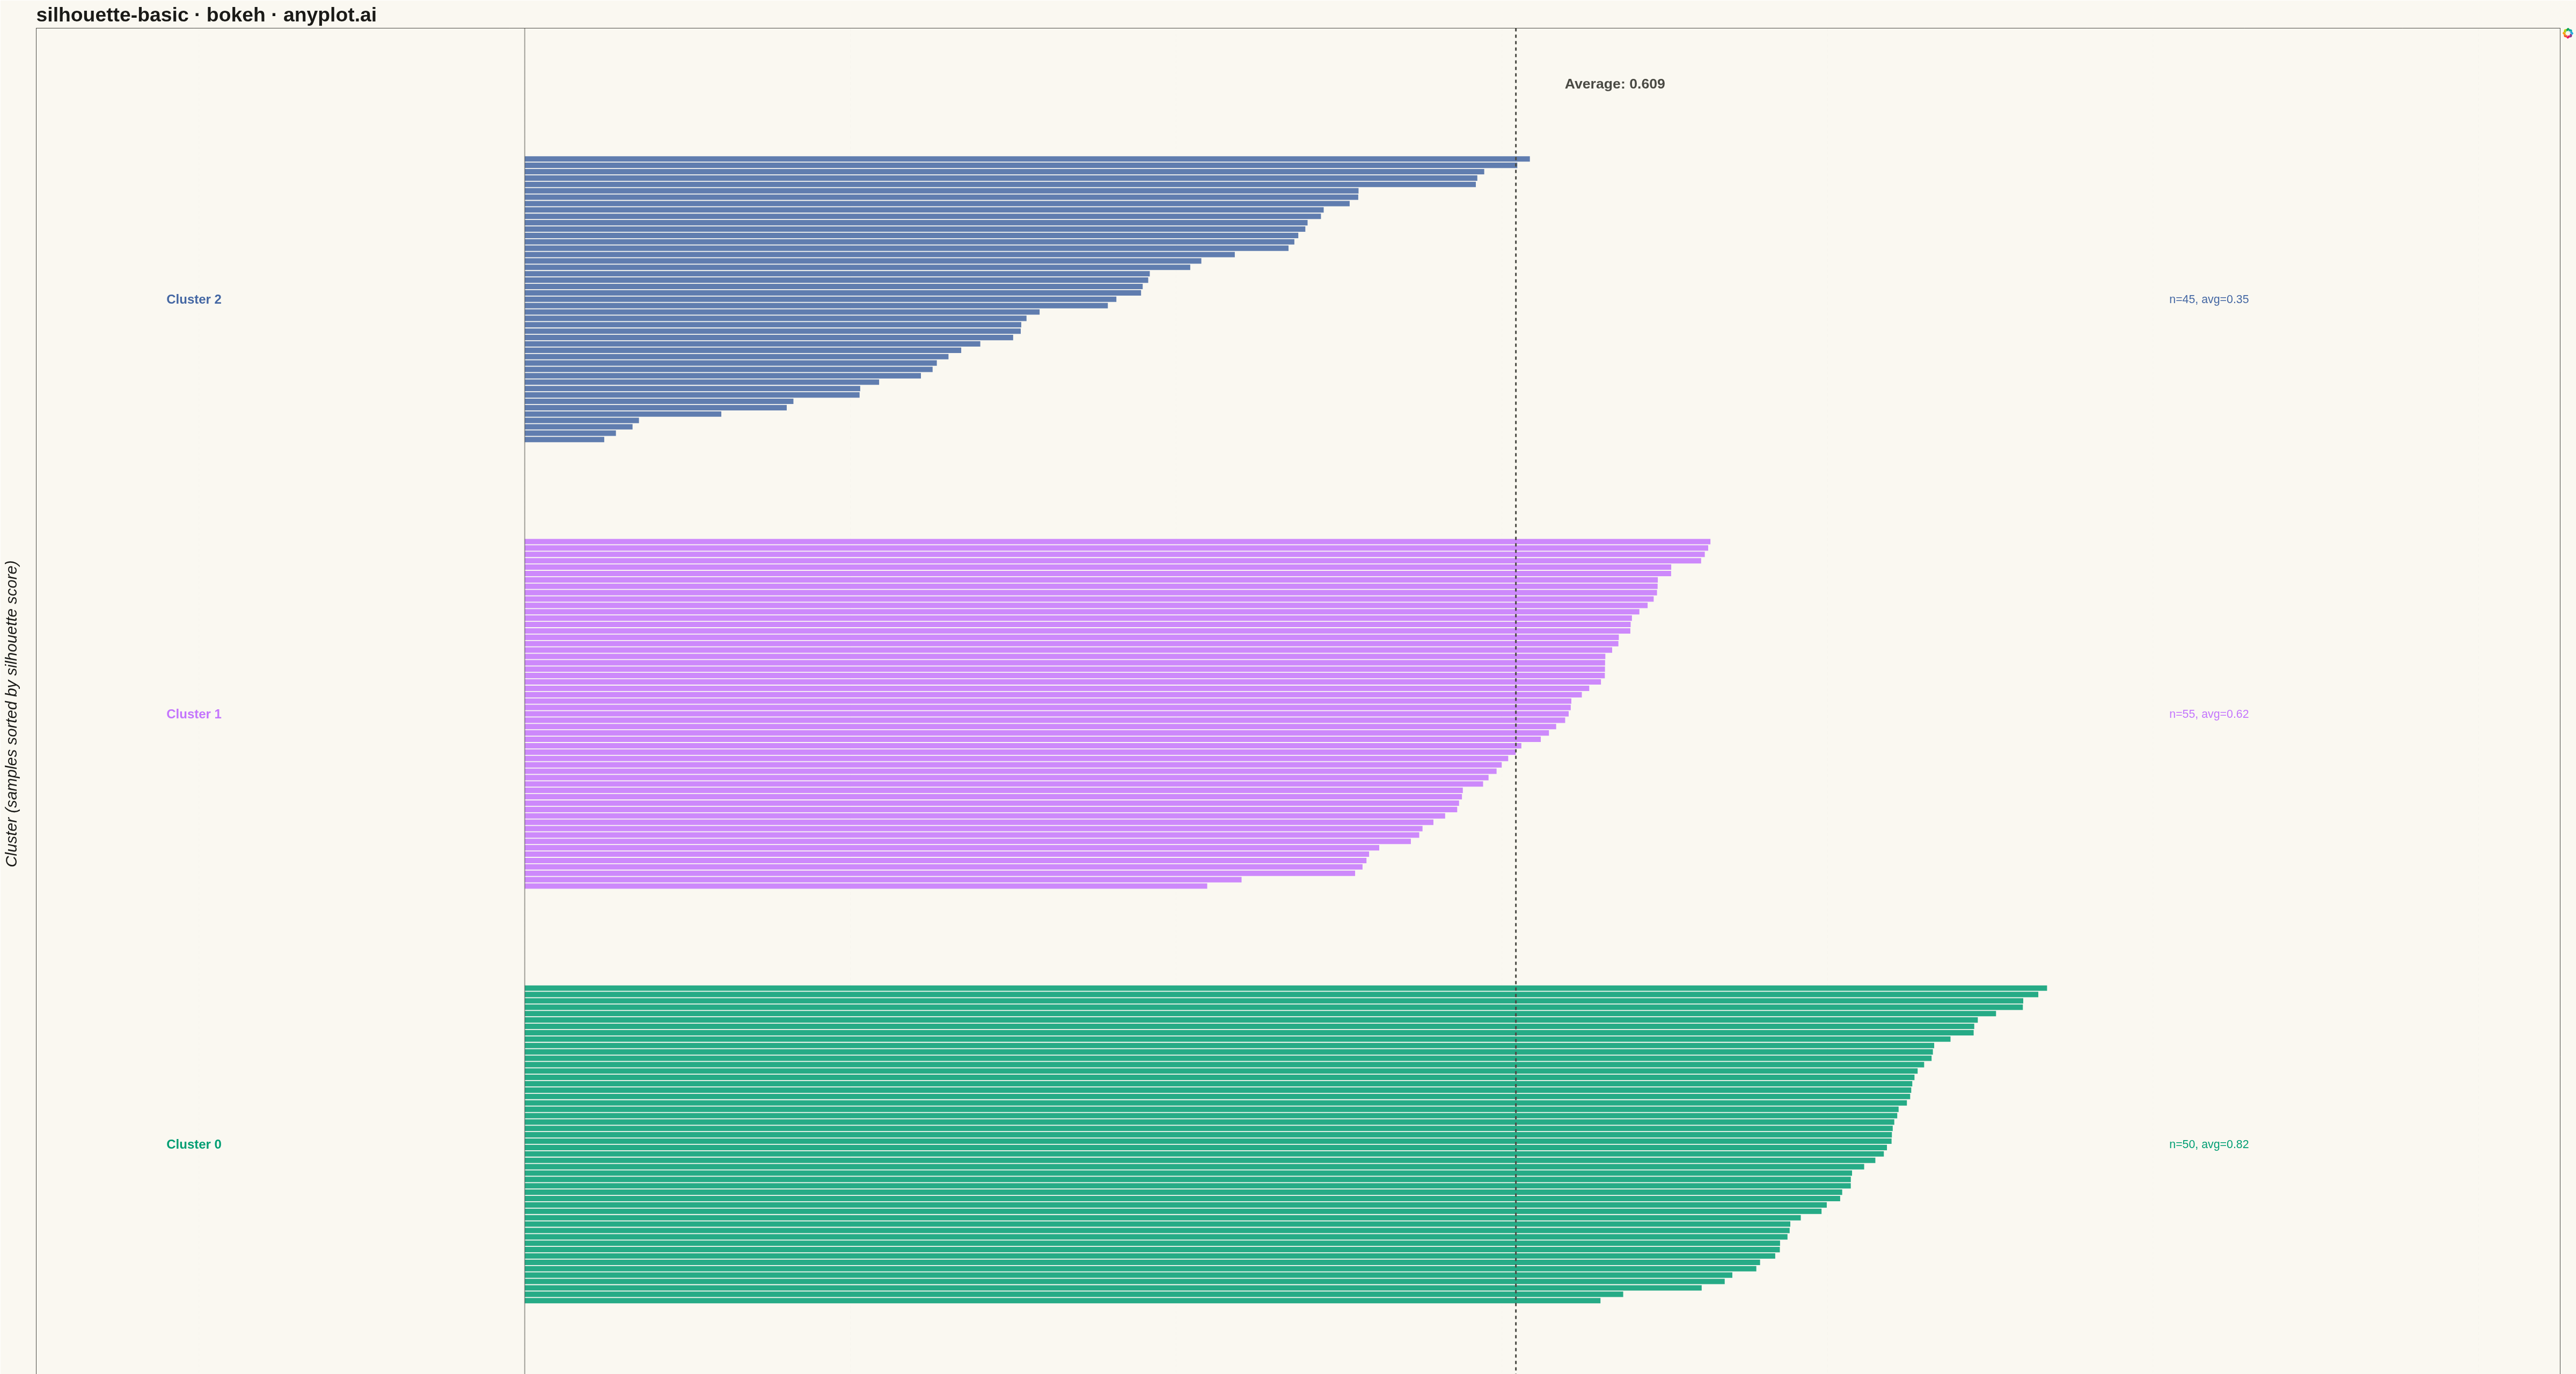
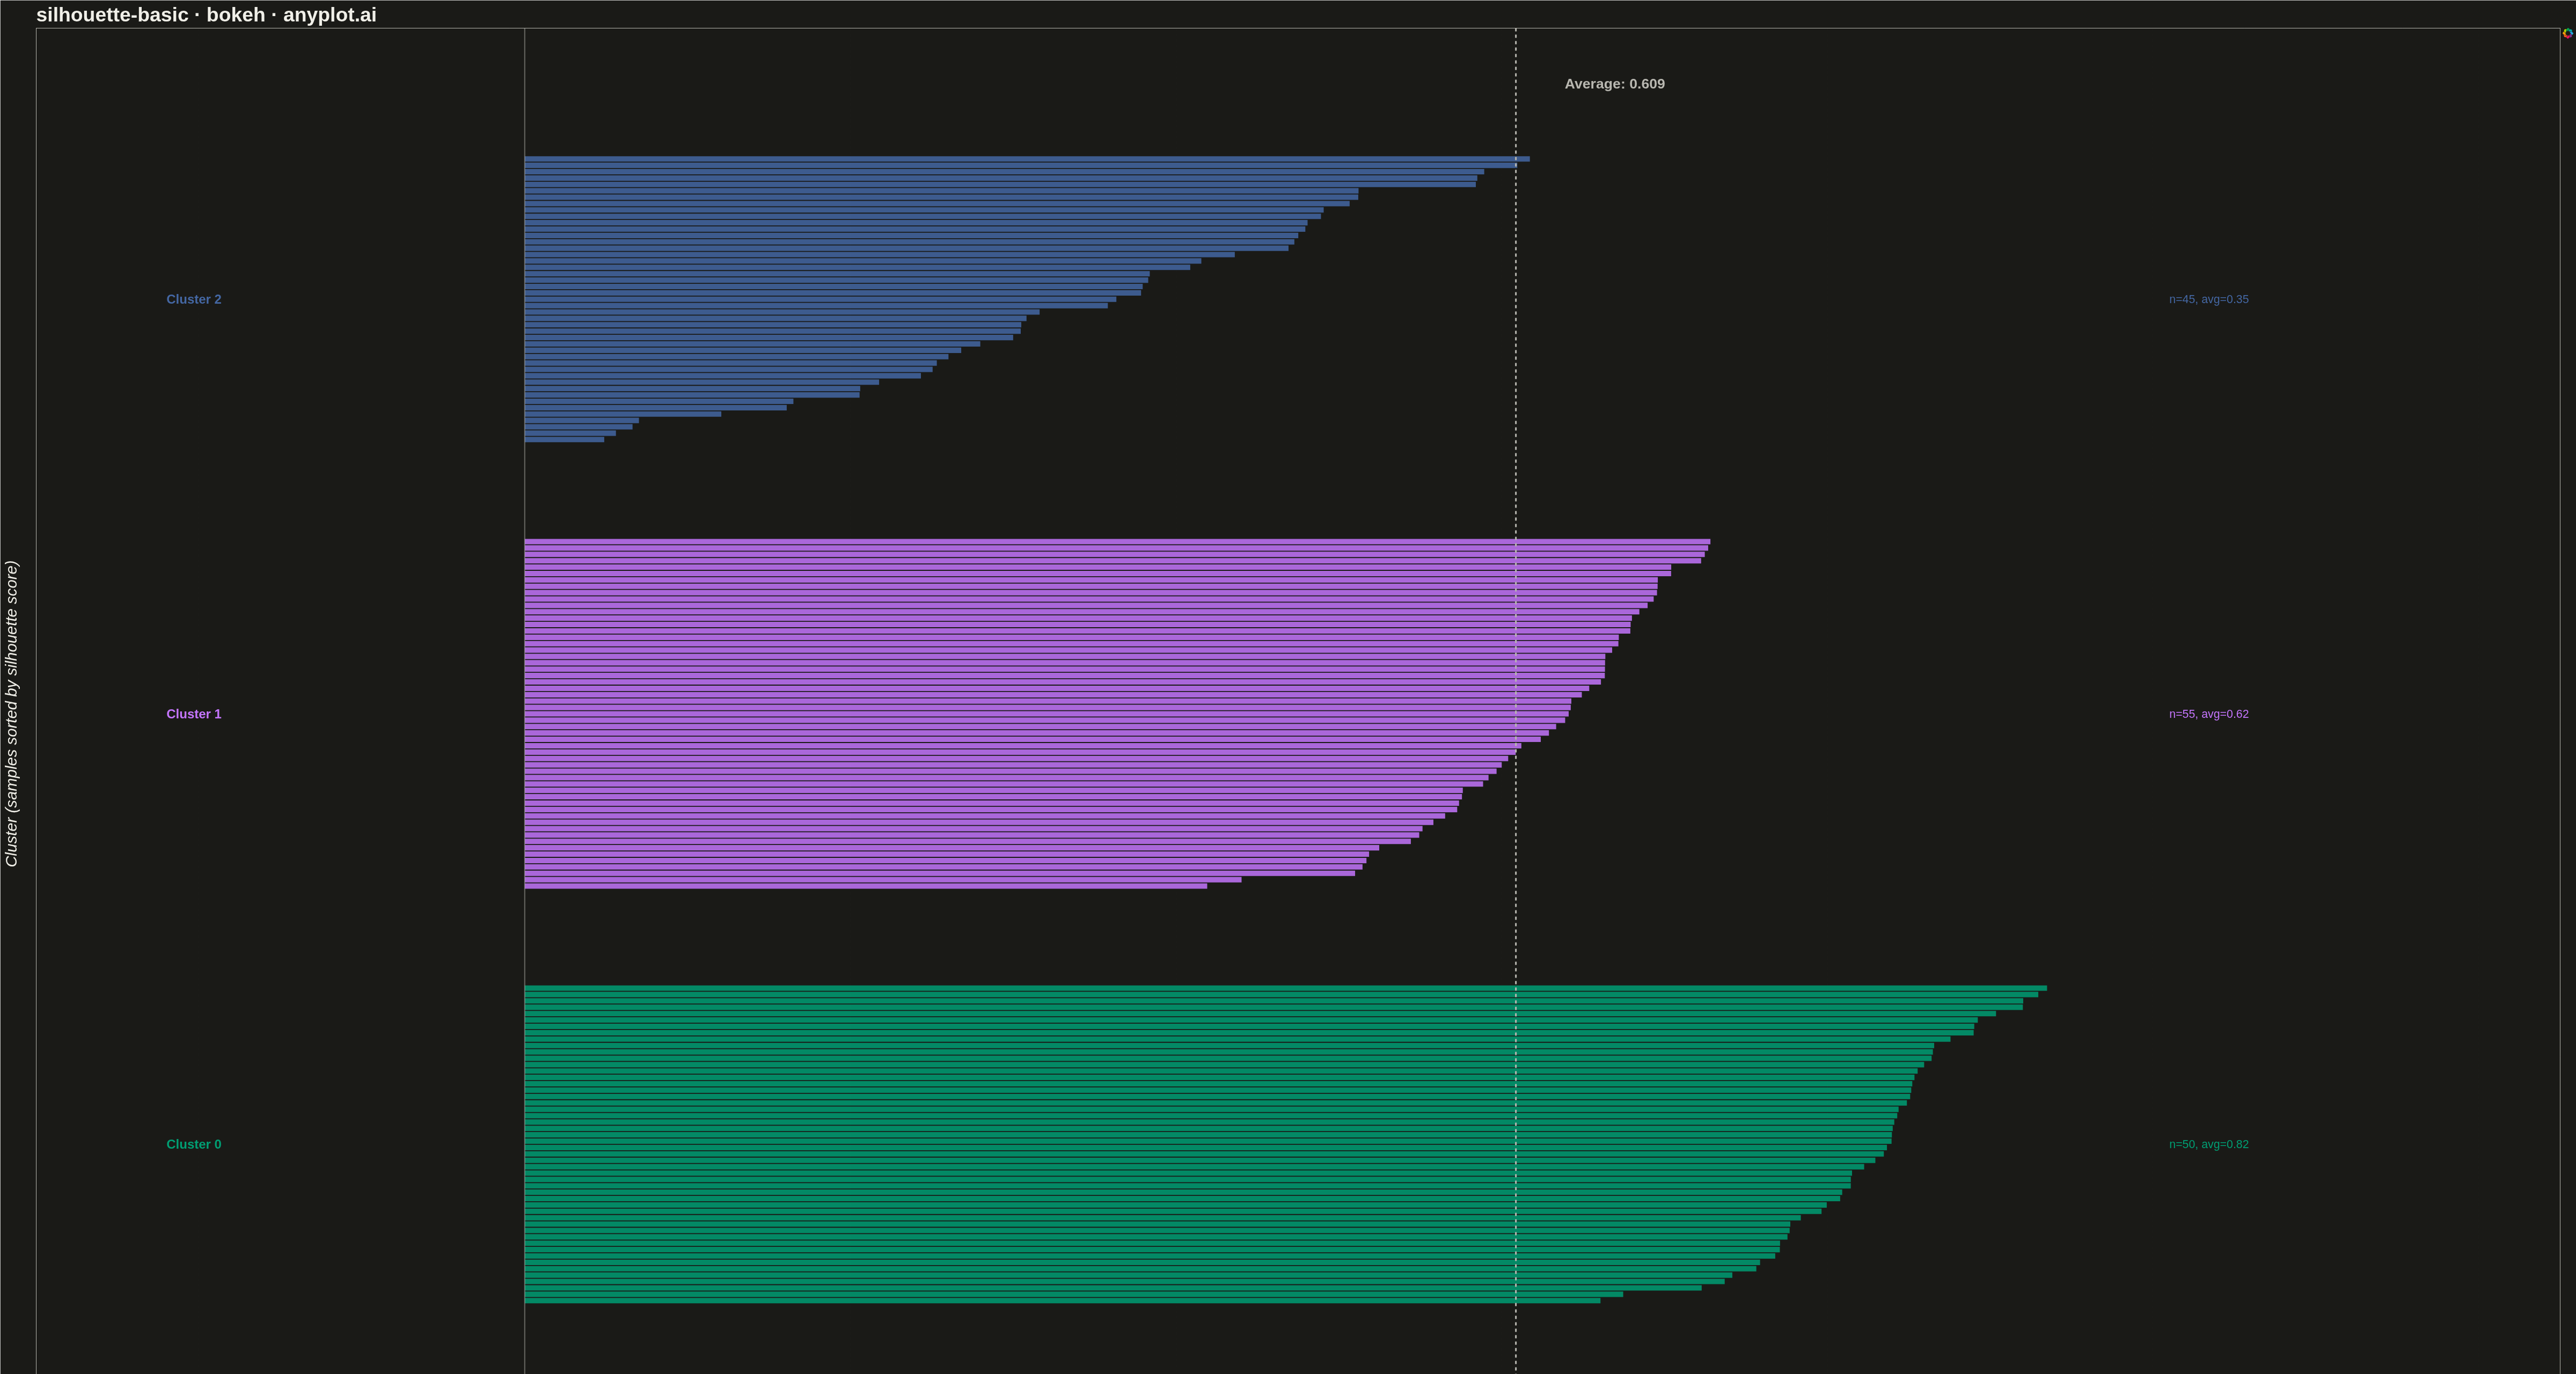
A silhouette plot visualizes the quality of clustering results by showing the silhouette coefficient for each sample, grouped by cluster assignment. Each horizontal bar represents a sample's silhouette score (-1 to 1), where positive values indicate good cluster membership and negative values suggest potential misclassification. This visualization helps evaluate cluster cohesion (how similar samples are to their own cluster) and separation (how distinct they are from neighboring clusters).
Preview render from the Bokeh implementation.