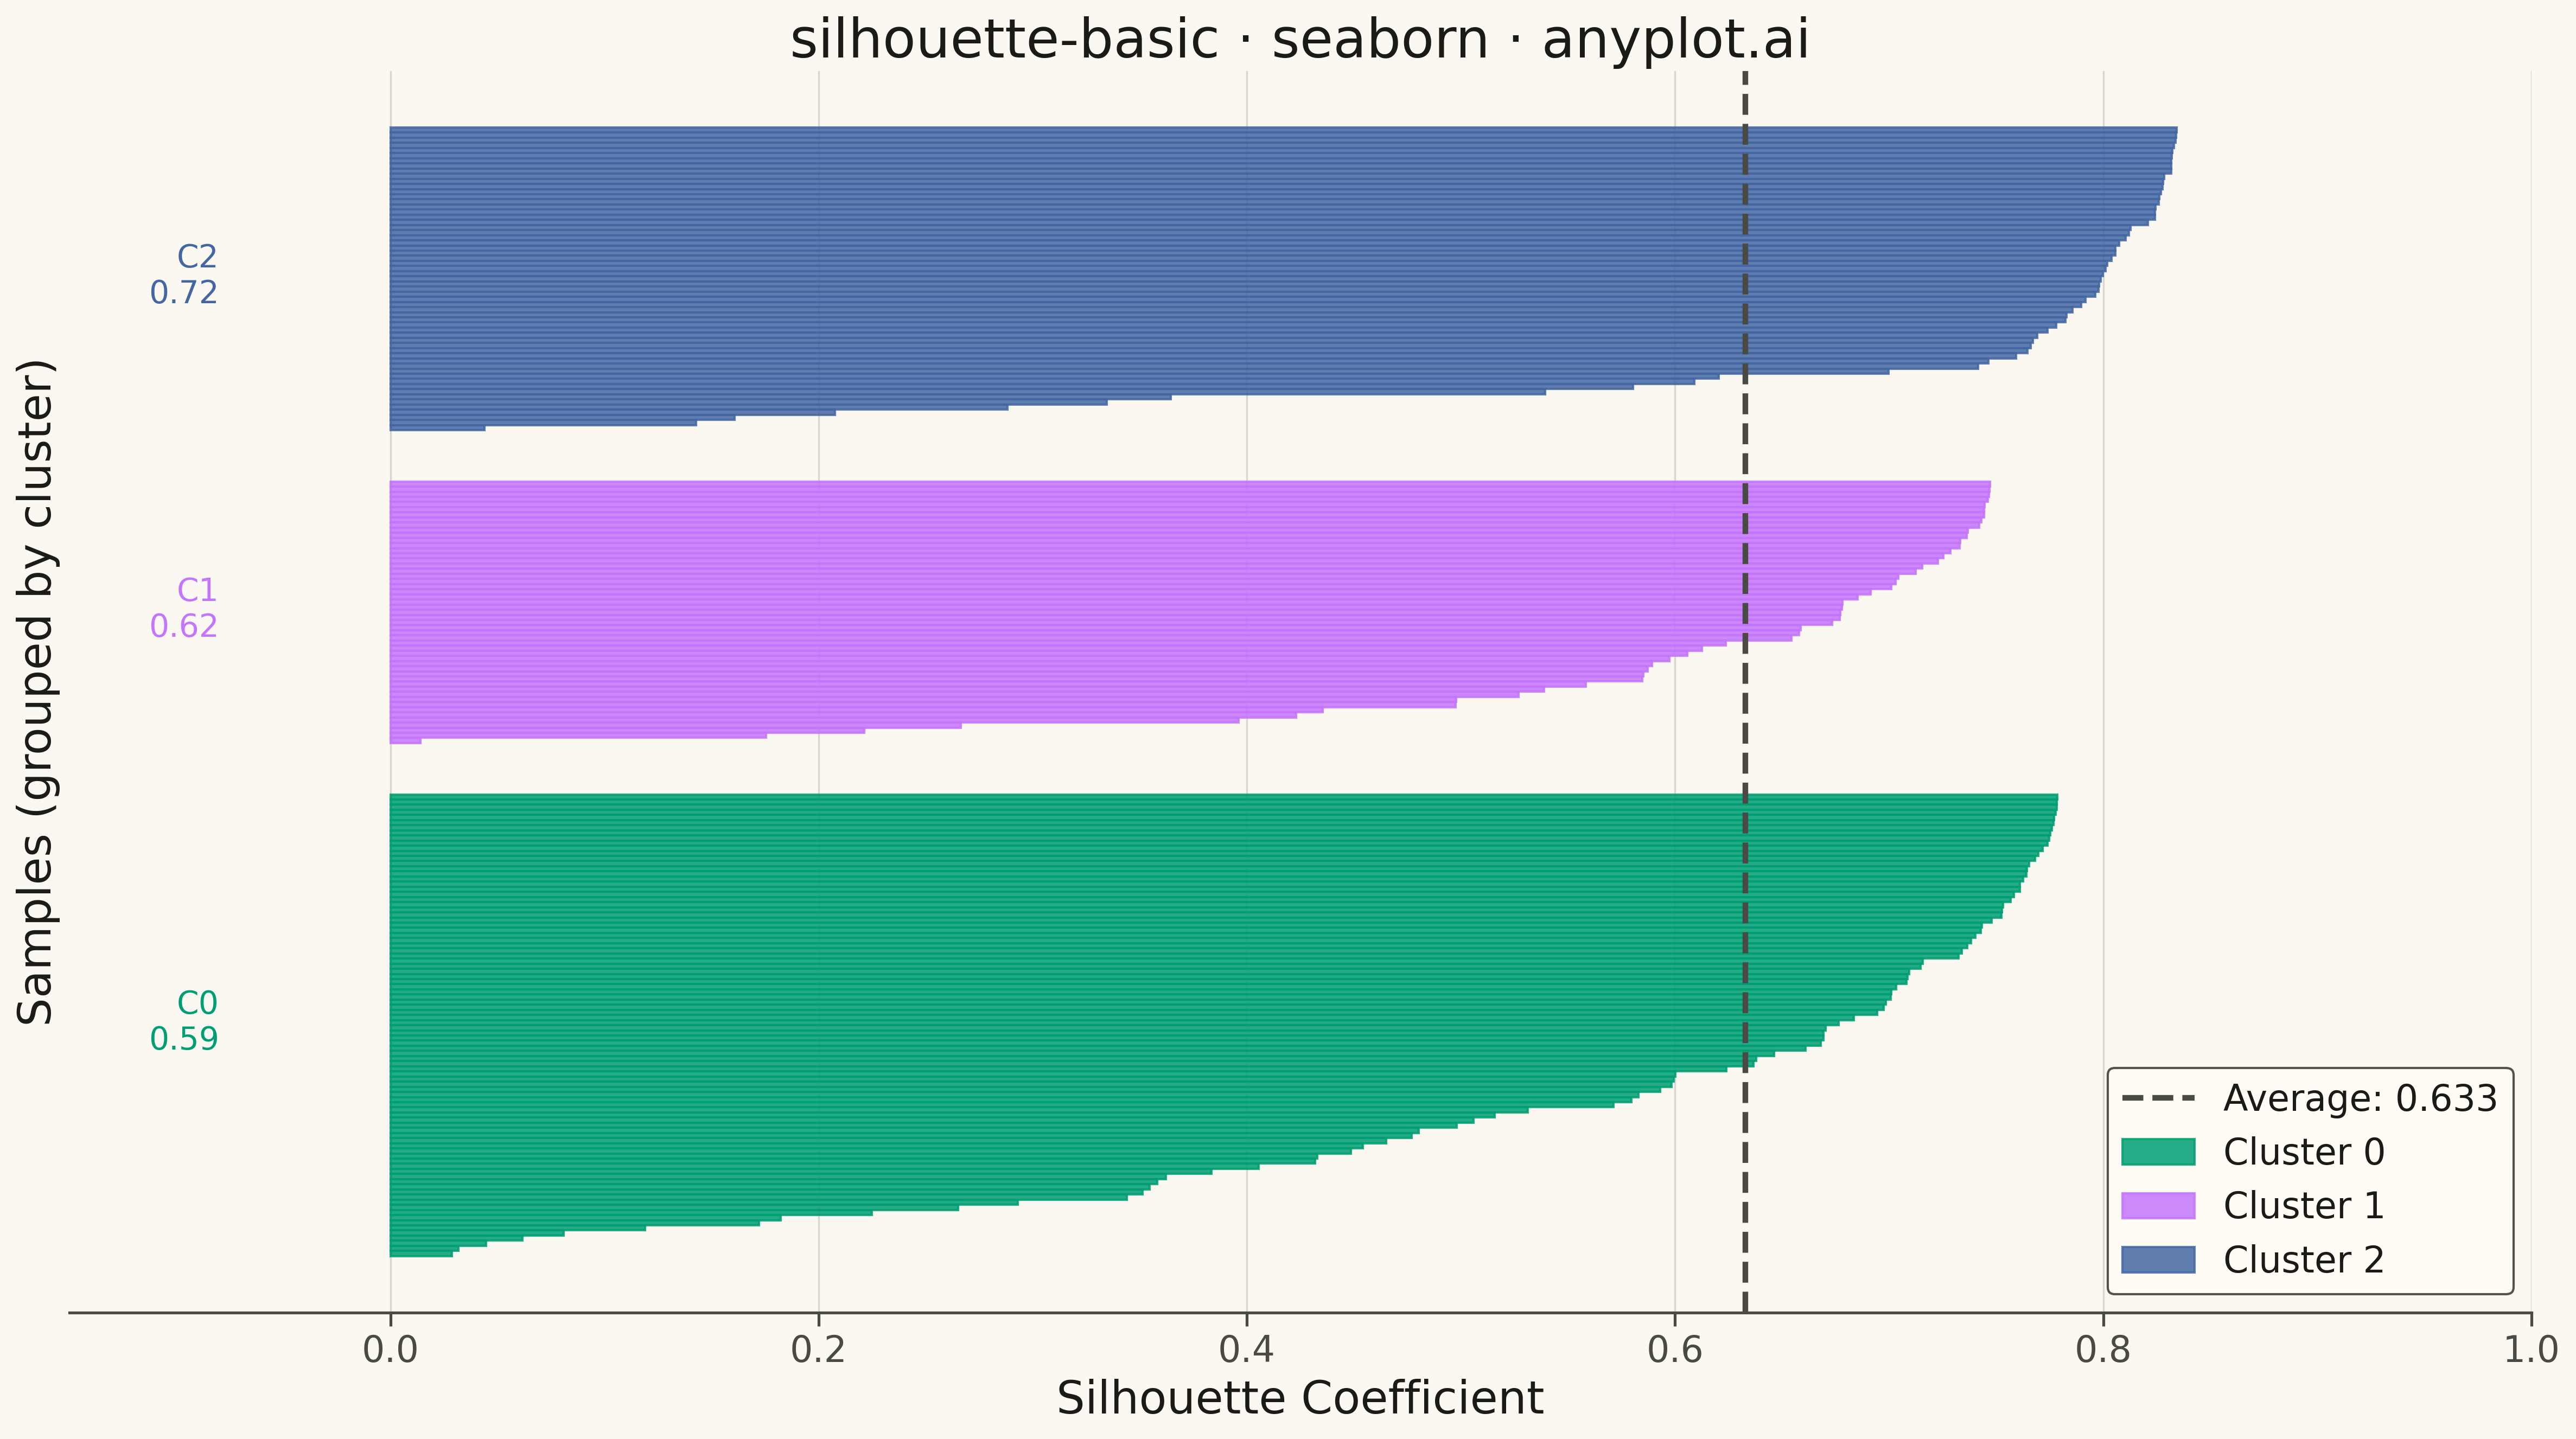
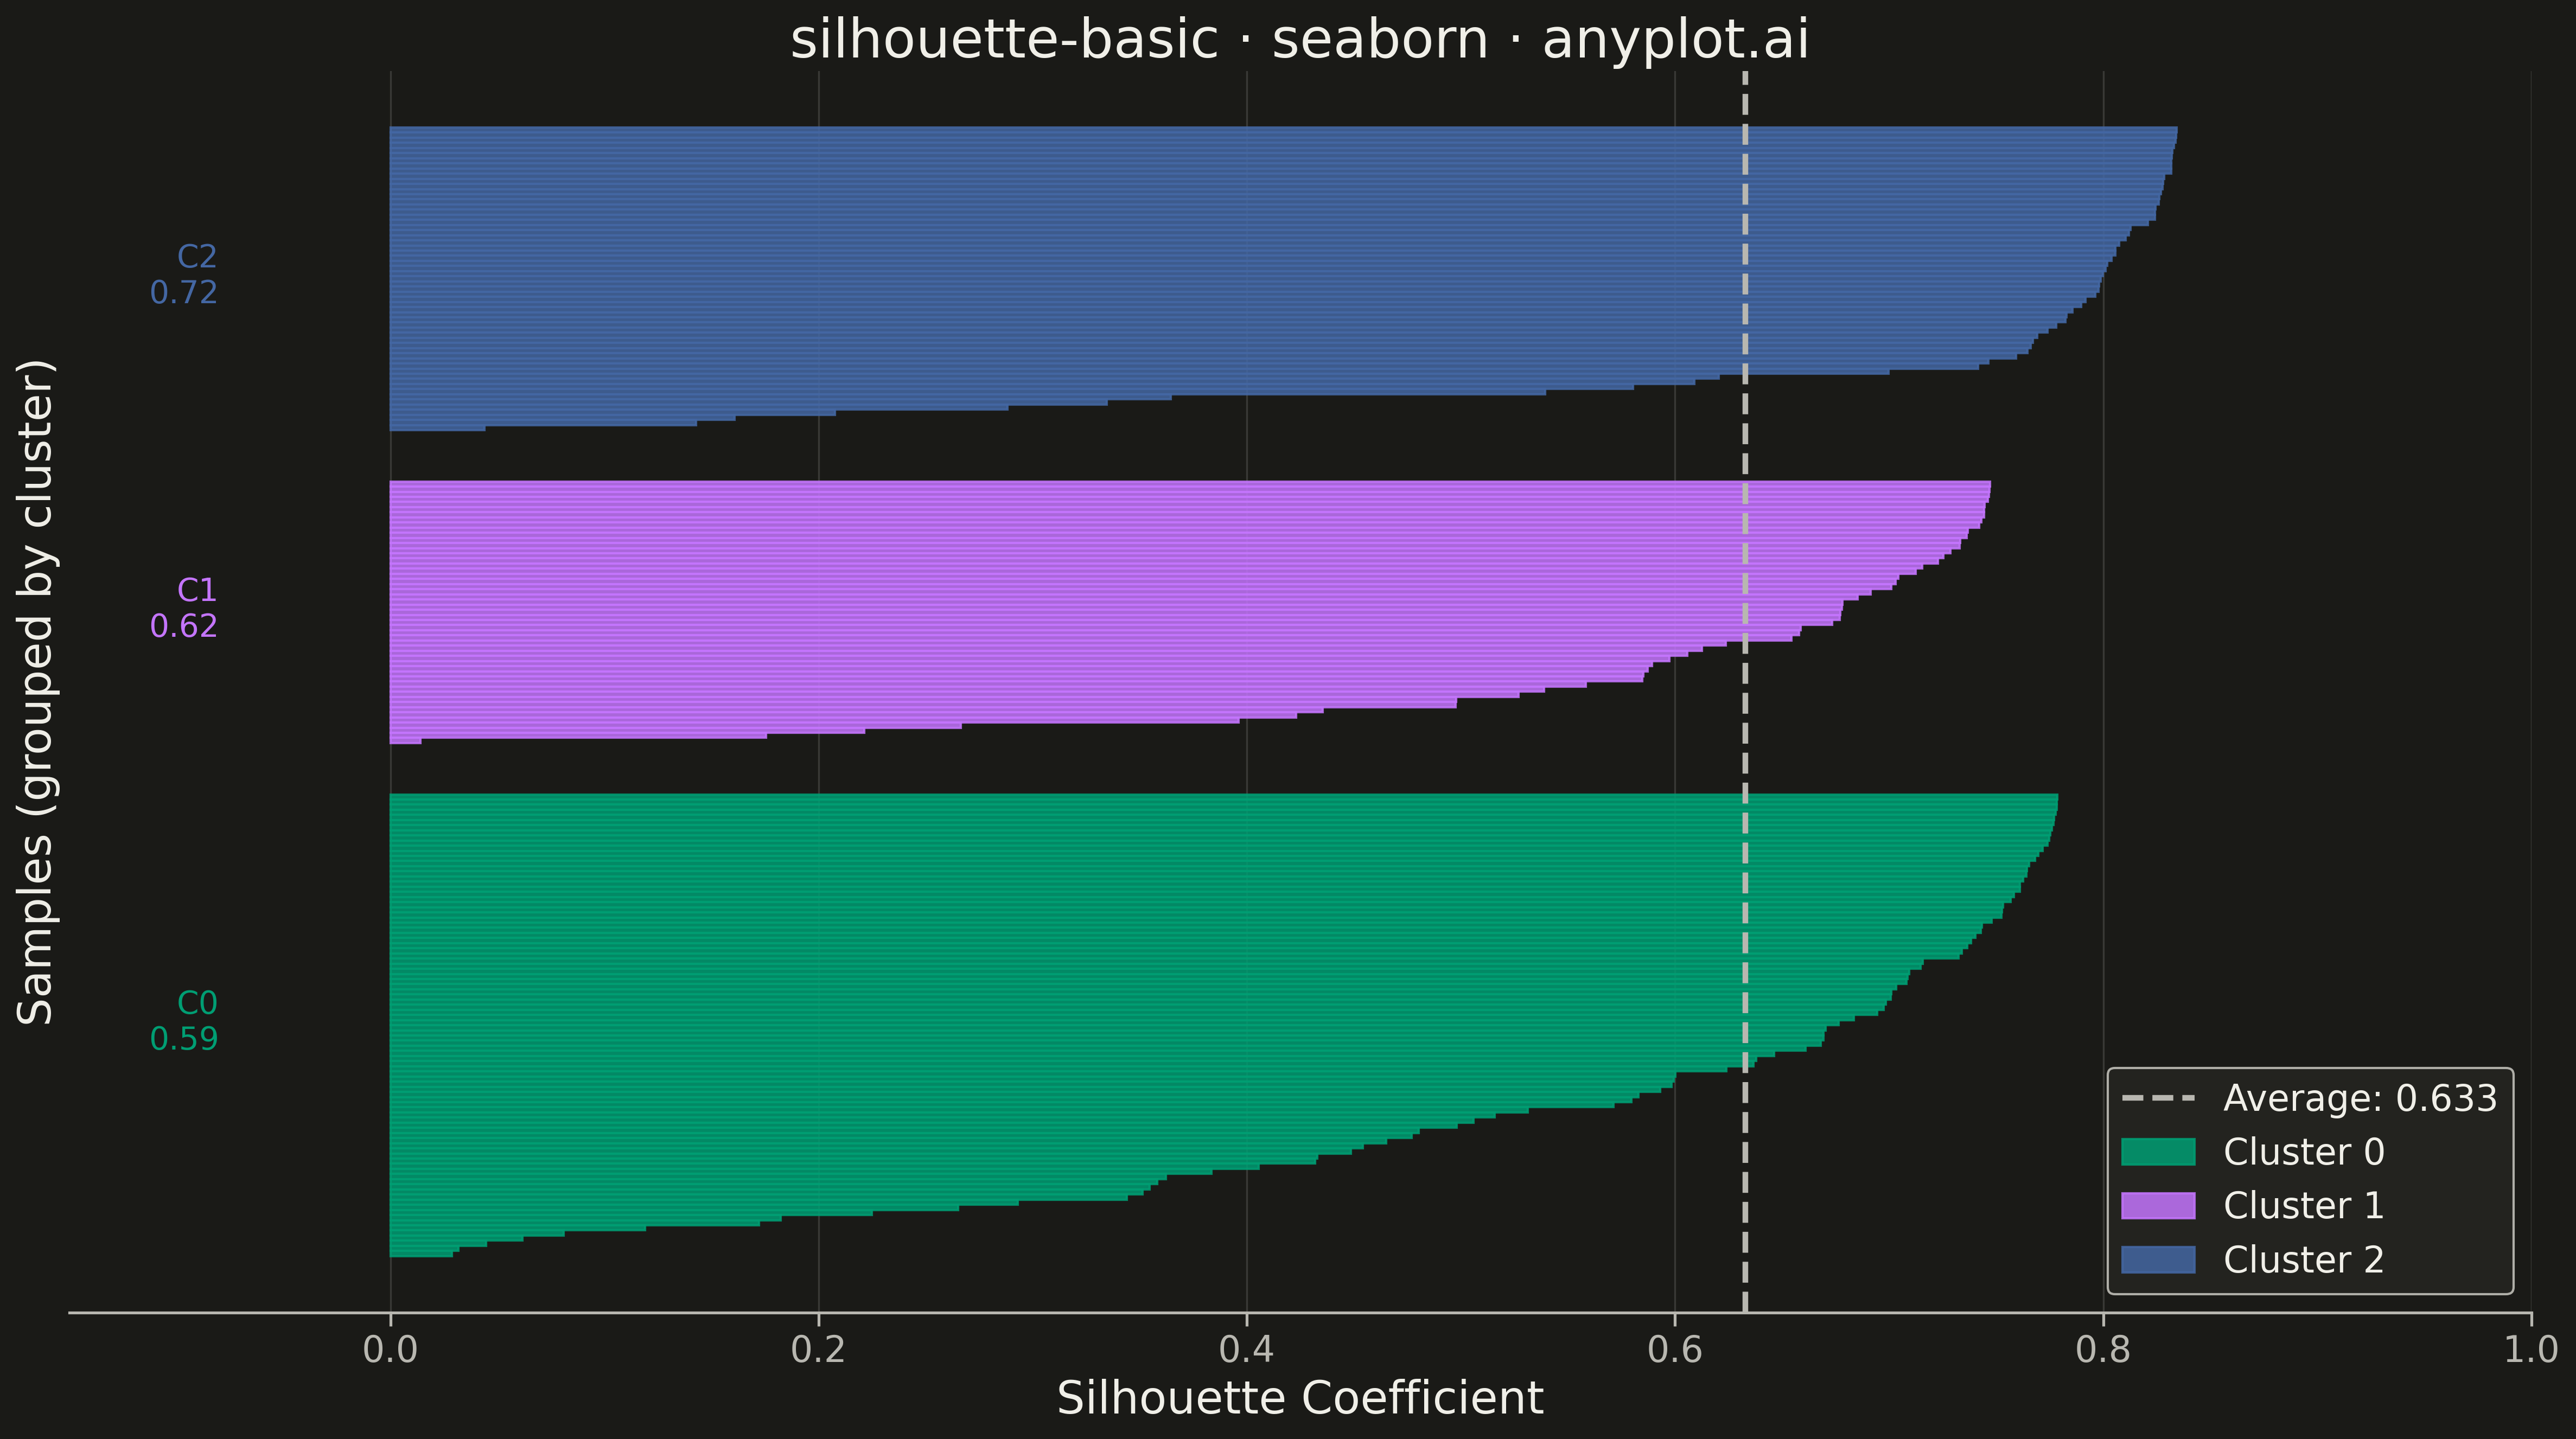
A silhouette plot visualizes the quality of clustering results by showing the silhouette coefficient for each sample, grouped by cluster assignment. Each horizontal bar represents a sample's silhouette score (-1 to 1), where positive values indicate good cluster membership and negative values suggest potential misclassification. This visualization helps evaluate cluster cohesion (how similar samples are to their own cluster) and separation (how distinct they are from neighboring clusters).
""" anyplot.ai
silhouette-basic: Silhouette Plot
Library: seaborn 0.13.2 | Python 3.13.13
Quality: 90/100 | Updated: 2026-05-10
"""

import os

import matplotlib.pyplot as plt
import numpy as np
import seaborn as sns
from sklearn.cluster import KMeans
from sklearn.metrics import silhouette_samples, silhouette_score


# Theme tokens
THEME = os.getenv("ANYPLOT_THEME", "light")
PAGE_BG = "#FAF8F1" if THEME == "light" else "#1A1A17"
ELEVATED_BG = "#FFFDF6" if THEME == "light" else "#242420"
INK = "#1A1A17" if THEME == "light" else "#F0EFE8"
INK_SOFT = "#4A4A44" if THEME == "light" else "#B8B7B0"

# Okabe-Ito palette (first series always #009E73)
IMPRINT = ["#009E73", "#C475FD", "#4467A3", "#BD8233", "#AE3030", "#2ABCCD"]

# Set seaborn theme
sns.set_theme(
    style="ticks",
    rc={
        "figure.facecolor": PAGE_BG,
        "axes.facecolor": PAGE_BG,
        "axes.edgecolor": INK_SOFT,
        "axes.labelcolor": INK,
        "text.color": INK,
        "xtick.color": INK_SOFT,
        "ytick.color": INK_SOFT,
        "grid.color": INK,
        "grid.alpha": 0.10,
        "legend.facecolor": ELEVATED_BG,
        "legend.edgecolor": INK_SOFT,
    },
)

# Customer segmentation synthetic data
np.random.seed(42)
n_customers = 200

# Generate customer features: spending, frequency, recency metrics
spending = np.concatenate(
    [
        np.random.normal(1500, 300, 60),  # High spenders
        np.random.normal(800, 200, 90),  # Medium spenders
        np.random.normal(200, 100, 50),  # Low spenders
    ]
)
frequency = np.concatenate([np.random.normal(24, 5, 60), np.random.normal(12, 4, 90), np.random.normal(3, 2, 50)])
recency = np.concatenate([np.random.normal(5, 10, 60), np.random.normal(20, 15, 90), np.random.normal(60, 30, 50)])

X = np.column_stack([spending, frequency, recency])

# K-means clustering
n_clusters = 3
kmeans = KMeans(n_clusters=n_clusters, random_state=123, n_init=10)
cluster_labels = kmeans.fit_predict(X)

# Silhouette analysis
silhouette_vals = silhouette_samples(X, cluster_labels)
avg_score = silhouette_score(X, cluster_labels)

# Create figure
fig, ax = plt.subplots(figsize=(16, 9), facecolor=PAGE_BG)
ax.set_facecolor(PAGE_BG)

y_lower = 10
cluster_info = []

for i in range(n_clusters):
    cluster_silhouette_vals = silhouette_vals[cluster_labels == i]
    cluster_silhouette_vals.sort()

    cluster_size = len(cluster_silhouette_vals)
    y_upper = y_lower + cluster_size

    y_positions = np.arange(y_lower, y_upper)

    ax.barh(
        y_positions,
        cluster_silhouette_vals,
        height=1.0,
        color=IMPRINT[i],
        edgecolor=IMPRINT[i],
        alpha=0.85,
        label=f"Cluster {i}",
    )

    cluster_avg = np.mean(cluster_silhouette_vals)
    cluster_info.append((i, cluster_avg, (y_lower + y_upper) / 2))

    y_lower = y_upper + 10

# Average silhouette line
ax.axvline(x=avg_score, color=INK_SOFT, linestyle="--", linewidth=2.5, label=f"Average: {avg_score:.3f}")

# Cluster average annotations
for cluster_id, cluster_avg, y_center in cluster_info:
    ax.text(
        -0.08,
        y_center,
        f"C{cluster_id}\n{cluster_avg:.2f}",
        fontsize=14,
        fontweight="medium",
        color=IMPRINT[cluster_id],
        va="center",
        ha="right",
    )

# Style
ax.set_xlim([-0.15, 1.0])
ax.set_xlabel("Silhouette Coefficient", fontsize=20, color=INK)
ax.set_ylabel("Samples (grouped by cluster)", fontsize=20, color=INK)
ax.set_title("silhouette-basic · seaborn · anyplot.ai", fontsize=24, fontweight="medium", color=INK)
ax.tick_params(axis="x", labelsize=16, colors=INK_SOFT)
ax.tick_params(axis="y", labelsize=0)
ax.set_yticks([])

# Remove spines
ax.spines["top"].set_visible(False)
ax.spines["right"].set_visible(False)
ax.spines["left"].set_visible(False)
ax.spines["bottom"].set_color(INK_SOFT)

# Subtle grid
ax.grid(axis="x", alpha=0.15, linewidth=0.8, color=INK)

# Legend
legend = ax.legend(loc="lower right", fontsize=16, framealpha=0.95)
legend.get_frame().set_facecolor(ELEVATED_BG)
legend.get_frame().set_edgecolor(INK_SOFT)

plt.tight_layout()
plt.savefig(f"plot-{THEME}.png", dpi=300, bbox_inches="tight", facecolor=PAGE_BG)
Runnable source as JSON, for any HTTP client: https://api.anyplot.ai/specs/silhouette-basic/seaborn/code. Any spec id and library id listed in llms-full.txt fit the same URL shape; every URL below is complete and callable.
{
  "spec_id": "silhouette-basic",
  "language": "python",
  "library": "seaborn",
  "page": "https://anyplot.ai/silhouette-basic/python/seaborn",
  "hub": "https://anyplot.ai/silhouette-basic",
  "code_json": "https://api.anyplot.ai/specs/silhouette-basic/seaborn/code",
  "spec_json": "https://api.anyplot.ai/specs/silhouette-basic",
  "render_light_png": "https://storage.googleapis.com/anyplot-images/plots/silhouette-basic/python/seaborn/plot-light.png",
  "render_dark_png": "https://storage.googleapis.com/anyplot-images/plots/silhouette-basic/python/seaborn/plot-dark.png",
  "quality_score": 90.0,
  "license": "MIT",
  "guide": "https://anyplot.ai/llms.txt"
}
Part of Silhouette Plot on anyplot.ai.