The same plot in 14 other libraries — Python: Altair, Bokeh, lets-plot, Matplotlib, Plotly, plotnine, Pygal, Seaborn; Julia: Makie.jl; JavaScript: Chart.js, D3.js, Apache ECharts, Highcharts, MUI X Charts. Compare all 15 side by side: Silhouette Plot in Python, R, Julia and JavaScript.
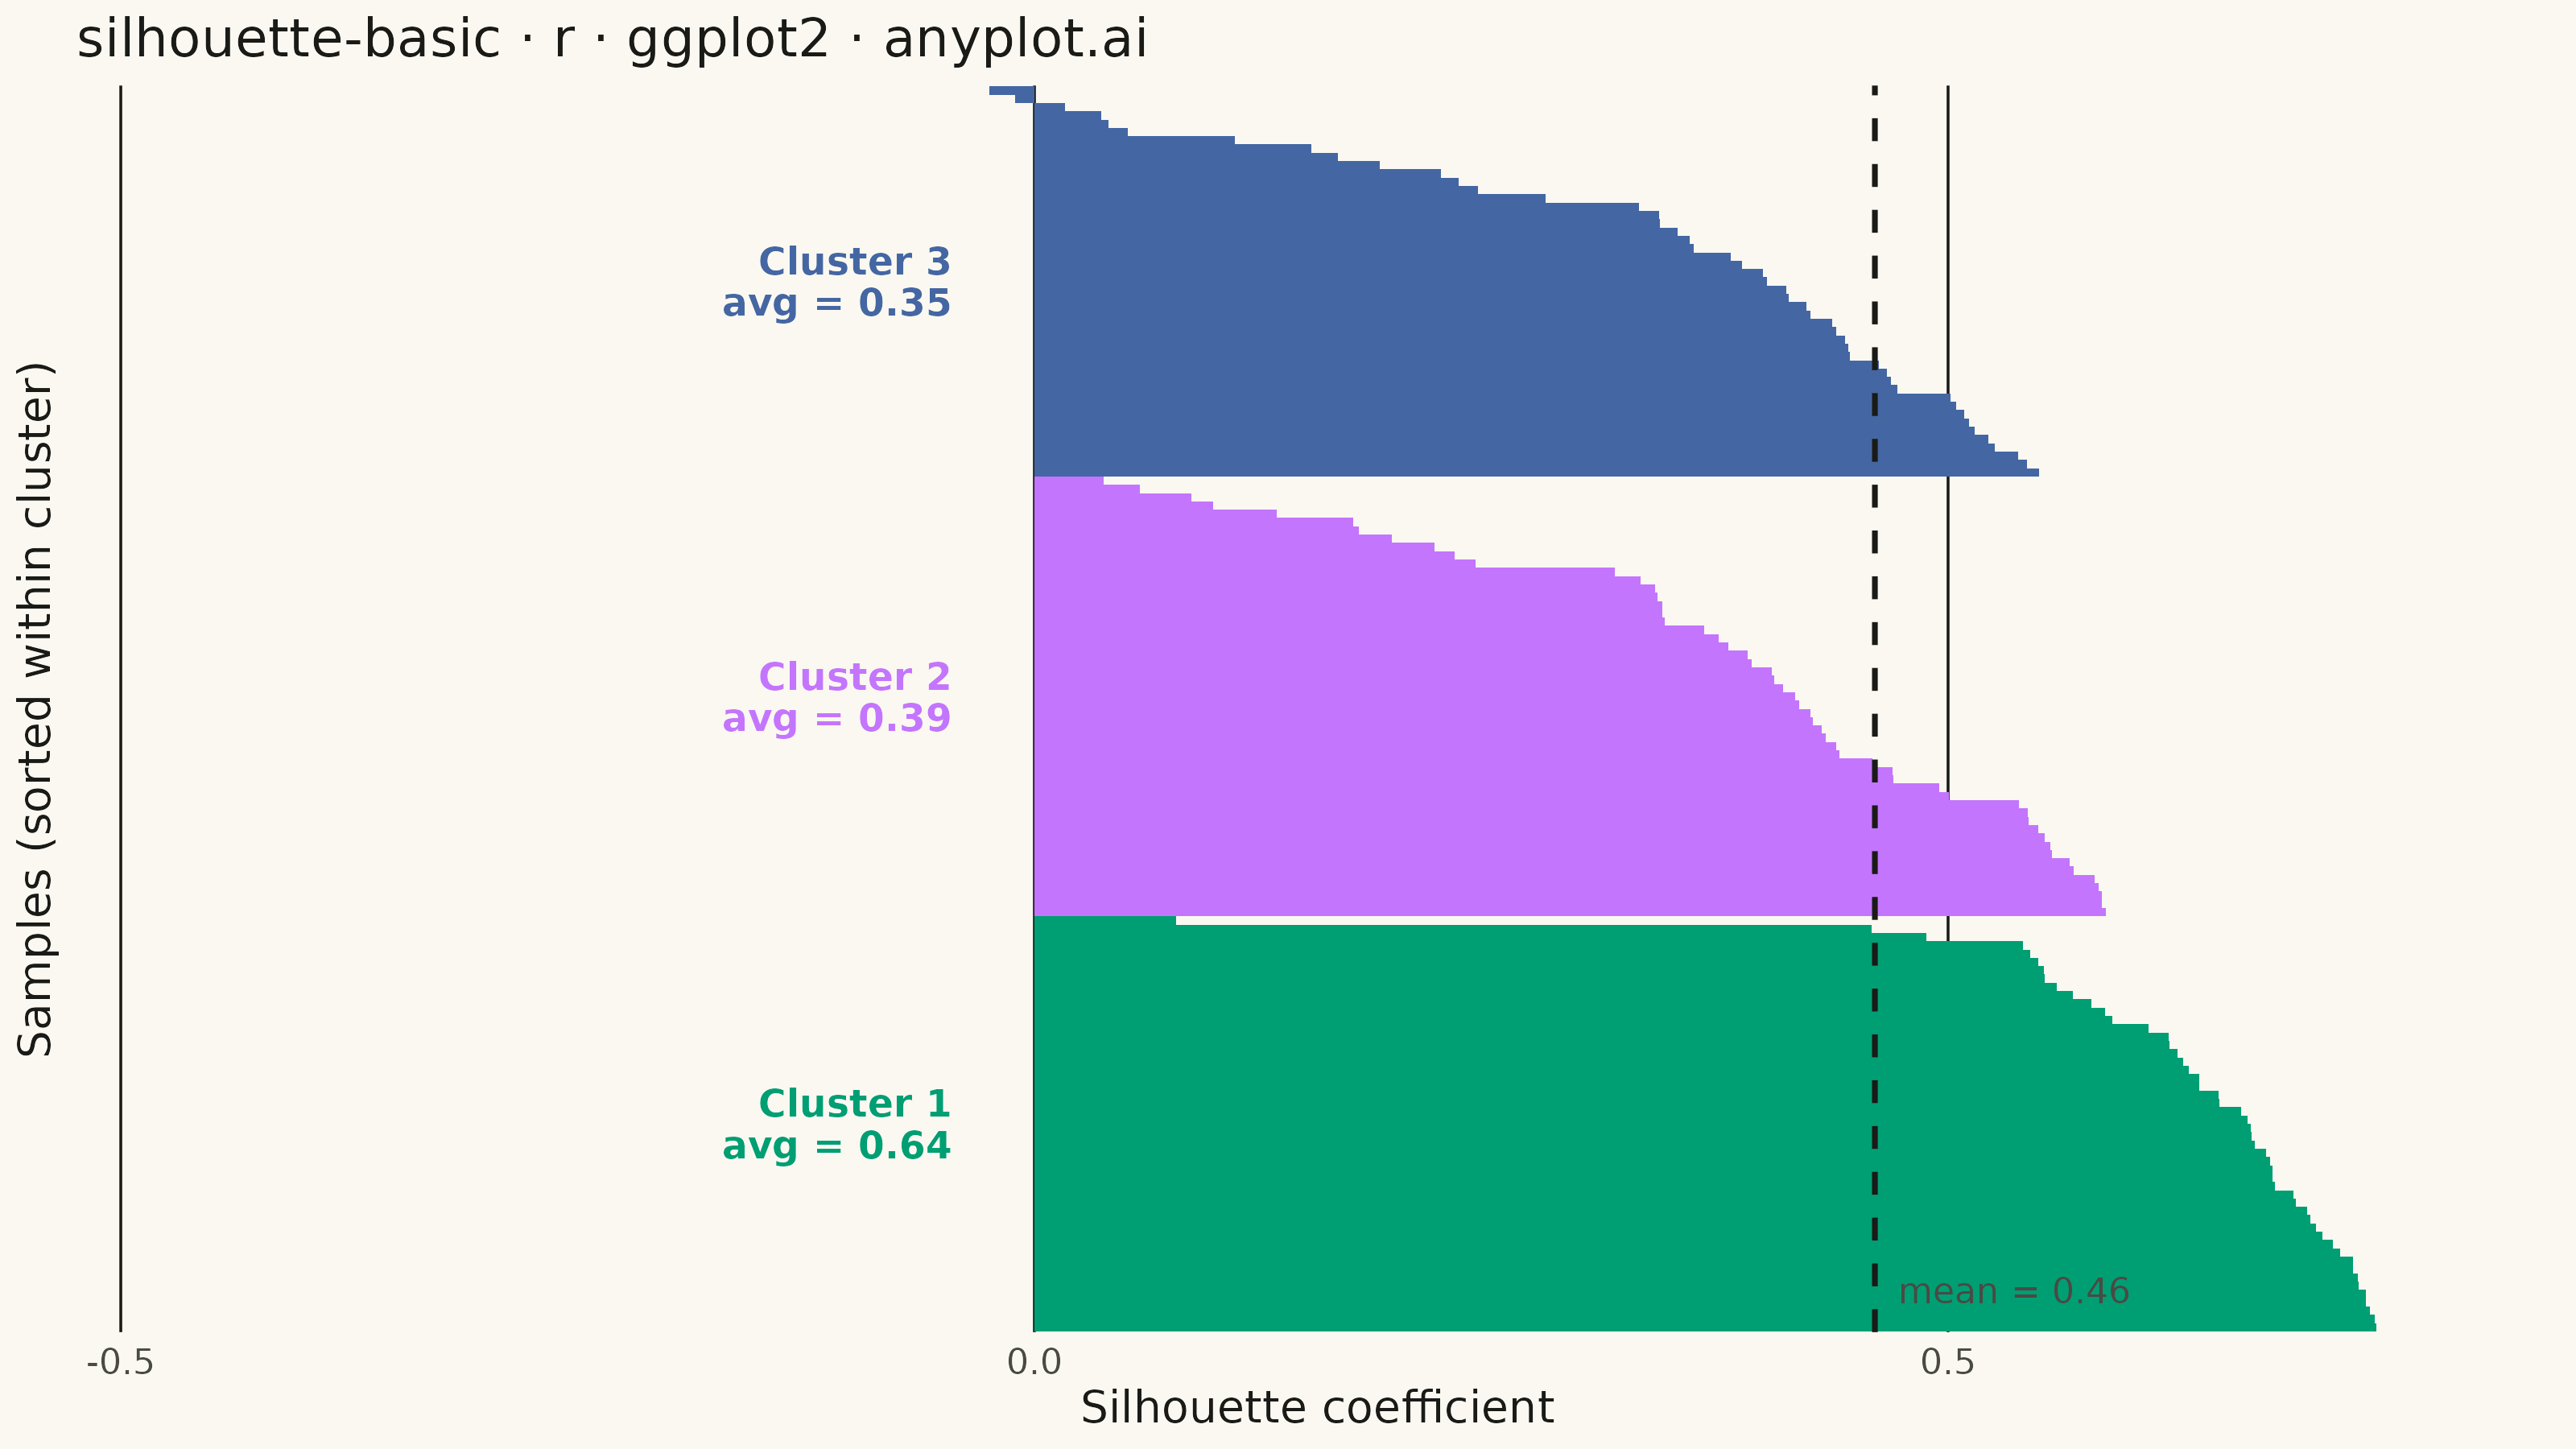
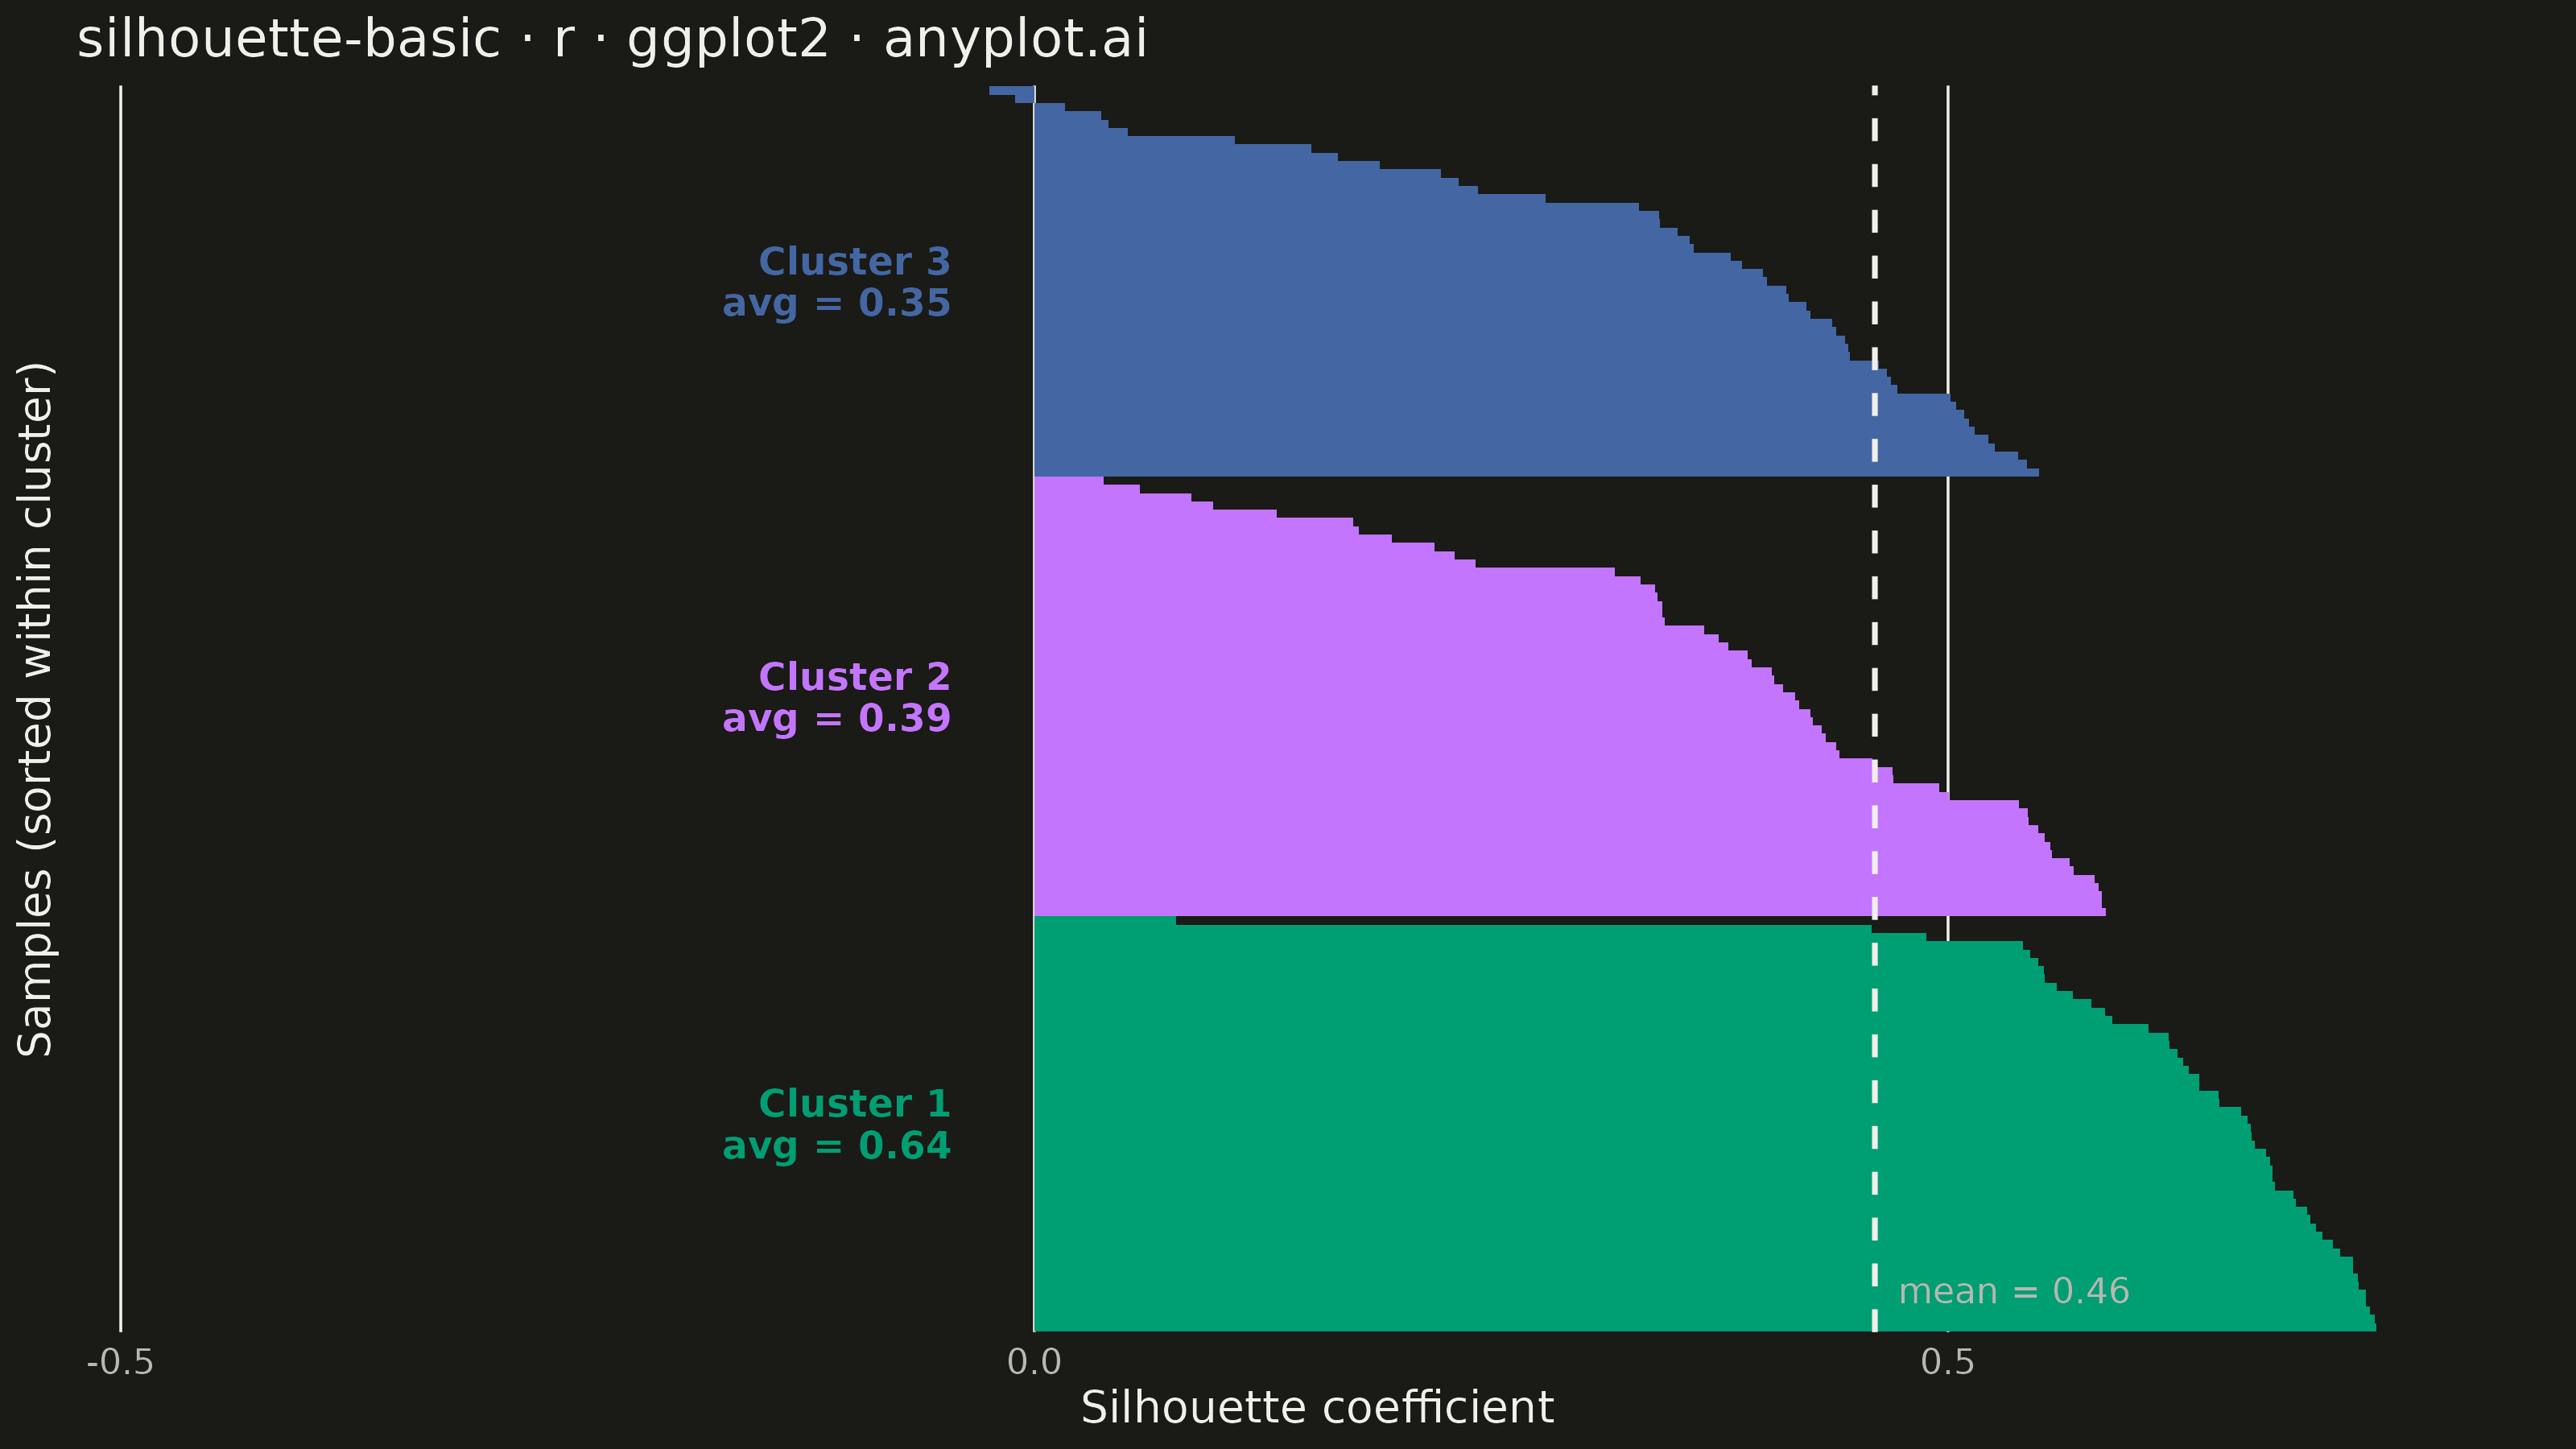
A silhouette plot visualizes the quality of clustering results by showing the silhouette coefficient for each sample, grouped by cluster assignment. Each horizontal bar represents a sample's silhouette score (-1 to 1), where positive values indicate good cluster membership and negative values suggest potential misclassification. This visualization helps evaluate cluster cohesion (how similar samples are to their own cluster) and separation (how distinct they are from neighboring clusters).
#' anyplot.ai
#' silhouette-basic: Silhouette Plot
#' Library: ggplot2 3.5.1 | R 4.4.1
#' Quality: 89/100 | Created: 2026-09-09

library(ggplot2)
library(dplyr)
library(cluster)
library(scales)
library(ragg)

set.seed(42)

# --- Theme tokens -----------------------------------------------------------
THEME       <- Sys.getenv("ANYPLOT_THEME", "light")
PAGE_BG     <- if (THEME == "light") "#FAF8F1" else "#1A1A17"
INK         <- if (THEME == "light") "#1A1A17" else "#F0EFE8"
INK_SOFT    <- if (THEME == "light") "#4A4A44" else "#B8B7B0"
IMPRINT_PALETTE <- c("#009E73", "#C475FD", "#4467A3", "#BD8233",
                     "#AE3030", "#2ABCCD", "#954477", "#99B314")

# --- Data --------------------------------------------------------------------
# Cluster the iris measurements into 3 groups (species-shaped clusters) with
# k-means, then compute the per-sample silhouette coefficient.
features <- scale(iris[, 1:4])
km <- kmeans(features, centers = 3, nstart = 25)
sil <- silhouette(km$cluster, dist(features))

sil_df <- tibble::tibble(
  cluster    = factor(sil[, "cluster"]),
  sil_width  = sil[, "sil_width"]
) %>%
  arrange(cluster, desc(sil_width)) %>%
  mutate(sample_order = factor(row_number()))

avg_sil <- mean(sil_df$sil_width)

cluster_summary <- sil_df %>%
  mutate(row_id = row_number()) %>%
  group_by(cluster) %>%
  summarise(avg_width = mean(sil_width), mid_order = mean(row_id), .groups = "drop")

sil_min      <- min(sil_df$sil_width)
sil_max      <- max(sil_df$sil_width)
sil_range    <- sil_max - sil_min
label_x      <- sil_min - 0.02
mean_label_x <- min(as.integer(sil_df$sample_order)) + 1

# --- Plot ----------------------------------------------------------------
p <- ggplot(sil_df, aes(x = sample_order, y = sil_width, fill = cluster)) +
  geom_col(width = 1, color = NA) +
  geom_hline(yintercept = avg_sil, linetype = "dashed",
             linewidth = 0.6, color = INK) +
  geom_text(
    data = cluster_summary,
    aes(x = mid_order, y = label_x,
        label = sprintf("Cluster %s\navg = %.2f", cluster, avg_width),
        color = cluster),
    inherit.aes = FALSE, hjust = 1, size = 3, lineheight = 0.9, fontface = "bold"
  ) +
  annotate(
    "text", x = mean_label_x, y = avg_sil, label = sprintf("mean = %.2f", avg_sil),
    hjust = -0.1, vjust = -0.6, size = 3.3, color = INK_SOFT
  ) +
  scale_fill_manual(values = IMPRINT_PALETTE) +
  scale_color_manual(values = IMPRINT_PALETTE) +
  scale_y_continuous(limits = c(label_x - 0.55 * sil_range, sil_max + 0.05 * sil_range)) +
  labs(
    title = "silhouette-basic · r · ggplot2 · anyplot.ai",
    x = "Samples (sorted within cluster)",
    y = "Silhouette coefficient"
  ) +
  coord_flip() +
  theme_minimal(base_size = 8) +
  theme(
    plot.background   = element_rect(fill = PAGE_BG, color = PAGE_BG),
    panel.background  = element_rect(fill = PAGE_BG, color = NA),
    panel.grid.major.x = element_line(color = scales::alpha(INK, 0.15), linewidth = 0.3),
    panel.grid.major.y = element_blank(),
    panel.grid.minor  = element_blank(),
    axis.title.x      = element_text(color = INK, size = 10),
    axis.title.y      = element_text(color = INK, size = 10),
    axis.text.x       = element_text(color = INK_SOFT, size = 8),
    axis.text.y       = element_blank(),
    axis.ticks.y      = element_blank(),
    plot.title        = element_text(color = INK, size = 12),
    legend.position   = "none"
  )

# --- Save --------------------------------------------------------------------
ggsave(
  filename = sprintf("plot-%s.png", THEME),
  plot     = p,
  device   = ragg::agg_png,
  width    = 8,
  height   = 4.5,
  units    = "in",
  dpi      = 400
)
Runnable source as JSON, for any HTTP client: https://api.anyplot.ai/specs/silhouette-basic/ggplot2/code. Any spec id and library id listed in llms-full.txt fit the same URL shape; every URL below is complete and callable.
{
  "spec_id": "silhouette-basic",
  "language": "r",
  "library": "ggplot2",
  "page": "https://anyplot.ai/silhouette-basic/r/ggplot2",
  "hub": "https://anyplot.ai/silhouette-basic",
  "code_json": "https://api.anyplot.ai/specs/silhouette-basic/ggplot2/code",
  "spec_json": "https://api.anyplot.ai/specs/silhouette-basic",
  "render_light_png": "https://storage.googleapis.com/anyplot-images/plots/silhouette-basic/r/ggplot2/plot-light.png",
  "render_dark_png": "https://storage.googleapis.com/anyplot-images/plots/silhouette-basic/r/ggplot2/plot-dark.png",
  "quality_score": 89.0,
  "license": "MIT",
  "guide": "https://anyplot.ai/llms.txt"
}
Part of Silhouette Plot on anyplot.ai.