The same plot in 14 other libraries — JavaScript: Chart.js, D3.js, Highcharts, MUI X Charts; Python: Altair, Bokeh, lets-plot, Matplotlib, Plotly, plotnine, Pygal, Seaborn; R: ggplot2; Julia: Makie.jl. Compare all 15 side by side: Silhouette Plot in Python, R, Julia and JavaScript.
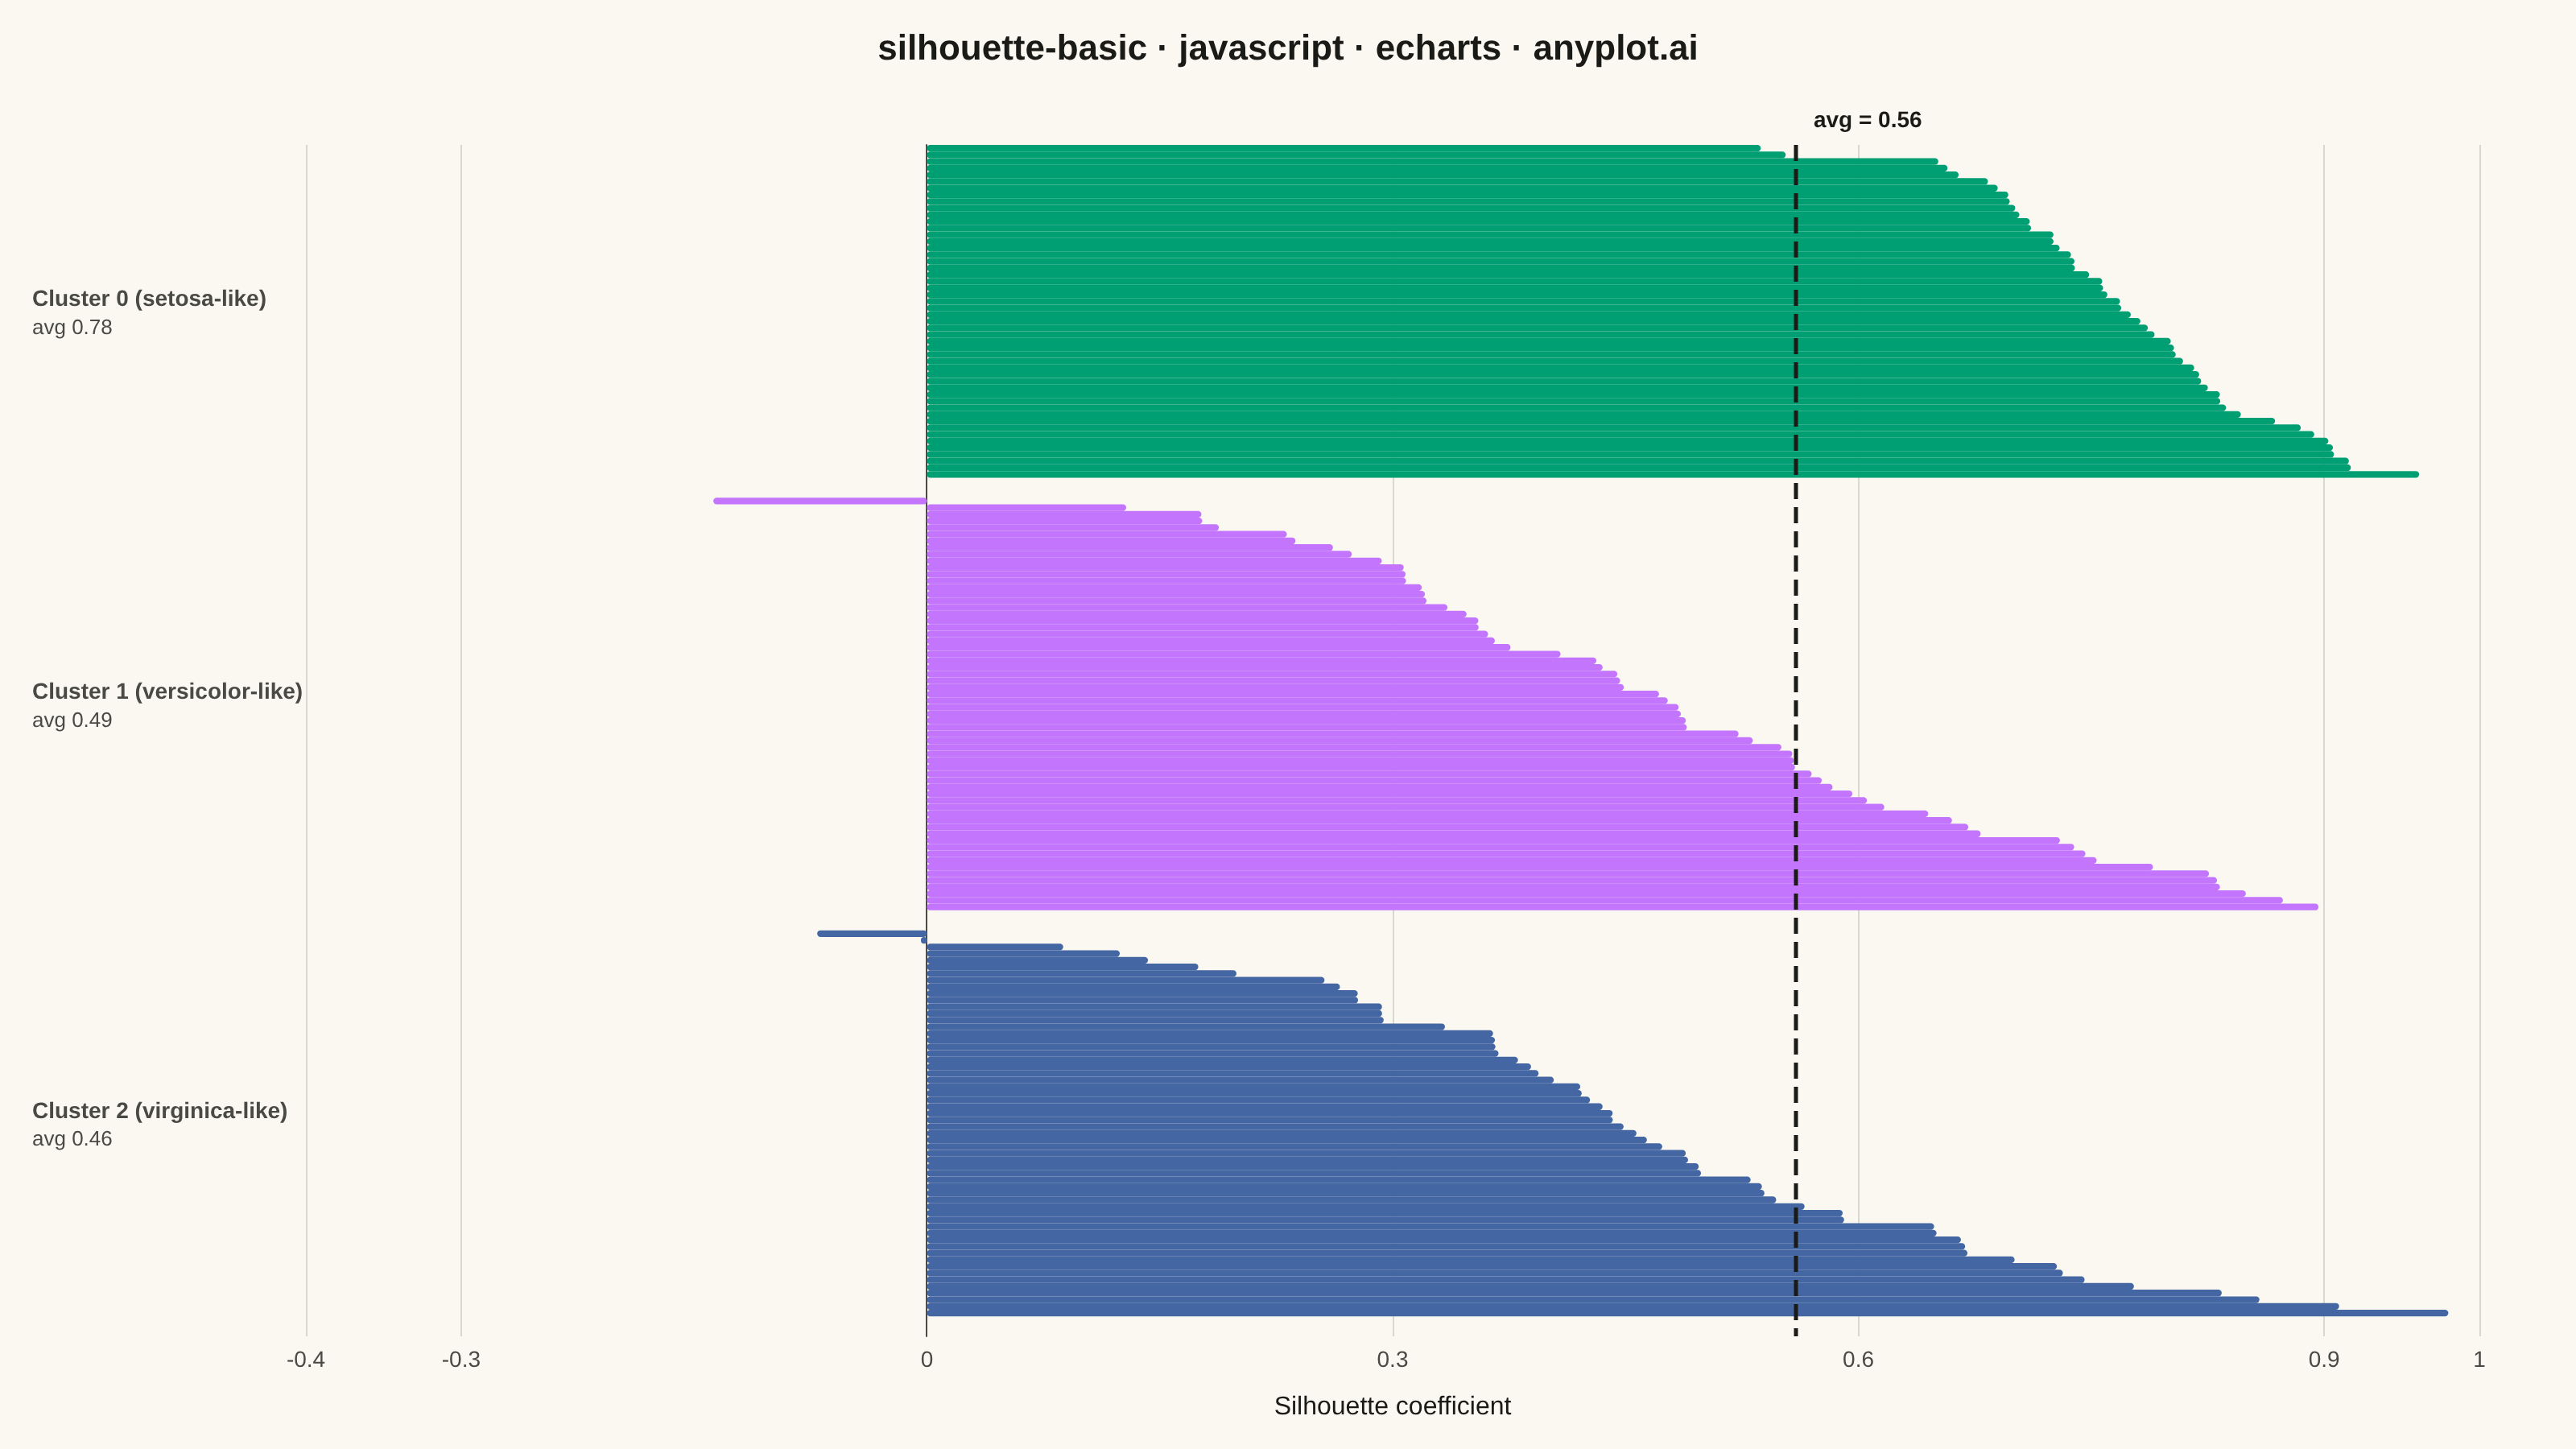
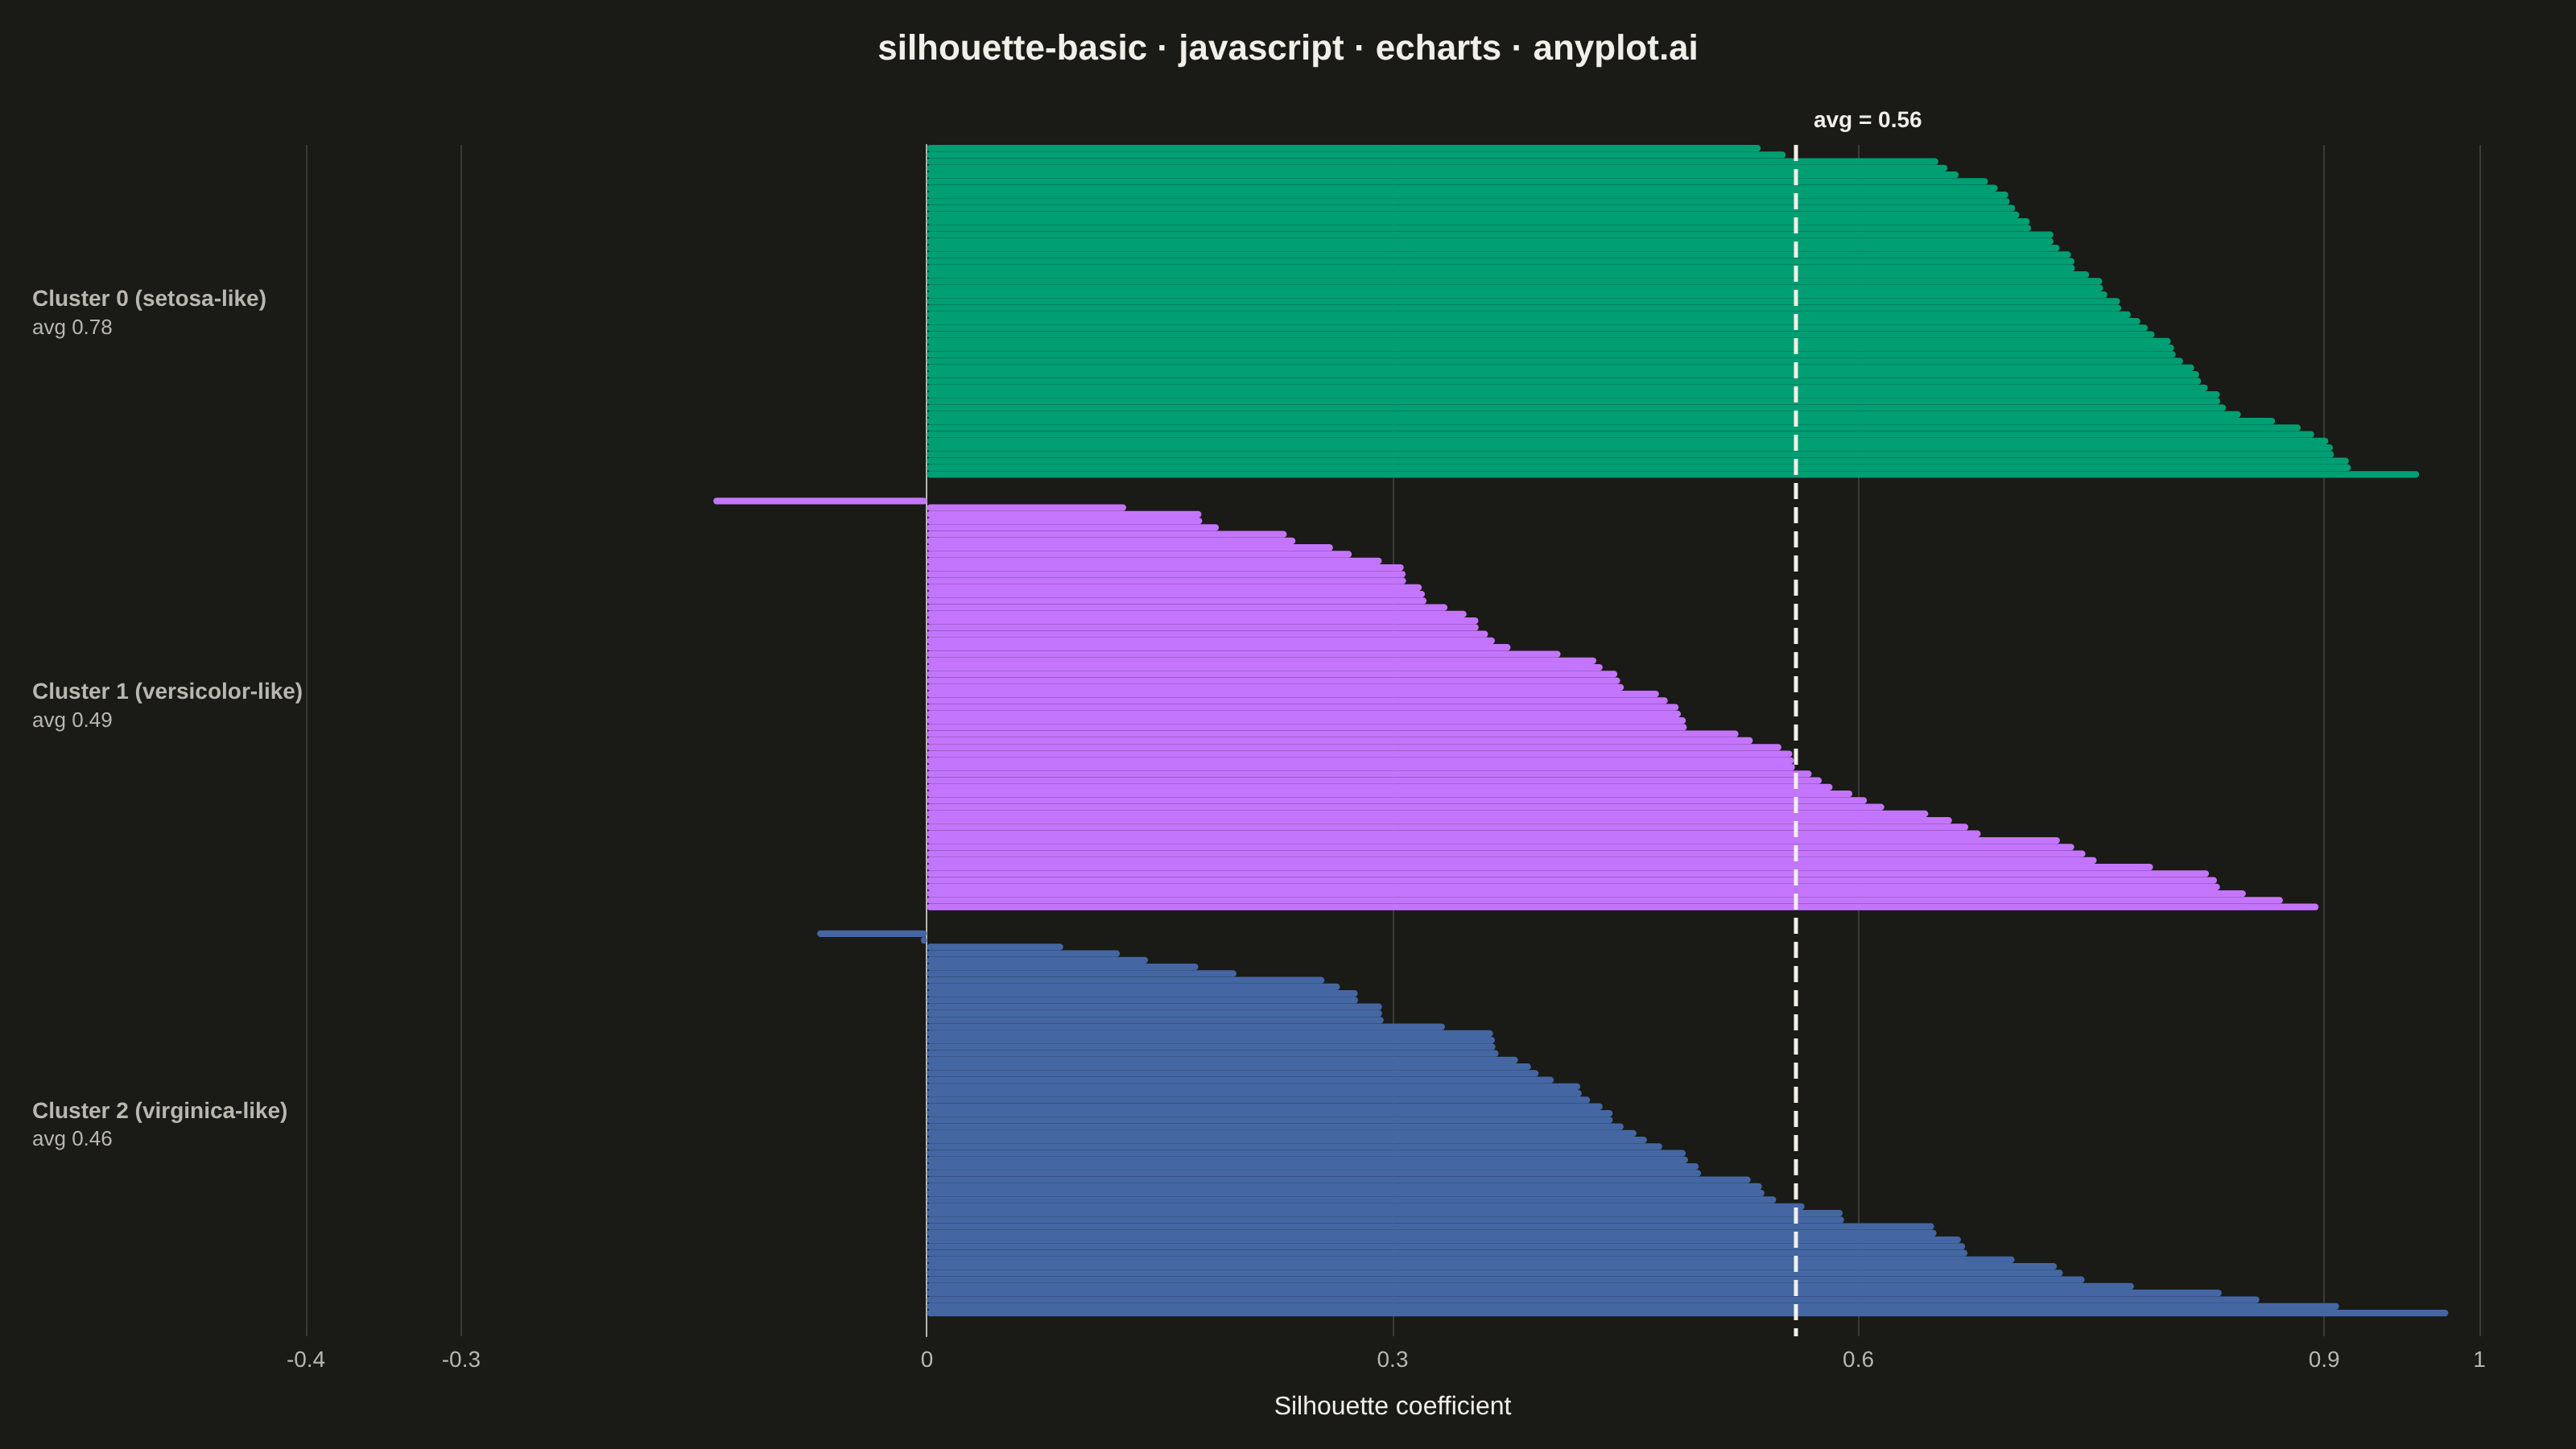
A silhouette plot visualizes the quality of clustering results by showing the silhouette coefficient for each sample, grouped by cluster assignment. Each horizontal bar represents a sample's silhouette score (-1 to 1), where positive values indicate good cluster membership and negative values suggest potential misclassification. This visualization helps evaluate cluster cohesion (how similar samples are to their own cluster) and separation (how distinct they are from neighboring clusters).
// anyplot.ai
// silhouette-basic: Silhouette Plot
// Library: echarts 6.1.0 | JavaScript 22.23.2
// Quality: 88/100 | Created: 2026-09-09
const t = window.ANYPLOT_TOKENS;

// --- Data (in-memory, deterministic) ----------------------------------------
// Tiny fixed-seed LCG — the browser has no seeded RNG.
let seed = 42;
function rand() {
  seed = (seed * 1103515245 + 12345) & 0x7fffffff;
  return seed / 0x7fffffff;
}
function gaussian(mean, std) {
  const u1 = rand() || 1e-9;
  const u2 = rand();
  return mean + std * Math.sqrt(-2 * Math.log(u1)) * Math.cos(2 * Math.PI * u2);
}

// Simulated silhouette coefficients for a 3-cluster k-means result on a
// flower-measurement dataset (analogous to clustering the iris species).
const clusterSpecs = [
  { name: "Cluster 0 (setosa-like)", n: 50, mean: 0.78, std: 0.08 },
  { name: "Cluster 1 (versicolor-like)", n: 62, mean: 0.42, std: 0.22 },
  { name: "Cluster 2 (virginica-like)", n: 58, mean: 0.5, std: 0.25 },
];

const clusters = clusterSpecs.map((spec) => {
  const values = [];
  for (let i = 0; i < spec.n; i++) {
    let v = gaussian(spec.mean, spec.std);
    v = Math.max(-0.35, Math.min(0.98, v));
    values.push(v);
  }
  values.sort((a, b) => a - b);
  return { name: spec.name, values };
});

let allValues = [];
clusters.forEach((c) => (allValues = allValues.concat(c.values)));
const avgSilhouette = allValues.reduce((a, b) => a + b, 0) / allValues.length;

// One horizontal bar per sample, samples stacked cluster-by-cluster with a
// thin gap between clusters (mirrors sklearn's silhouette_plot convention).
const categories = [];
const barValues = [];
const barColors = [];
const clusterAverages = [];
const gap = 3;
let cursor = 0;

clusters.forEach((cluster, ci) => {
  const clusterStart = cursor;
  cluster.values.forEach((v) => {
    categories.push("");
    barValues.push(v);
    barColors.push(t.palette[ci]);
    cursor++;
  });
  const clusterEnd = cursor;
  const clusterAvg = cluster.values.reduce((a, b) => a + b, 0) / cluster.values.length;
  clusterAverages.push({ name: cluster.name, mid: (clusterStart + clusterEnd - 1) / 2, avg: clusterAvg });
  for (let g = 0; g < gap; g++) {
    categories.push("");
    barValues.push(0);
    barColors.push("transparent");
    cursor++;
  }
});

const barData = barValues.map((v, i) => ({ value: v, itemStyle: { color: barColors[i], borderRadius: 3 } }));

// --- Layout (shared so the graphic overlays never drift from the grid) ------
const size = window.ANYPLOT_SIZE;
const margin = { left: 190, right: 60, top: 90, bottom: 70 };
const plotWidth = size.width - margin.left - margin.right;
const plotHeight = size.height - margin.top - margin.bottom;
const xMin = -0.4;
const xMax = 1;
const xToPixel = (x) => margin.left + ((x - xMin) / (xMax - xMin)) * plotWidth;

// --- Init --------------------------------------------------------------------
const chart = echarts.init(document.getElementById("container"));

// --- Option --------------------------------------------------------------------
chart.setOption({
  animation: false,
  color: t.palette,
  backgroundColor: "transparent",
  title: {
    text: "silhouette-basic · javascript · echarts · anyplot.ai",
    left: "center",
    textStyle: { color: t.ink, fontSize: 22 },
  },
  grid: { left: margin.left, right: margin.right, top: margin.top, bottom: margin.bottom },
  xAxis: {
    type: "value",
    name: "Silhouette coefficient",
    nameLocation: "middle",
    nameGap: 36,
    nameTextStyle: { color: t.ink, fontSize: 16 },
    min: xMin,
    max: xMax,
    axisLabel: { color: t.inkSoft, fontSize: 14 },
    axisLine: { lineStyle: { color: t.inkSoft } },
    splitLine: { lineStyle: { color: t.grid } },
  },
  yAxis: {
    type: "category",
    data: categories,
    inverse: true,
    axisLabel: { show: false },
    axisLine: { lineStyle: { color: t.inkSoft } },
    axisTick: { show: false },
    splitLine: { show: false },
  },
  series: [
    {
      type: "bar",
      data: barData,
      barCategoryGap: "0%",
      markLine: {
        symbol: "none",
        silent: true,
        label: { show: false },
        lineStyle: { color: t.ink, type: "dashed", width: 2.5 },
        data: [{ xAxis: avgSilhouette }],
      },
    },
  ],
  graphic: clusterAverages
    .map((c) => ({
      type: "text",
      left: 20,
      top: margin.top + (c.mid / cursor) * plotHeight - 12,
      style: {
        text: `{name|${c.name}}\n{avg|avg ${c.avg.toFixed(2)}}`,
        rich: {
          name: { fill: t.inkSoft, fontSize: 14, fontWeight: 600, lineHeight: 18 },
          avg: { fill: t.inkSoft, fontSize: 13, lineHeight: 17 },
        },
      },
    }))
    .concat([
      {
        type: "text",
        left: xToPixel(avgSilhouette) + 8,
        top: margin.top - 22,
        style: {
          text: `avg = ${avgSilhouette.toFixed(2)}`,
          fill: t.ink,
          fontSize: 14,
          fontWeight: 600,
        },
      },
    ]),
});
Runnable source as JSON, for any HTTP client: https://api.anyplot.ai/specs/silhouette-basic/echarts/code. Any spec id and library id listed in llms-full.txt fit the same URL shape; every URL below is complete and callable.
{
  "spec_id": "silhouette-basic",
  "language": "javascript",
  "library": "echarts",
  "page": "https://anyplot.ai/silhouette-basic/javascript/echarts",
  "hub": "https://anyplot.ai/silhouette-basic",
  "code_json": "https://api.anyplot.ai/specs/silhouette-basic/echarts/code",
  "spec_json": "https://api.anyplot.ai/specs/silhouette-basic",
  "render_light_png": "https://storage.googleapis.com/anyplot-images/plots/silhouette-basic/javascript/echarts/plot-light.png",
  "render_dark_png": "https://storage.googleapis.com/anyplot-images/plots/silhouette-basic/javascript/echarts/plot-dark.png",
  "interactive_light_html": "https://storage.googleapis.com/anyplot-images/plots/silhouette-basic/javascript/echarts/plot-light.html",
  "interactive_dark_html": "https://storage.googleapis.com/anyplot-images/plots/silhouette-basic/javascript/echarts/plot-dark.html",
  "quality_score": 88.0,
  "license": "MIT",
  "guide": "https://anyplot.ai/llms.txt"
}
Part of Silhouette Plot on anyplot.ai.