The same plot in 14 other libraries — JavaScript: D3.js, Apache ECharts, Highcharts, MUI X Charts; Python: Altair, Bokeh, lets-plot, Matplotlib, Plotly, plotnine, Pygal, Seaborn; R: ggplot2; Julia: Makie.jl. Compare all 15 side by side: Silhouette Plot in Python, R, Julia and JavaScript.
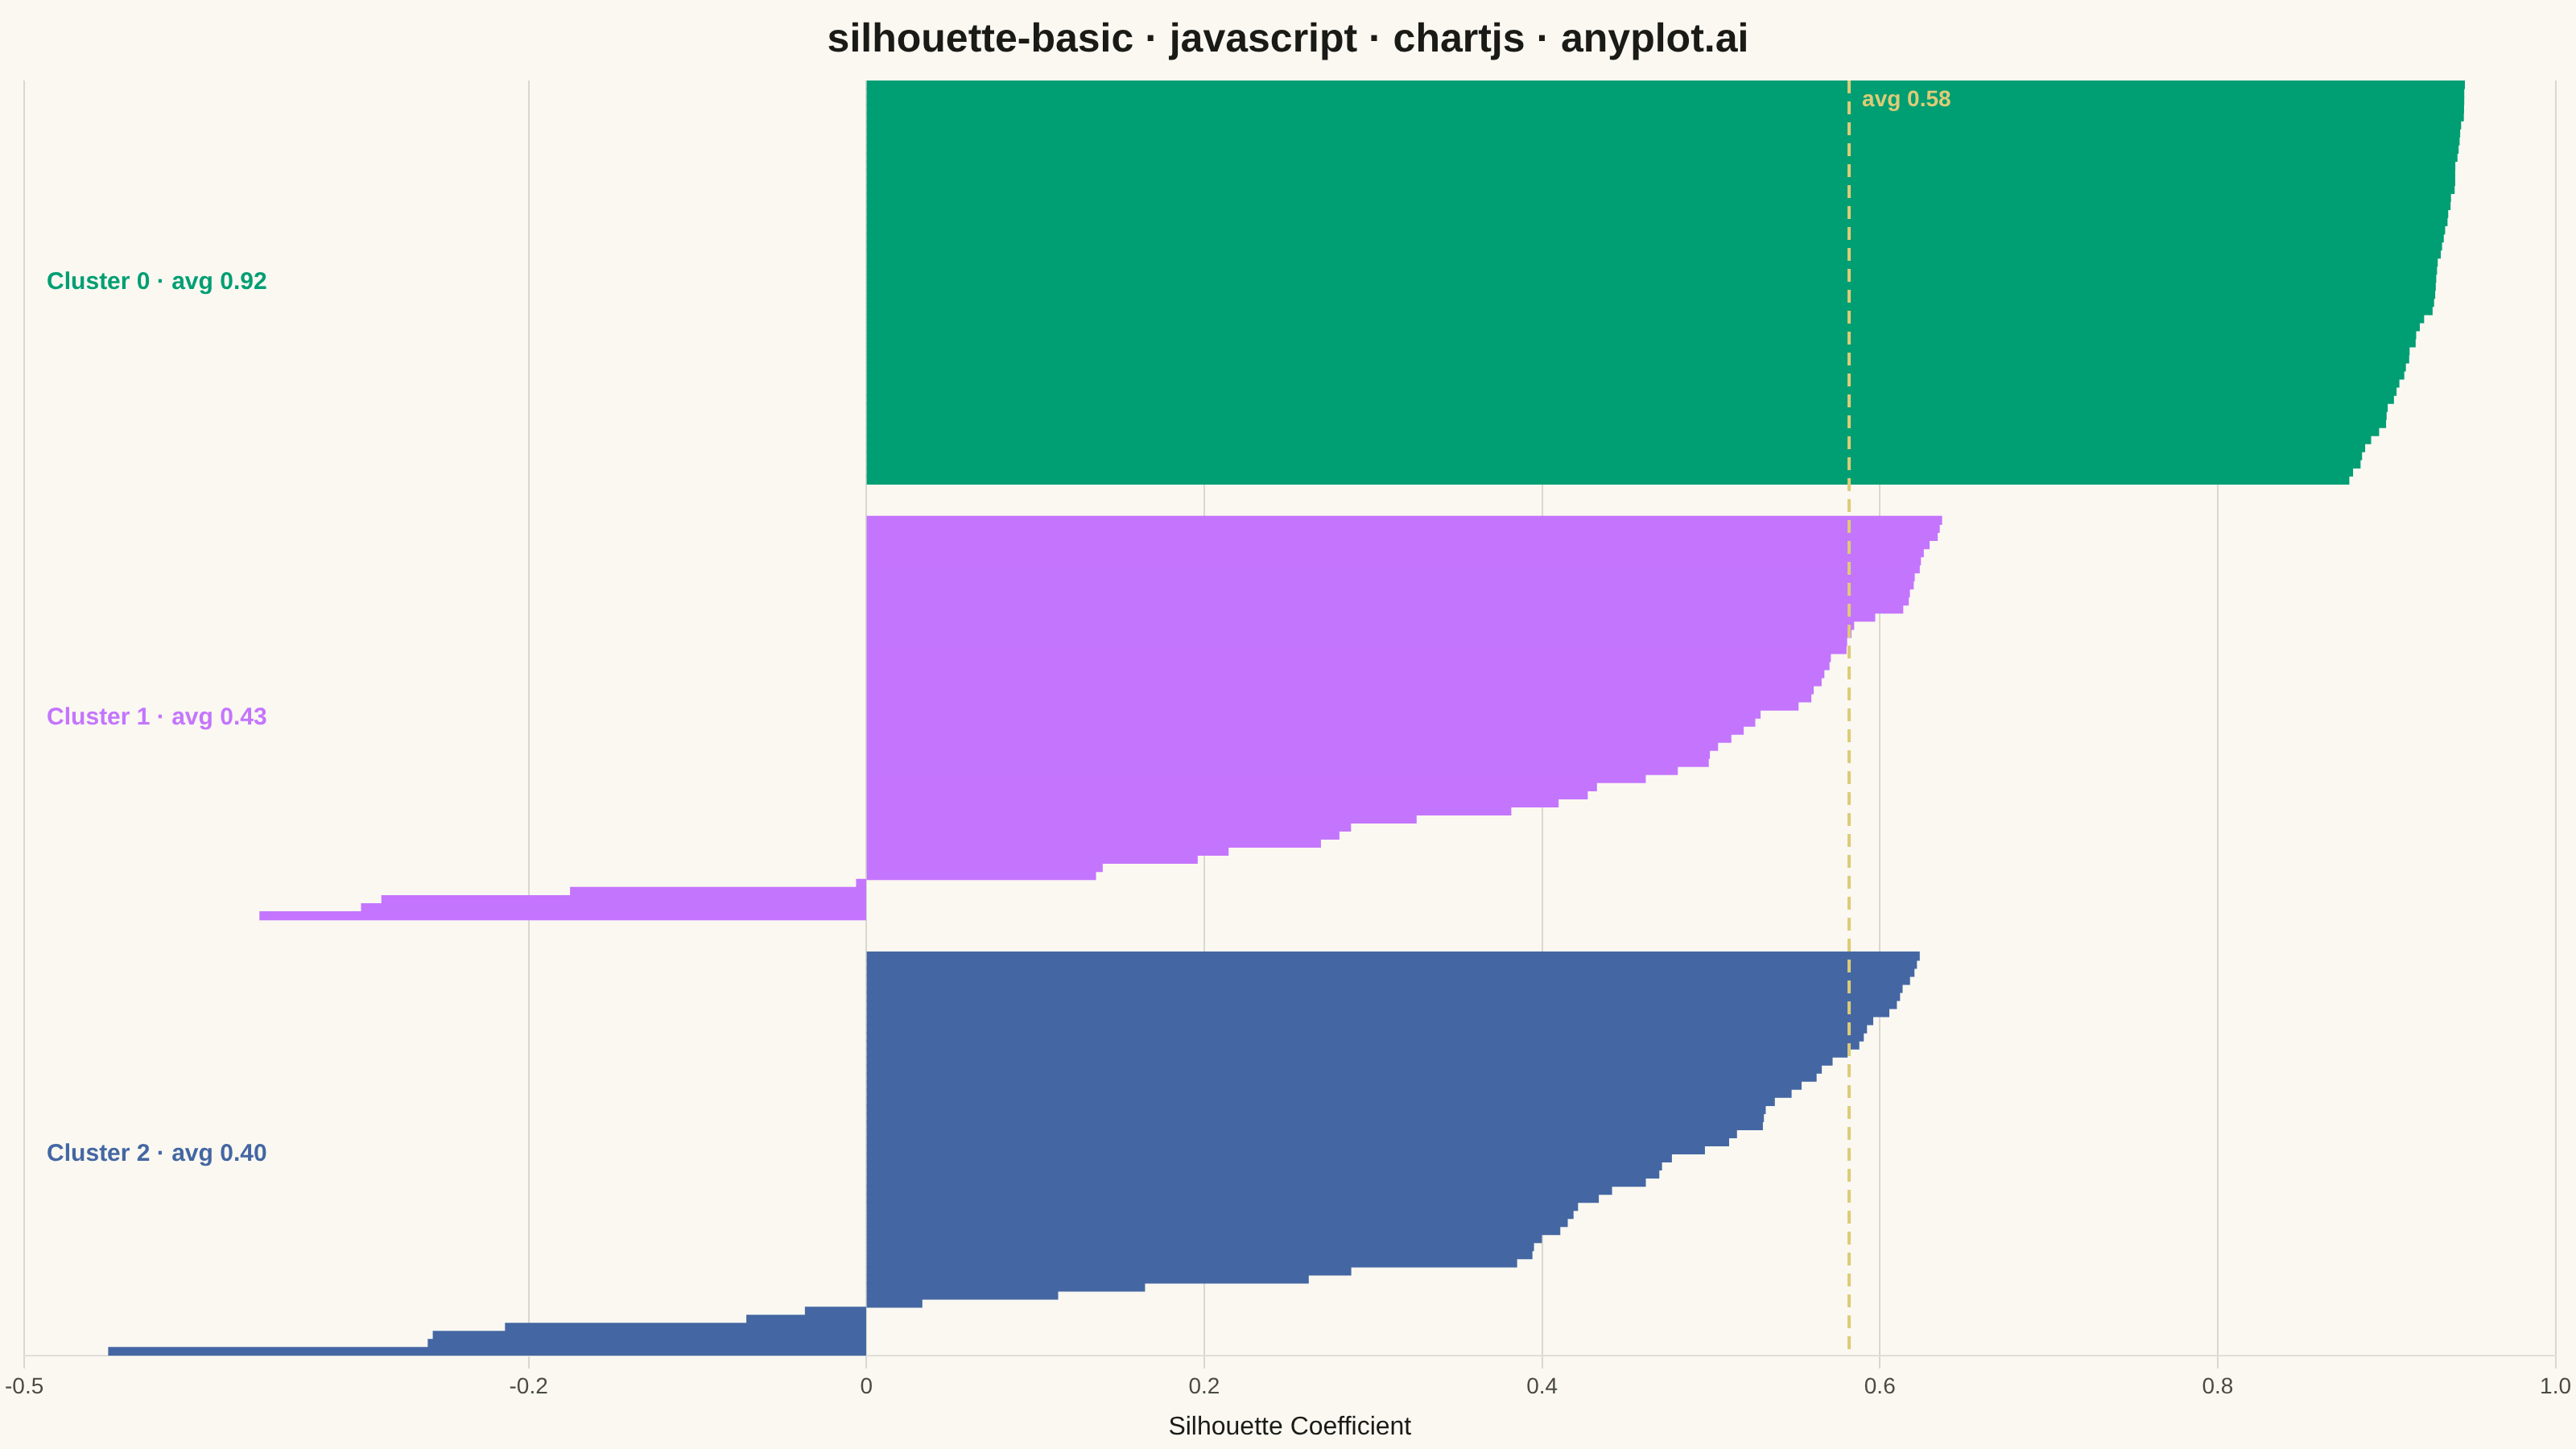
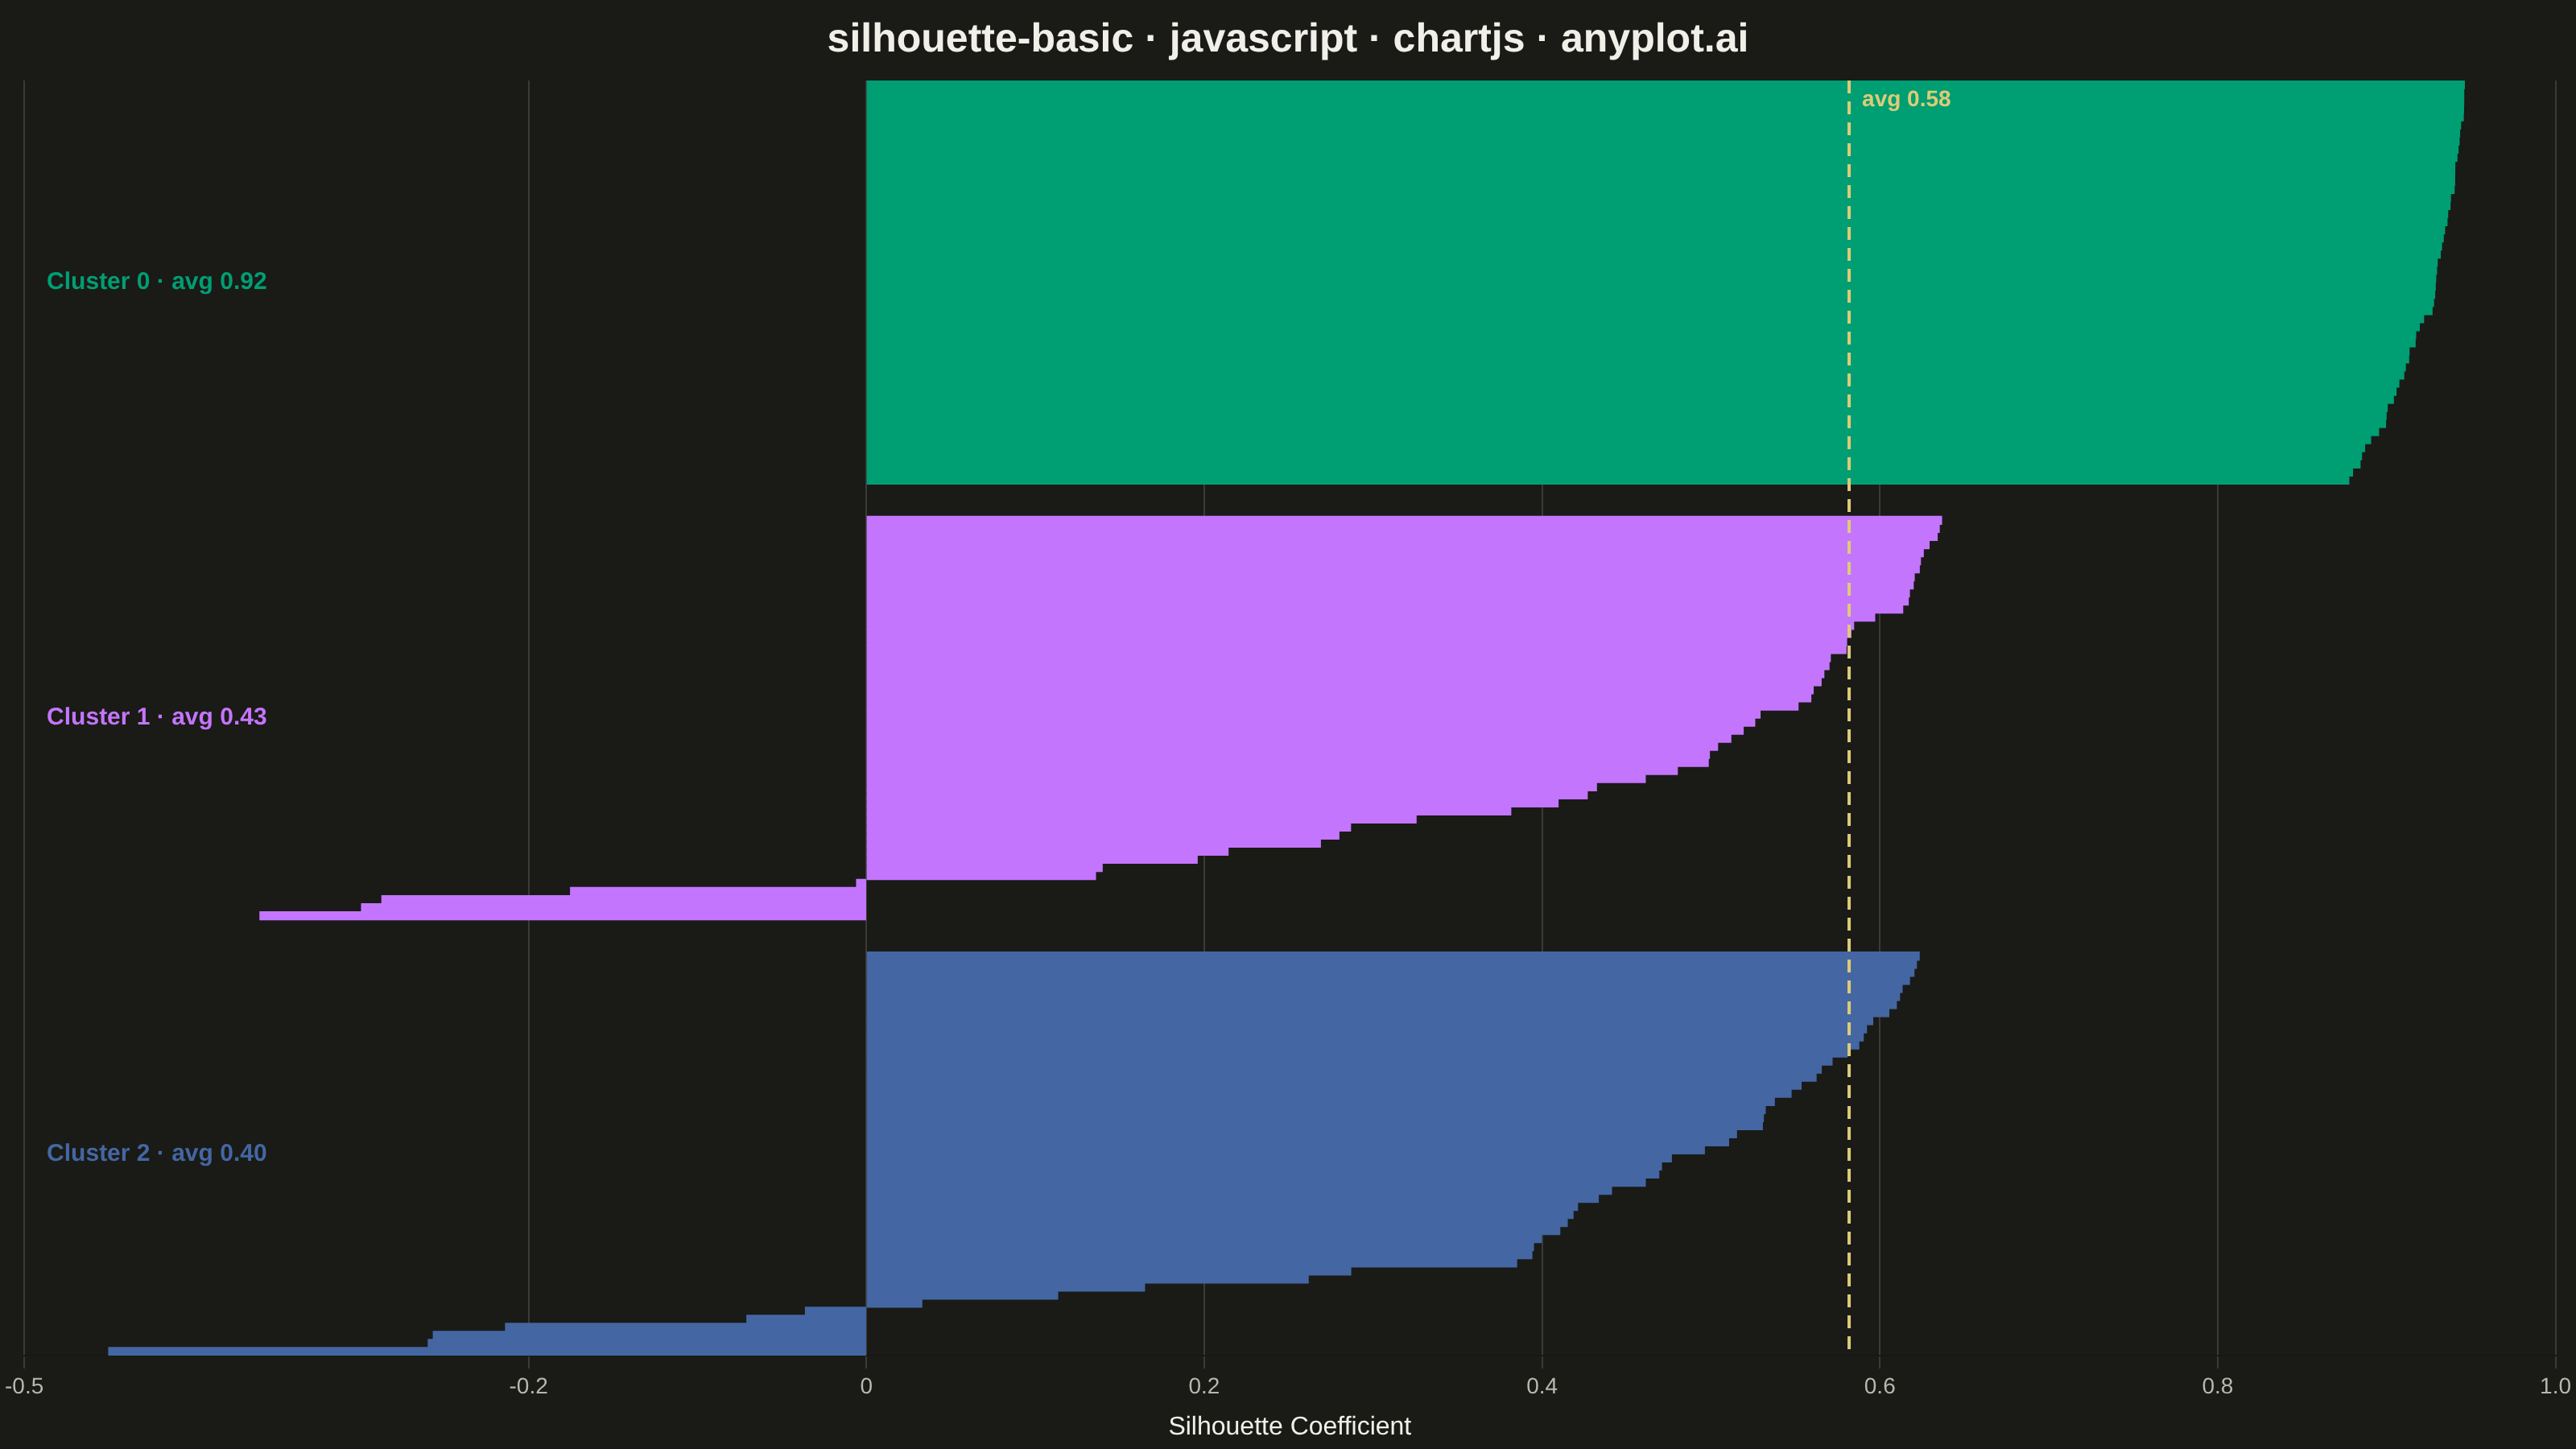
A silhouette plot visualizes the quality of clustering results by showing the silhouette coefficient for each sample, grouped by cluster assignment. Each horizontal bar represents a sample's silhouette score (-1 to 1), where positive values indicate good cluster membership and negative values suggest potential misclassification. This visualization helps evaluate cluster cohesion (how similar samples are to their own cluster) and separation (how distinct they are from neighboring clusters).
// anyplot.ai
// silhouette-basic: Silhouette Plot
// Library: chartjs 4.4.7 | JavaScript 22.23.2
// Quality: 89/100 | Created: 2026-09-09

//# anyplot-orientation: landscape
const t = window.ANYPLOT_TOKENS;

// --- PRNG (deterministic, no seeded Math.random in the browser) ------------
function makeLcg(seed) {
  let state = seed >>> 0;
  return () => {
    state = (state * 1664525 + 1013904223) >>> 0;
    return state / 4294967296;
  };
}
function gaussian(rng, mean, std) {
  const u1 = Math.max(rng(), 1e-9);
  const u2 = rng();
  const z = Math.sqrt(-2 * Math.log(u1)) * Math.cos(2 * Math.PI * u2);
  return mean + z * std;
}

// --- Data: synthetic petal measurements clustered into 3 species-like groups
const rng = makeLcg(42);
const clusterSpecs = [
  { center: [1.5, 0.3], spread: [0.18, 0.1], count: 50 },
  { center: [4.3, 1.3], spread: [0.55, 0.24], count: 50 },
  { center: [5.4, 1.9], spread: [0.6, 0.3], count: 50 },
];
const petalLength = [];
const petalWidth = [];
const clusterLabels = [];
clusterSpecs.forEach((spec, clusterIndex) => {
  for (let i = 0; i < spec.count; i++) {
    petalLength.push(gaussian(rng, spec.center[0], spec.spread[0]));
    petalWidth.push(gaussian(rng, spec.center[1], spec.spread[1]));
    clusterLabels.push(clusterIndex);
  }
});
const sampleCount = petalLength.length;

// --- Silhouette coefficient per sample (standard formula, Euclidean space) -
const silhouette = new Array(sampleCount).fill(0);
for (let i = 0; i < sampleCount; i++) {
  const ownCluster = clusterLabels[i];
  let cohesionSum = 0;
  let cohesionCount = 0;
  const separationSums = {};
  const separationCounts = {};
  for (let j = 0; j < sampleCount; j++) {
    if (i === j) continue;
    const dx = petalLength[i] - petalLength[j];
    const dy = petalWidth[i] - petalWidth[j];
    const d = Math.sqrt(dx * dx + dy * dy);
    if (clusterLabels[j] === ownCluster) {
      cohesionSum += d;
      cohesionCount++;
    } else {
      separationSums[clusterLabels[j]] = (separationSums[clusterLabels[j]] || 0) + d;
      separationCounts[clusterLabels[j]] = (separationCounts[clusterLabels[j]] || 0) + 1;
    }
  }
  const a = cohesionCount > 0 ? cohesionSum / cohesionCount : 0;
  const b = Math.min(
    ...Object.keys(separationSums).map((k) => separationSums[k] / separationCounts[k])
  );
  silhouette[i] = cohesionCount > 0 ? (b - a) / Math.max(a, b) : 0;
}

// --- Sort samples within each cluster (descending) and insert spacer gaps --
const GAP_ROWS = 4;
const barValues = [];
const barColors = [];
const clusterBounds = [];
clusterSpecs.forEach((_, clusterIndex) => {
  const indices = [];
  for (let i = 0; i < sampleCount; i++) {
    if (clusterLabels[i] === clusterIndex) indices.push(i);
  }
  indices.sort((a, b) => silhouette[b] - silhouette[a]);
  const startIndex = barValues.length;
  indices.forEach((i) => {
    barValues.push(silhouette[i]);
    barColors.push(t.palette[clusterIndex % t.palette.length]);
  });
  const avg = indices.reduce((sum, i) => sum + silhouette[i], 0) / indices.length;
  clusterBounds.push({ clusterIndex, startIndex, endIndex: barValues.length - 1, avg });
  if (clusterIndex < clusterSpecs.length - 1) {
    for (let g = 0; g < GAP_ROWS; g++) {
      barValues.push(0);
      barColors.push("transparent");
    }
  }
});
const overallAvg = silhouette.reduce((sum, v) => sum + v, 0) / sampleCount;
const minValue = Math.min(-0.1, Math.min(...silhouette) - 0.05);

// --- Mount -------------------------------------------------------------------
const canvas = document.createElement("canvas");
document.getElementById("container").appendChild(canvas);

// --- Custom plugin: overall-average reference line + per-cluster averages --
const silhouetteAnnotations = {
  id: "silhouetteAnnotations",
  afterDatasetsDraw(chart) {
    const { ctx, chartArea, scales } = chart;
    ctx.save();

    const avgX = scales.x.getPixelForValue(overallAvg);
    ctx.strokeStyle = t.amber;
    ctx.lineWidth = 2;
    ctx.setLineDash([8, 5]);
    ctx.beginPath();
    ctx.moveTo(avgX, chartArea.top);
    ctx.lineTo(avgX, chartArea.bottom);
    ctx.stroke();
    ctx.setLineDash([]);

    const avgLabel = `avg ${overallAvg.toFixed(2)}`;
    ctx.font = "600 14px sans-serif";
    ctx.fillStyle = t.amber;
    ctx.textBaseline = "alphabetic";
    const nearRightEdge = avgX > chartArea.right - 100;
    ctx.textAlign = nearRightEdge ? "right" : "left";
    ctx.fillText(avgLabel, nearRightEdge ? avgX - 8 : avgX + 8, chartArea.top + 16);

    ctx.font = "600 15px sans-serif";
    ctx.textBaseline = "middle";
    ctx.textAlign = "left";
    clusterBounds.forEach(({ clusterIndex, startIndex, endIndex, avg }) => {
      const yTop = scales.y.getPixelForValue(startIndex);
      const yBottom = scales.y.getPixelForValue(endIndex);
      ctx.fillStyle = t.palette[clusterIndex % t.palette.length];
      ctx.fillText(`Cluster ${clusterIndex} · avg ${avg.toFixed(2)}`, chartArea.left + 14, (yTop + yBottom) / 2);
    });

    ctx.restore();
  },
};

// --- Chart -------------------------------------------------------------------
new Chart(canvas, {
  type: "bar",
  data: {
    labels: barValues.map((_, i) => i),
    datasets: [
      {
        data: barValues,
        backgroundColor: barColors,
        borderWidth: 0,
        barPercentage: 1.0,
        categoryPercentage: 1.0,
      },
    ],
  },
  options: {
    indexAxis: "y",
    responsive: true,
    maintainAspectRatio: false,
    animation: false,
    plugins: {
      title: {
        display: true,
        text: "silhouette-basic · javascript · chartjs · anyplot.ai",
        color: t.ink,
        font: { size: 25 },
      },
      legend: { display: false },
    },
    scales: {
      x: {
        min: minValue,
        max: 1,
        title: { display: true, text: "Silhouette Coefficient", color: t.ink, font: { size: 16 } },
        ticks: { color: t.inkSoft, font: { size: 14 } },
        grid: { color: t.grid },
      },
      y: {
        display: false,
        grid: { display: false },
      },
    },
  },
  plugins: [silhouetteAnnotations],
});
Runnable source as JSON, for any HTTP client: https://api.anyplot.ai/specs/silhouette-basic/chartjs/code. Any spec id and library id listed in llms-full.txt fit the same URL shape; every URL below is complete and callable.
{
  "spec_id": "silhouette-basic",
  "language": "javascript",
  "library": "chartjs",
  "page": "https://anyplot.ai/silhouette-basic/javascript/chartjs",
  "hub": "https://anyplot.ai/silhouette-basic",
  "code_json": "https://api.anyplot.ai/specs/silhouette-basic/chartjs/code",
  "spec_json": "https://api.anyplot.ai/specs/silhouette-basic",
  "render_light_png": "https://storage.googleapis.com/anyplot-images/plots/silhouette-basic/javascript/chartjs/plot-light.png",
  "render_dark_png": "https://storage.googleapis.com/anyplot-images/plots/silhouette-basic/javascript/chartjs/plot-dark.png",
  "interactive_light_html": "https://storage.googleapis.com/anyplot-images/plots/silhouette-basic/javascript/chartjs/plot-light.html",
  "interactive_dark_html": "https://storage.googleapis.com/anyplot-images/plots/silhouette-basic/javascript/chartjs/plot-dark.html",
  "quality_score": 89.0,
  "license": "MIT",
  "guide": "https://anyplot.ai/llms.txt"
}
Part of Silhouette Plot on anyplot.ai.