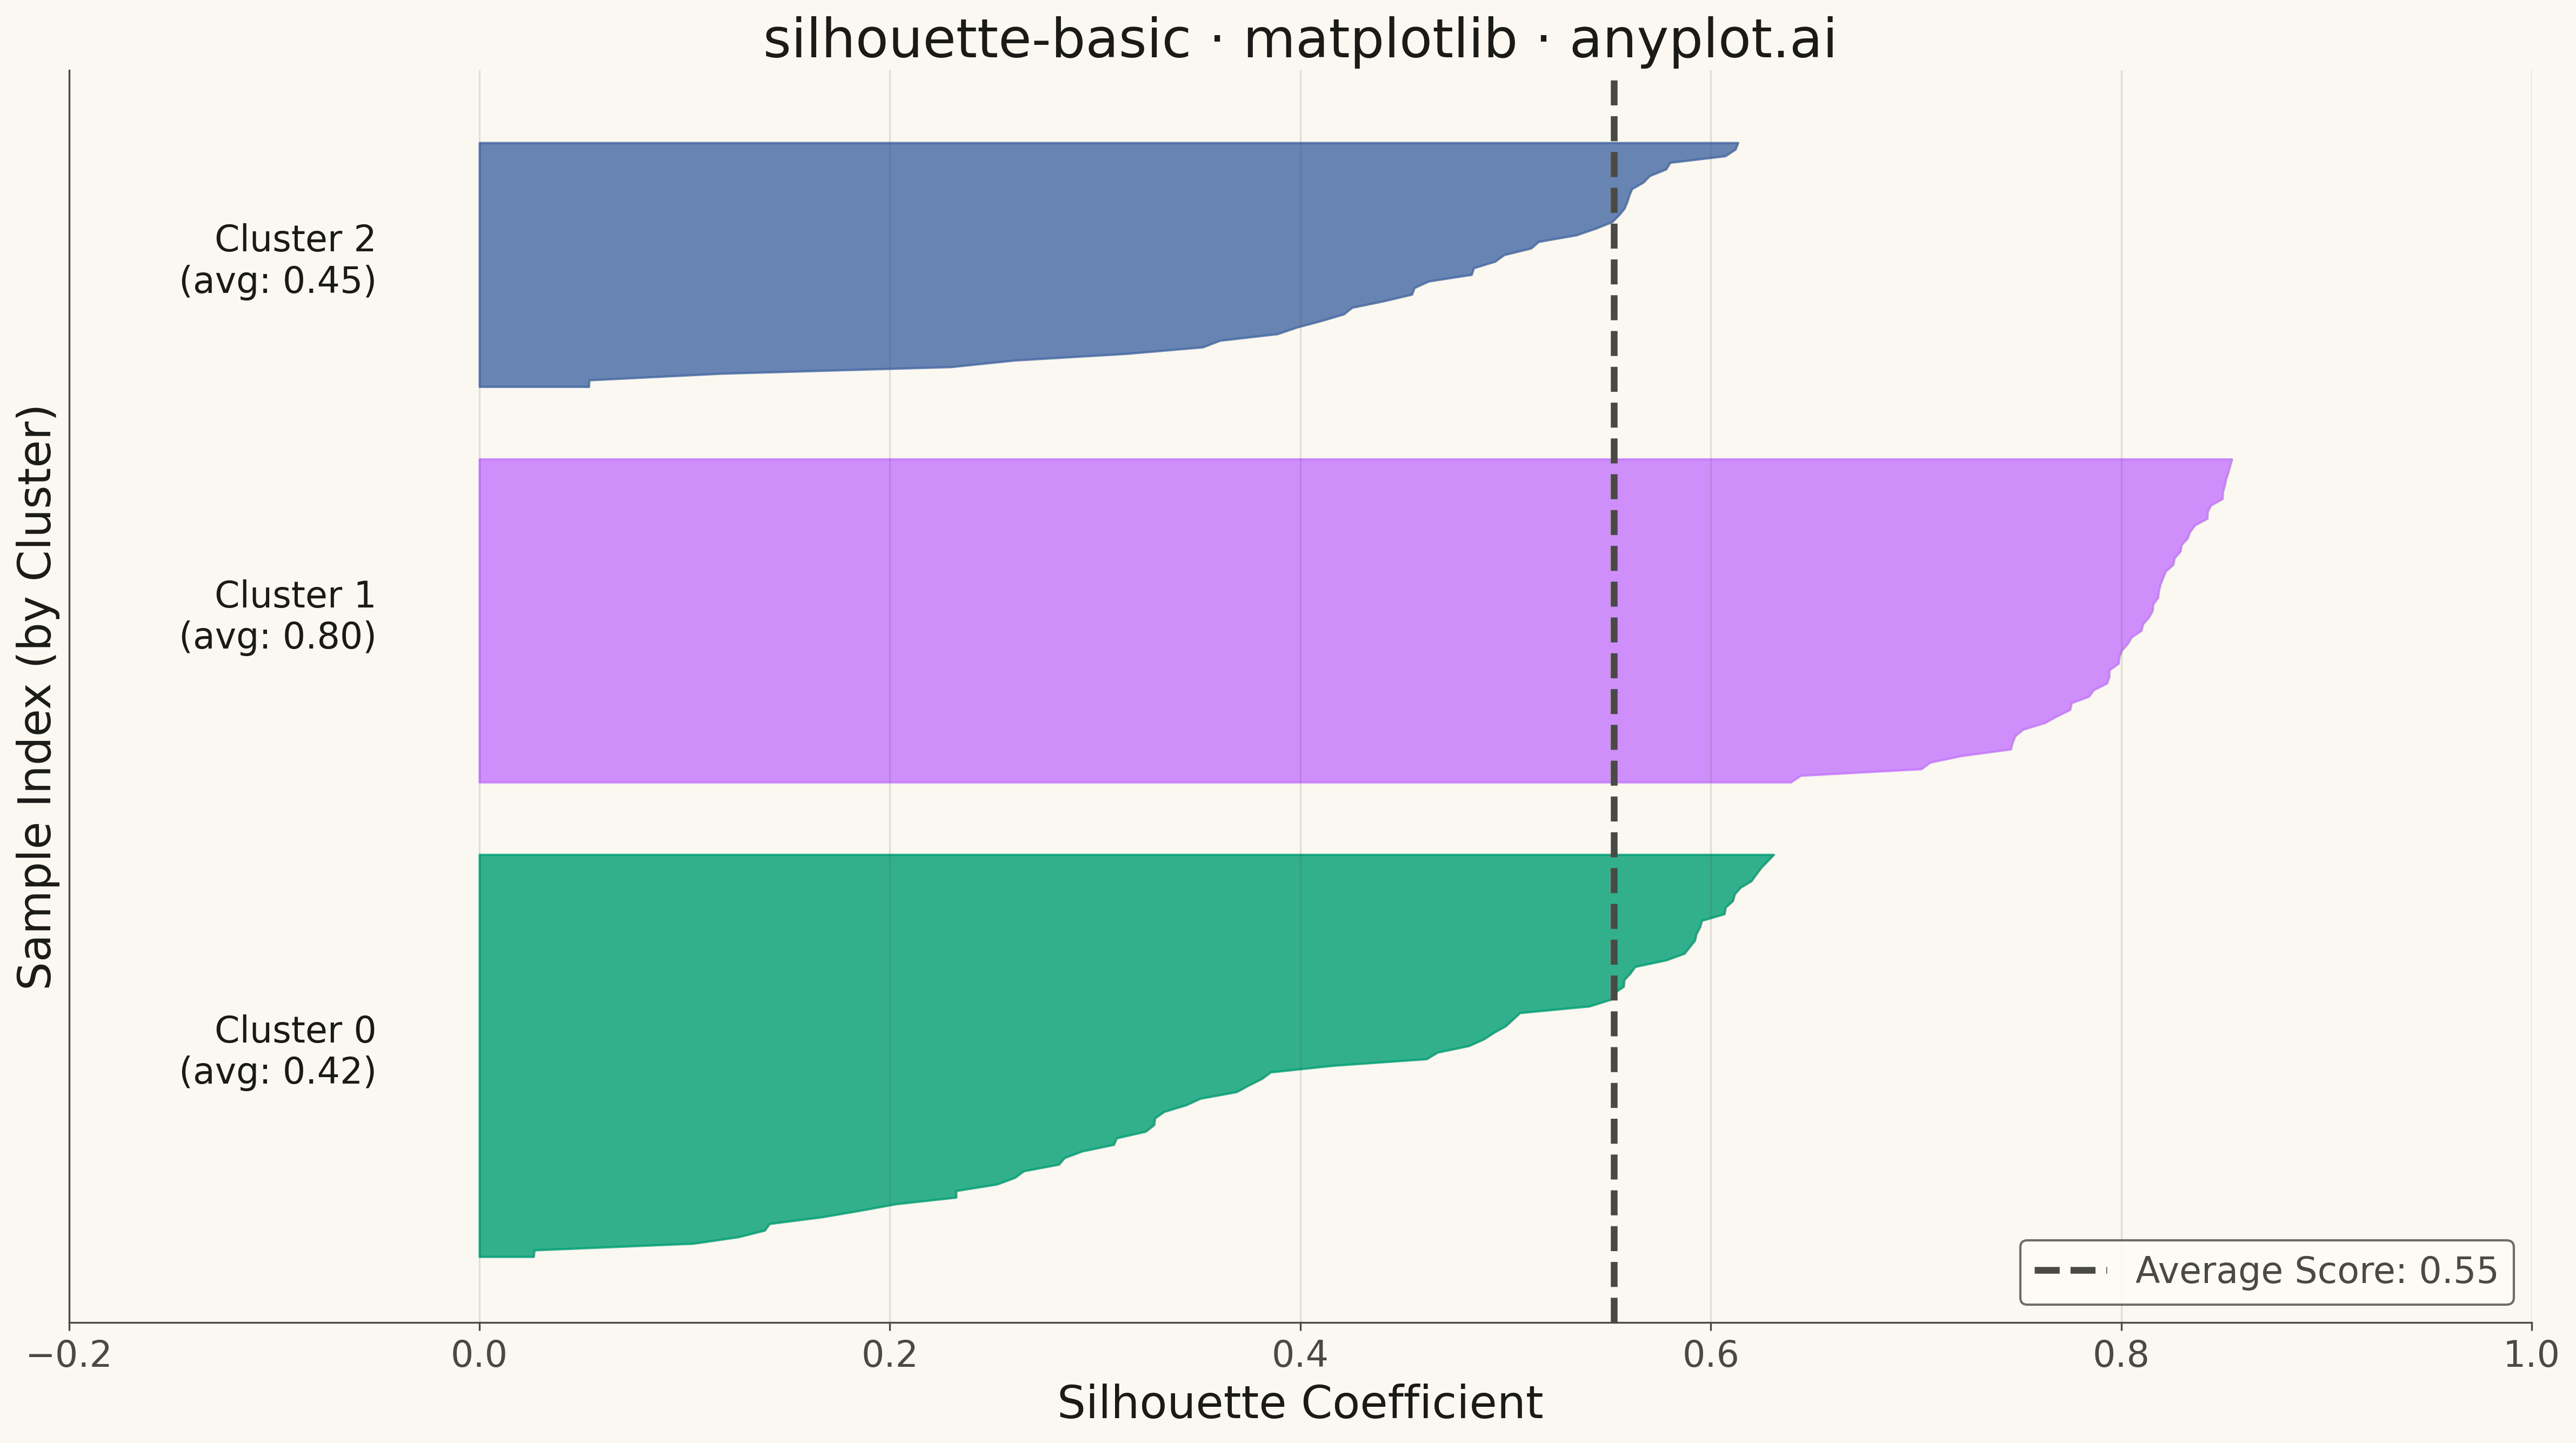
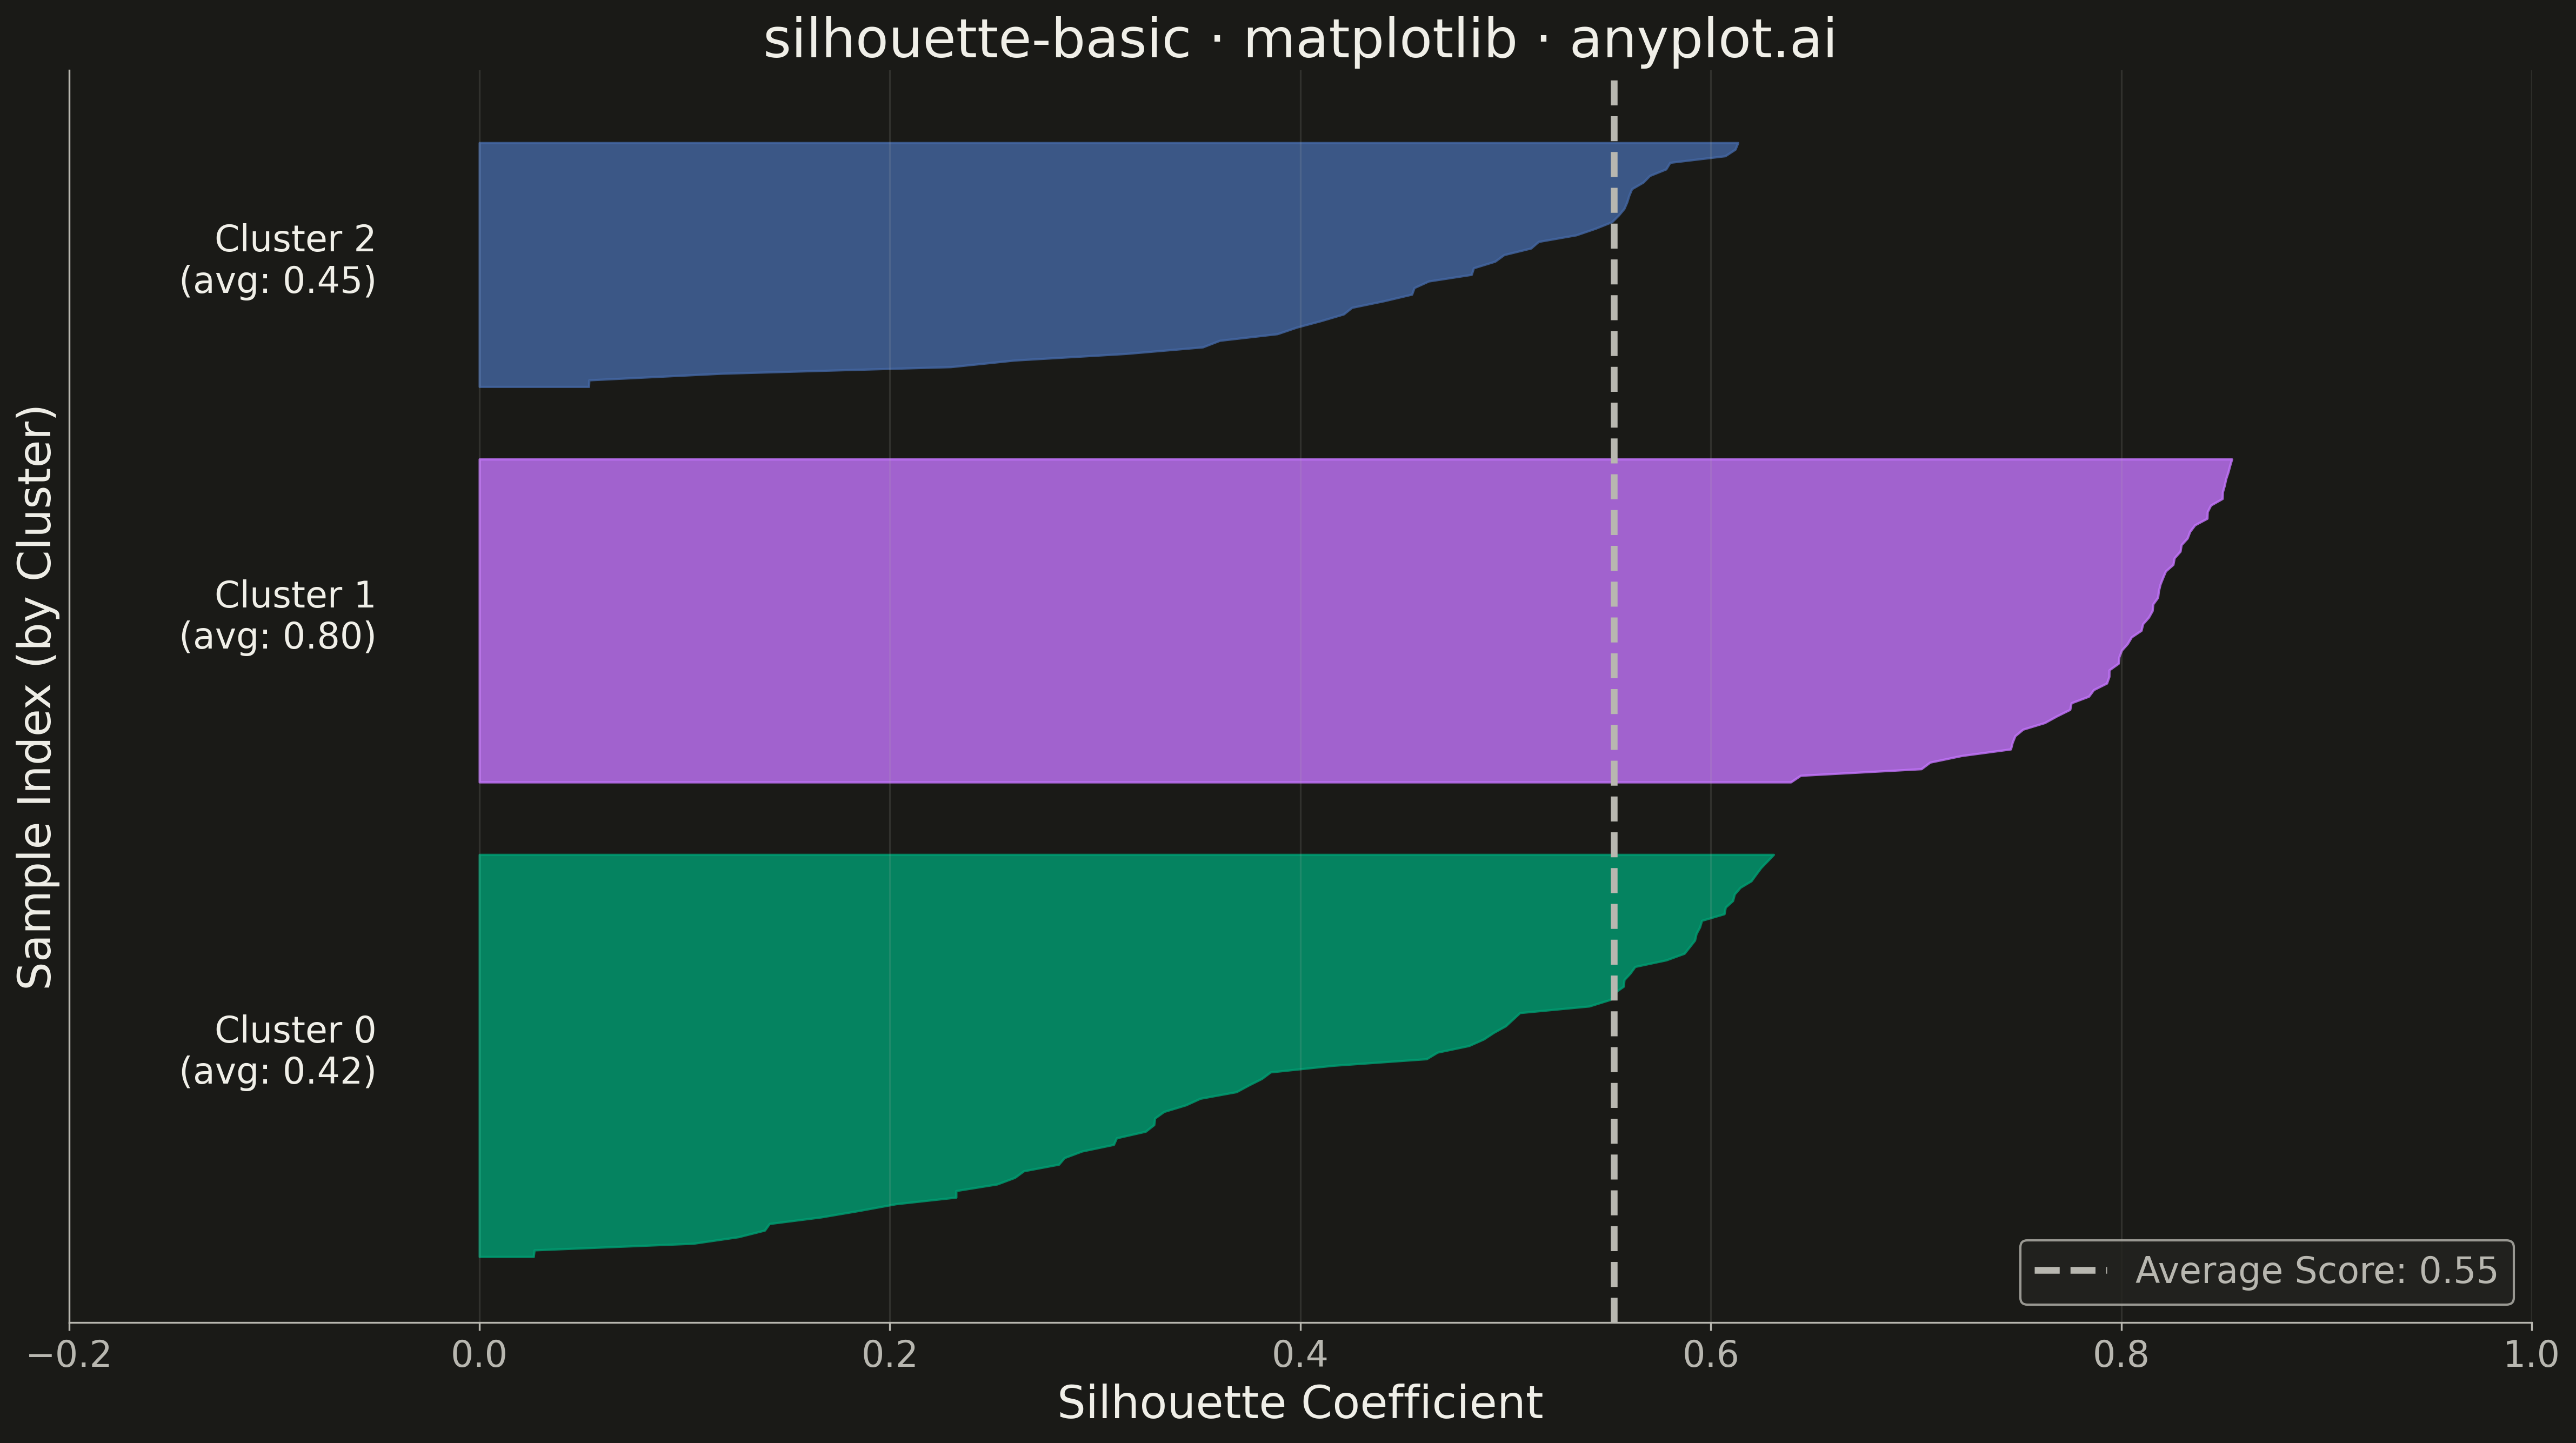
A silhouette plot visualizes the quality of clustering results by showing the silhouette coefficient for each sample, grouped by cluster assignment. Each horizontal bar represents a sample's silhouette score (-1 to 1), where positive values indicate good cluster membership and negative values suggest potential misclassification. This visualization helps evaluate cluster cohesion (how similar samples are to their own cluster) and separation (how distinct they are from neighboring clusters).
""" anyplot.ai
silhouette-basic: Silhouette Plot
Library: matplotlib 3.10.9 | Python 3.13.13
Quality: 90/100 | Updated: 2026-05-10
"""

import os

import matplotlib.pyplot as plt
import numpy as np
from sklearn.cluster import KMeans
from sklearn.datasets import load_iris
from sklearn.metrics import silhouette_samples, silhouette_score


# Theme tokens
THEME = os.getenv("ANYPLOT_THEME", "light")
PAGE_BG = "#FAF8F1" if THEME == "light" else "#1A1A17"
ELEVATED_BG = "#FFFDF6" if THEME == "light" else "#242420"
INK = "#1A1A17" if THEME == "light" else "#F0EFE8"
INK_SOFT = "#4A4A44" if THEME == "light" else "#B8B7B0"

# Okabe-Ito palette for clusters
IMPRINT = ["#009E73", "#C475FD", "#4467A3", "#BD8233", "#AE3030", "#2ABCCD", "#954477"]

# Data - use iris dataset for realistic clustering example
iris = load_iris()
X = iris.data
n_clusters = 3

# Perform clustering
kmeans = KMeans(n_clusters=n_clusters, random_state=42, n_init=10)
cluster_labels = kmeans.fit_predict(X)

# Calculate silhouette scores
silhouette_avg = silhouette_score(X, cluster_labels)
sample_silhouette_values = silhouette_samples(X, cluster_labels)

# Plot
fig, ax = plt.subplots(figsize=(16, 9), facecolor=PAGE_BG)
ax.set_facecolor(PAGE_BG)

y_lower = 10
for i in range(n_clusters):
    # Get silhouette values for cluster i and sort them
    ith_cluster_silhouette_values = sample_silhouette_values[cluster_labels == i]
    ith_cluster_silhouette_values.sort()

    size_cluster_i = ith_cluster_silhouette_values.shape[0]
    y_upper = y_lower + size_cluster_i

    # Fill horizontal bars for each sample
    ax.fill_betweenx(
        np.arange(y_lower, y_upper),
        0,
        ith_cluster_silhouette_values,
        facecolor=IMPRINT[i % len(IMPRINT)],
        edgecolor=IMPRINT[i % len(IMPRINT)],
        alpha=0.8,
    )

    # Annotate cluster with its average silhouette score
    cluster_avg = np.mean(ith_cluster_silhouette_values)
    ax.text(
        -0.05,
        y_lower + 0.5 * size_cluster_i,
        f"Cluster {i}\n(avg: {cluster_avg:.2f})",
        fontsize=16,
        verticalalignment="center",
        horizontalalignment="right",
        color=INK,
    )

    y_lower = y_upper + 10  # Gap between clusters

# Add vertical line for average silhouette score
ax.axvline(x=silhouette_avg, color=INK_SOFT, linestyle="--", linewidth=3, label=f"Average Score: {silhouette_avg:.2f}")

# Style
ax.set_xlabel("Silhouette Coefficient", fontsize=20, color=INK)
ax.set_ylabel("Sample Index (by Cluster)", fontsize=20, color=INK)
ax.set_title("silhouette-basic · matplotlib · anyplot.ai", fontsize=24, fontweight="medium", color=INK)

ax.tick_params(axis="both", labelsize=16, colors=INK_SOFT)
ax.set_xlim([-0.2, 1.0])
ax.set_ylim([0, y_lower])
ax.set_yticks([])  # Hide y-axis ticks as they're not meaningful

# Spine styling
for spine in ["top", "right"]:
    ax.spines[spine].set_visible(False)
for spine in ["left", "bottom"]:
    ax.spines[spine].set_color(INK_SOFT)

# Legend
leg = ax.legend(fontsize=16, loc="lower right")
if leg:
    leg.get_frame().set_facecolor(ELEVATED_BG)
    leg.get_frame().set_edgecolor(INK_SOFT)
    leg.get_frame().set_linewidth(1)
    plt.setp(leg.get_texts(), color=INK_SOFT)

ax.grid(True, alpha=0.15, linestyle="-", axis="x", color=INK_SOFT, linewidth=0.8)

plt.tight_layout()
plt.savefig(f"plot-{THEME}.png", dpi=300, bbox_inches="tight", facecolor=PAGE_BG)
Runnable source as JSON, for any HTTP client: https://api.anyplot.ai/specs/silhouette-basic/matplotlib/code. Any spec id and library id listed in llms-full.txt fit the same URL shape; every URL below is complete and callable.
{
  "spec_id": "silhouette-basic",
  "language": "python",
  "library": "matplotlib",
  "page": "https://anyplot.ai/silhouette-basic/python/matplotlib",
  "hub": "https://anyplot.ai/silhouette-basic",
  "code_json": "https://api.anyplot.ai/specs/silhouette-basic/matplotlib/code",
  "spec_json": "https://api.anyplot.ai/specs/silhouette-basic",
  "render_light_png": "https://storage.googleapis.com/anyplot-images/plots/silhouette-basic/python/matplotlib/plot-light.png",
  "render_dark_png": "https://storage.googleapis.com/anyplot-images/plots/silhouette-basic/python/matplotlib/plot-dark.png",
  "quality_score": 90.0,
  "license": "MIT",
  "guide": "https://anyplot.ai/llms.txt"
}
Part of Silhouette Plot on anyplot.ai.