The same plot in 14 other libraries — JavaScript: Chart.js, D3.js, Apache ECharts, Highcharts; Python: Altair, Bokeh, lets-plot, Matplotlib, Plotly, plotnine, Pygal, Seaborn; R: ggplot2; Julia: Makie.jl. Compare all 15 side by side: Silhouette Plot in Python, R, Julia and JavaScript.
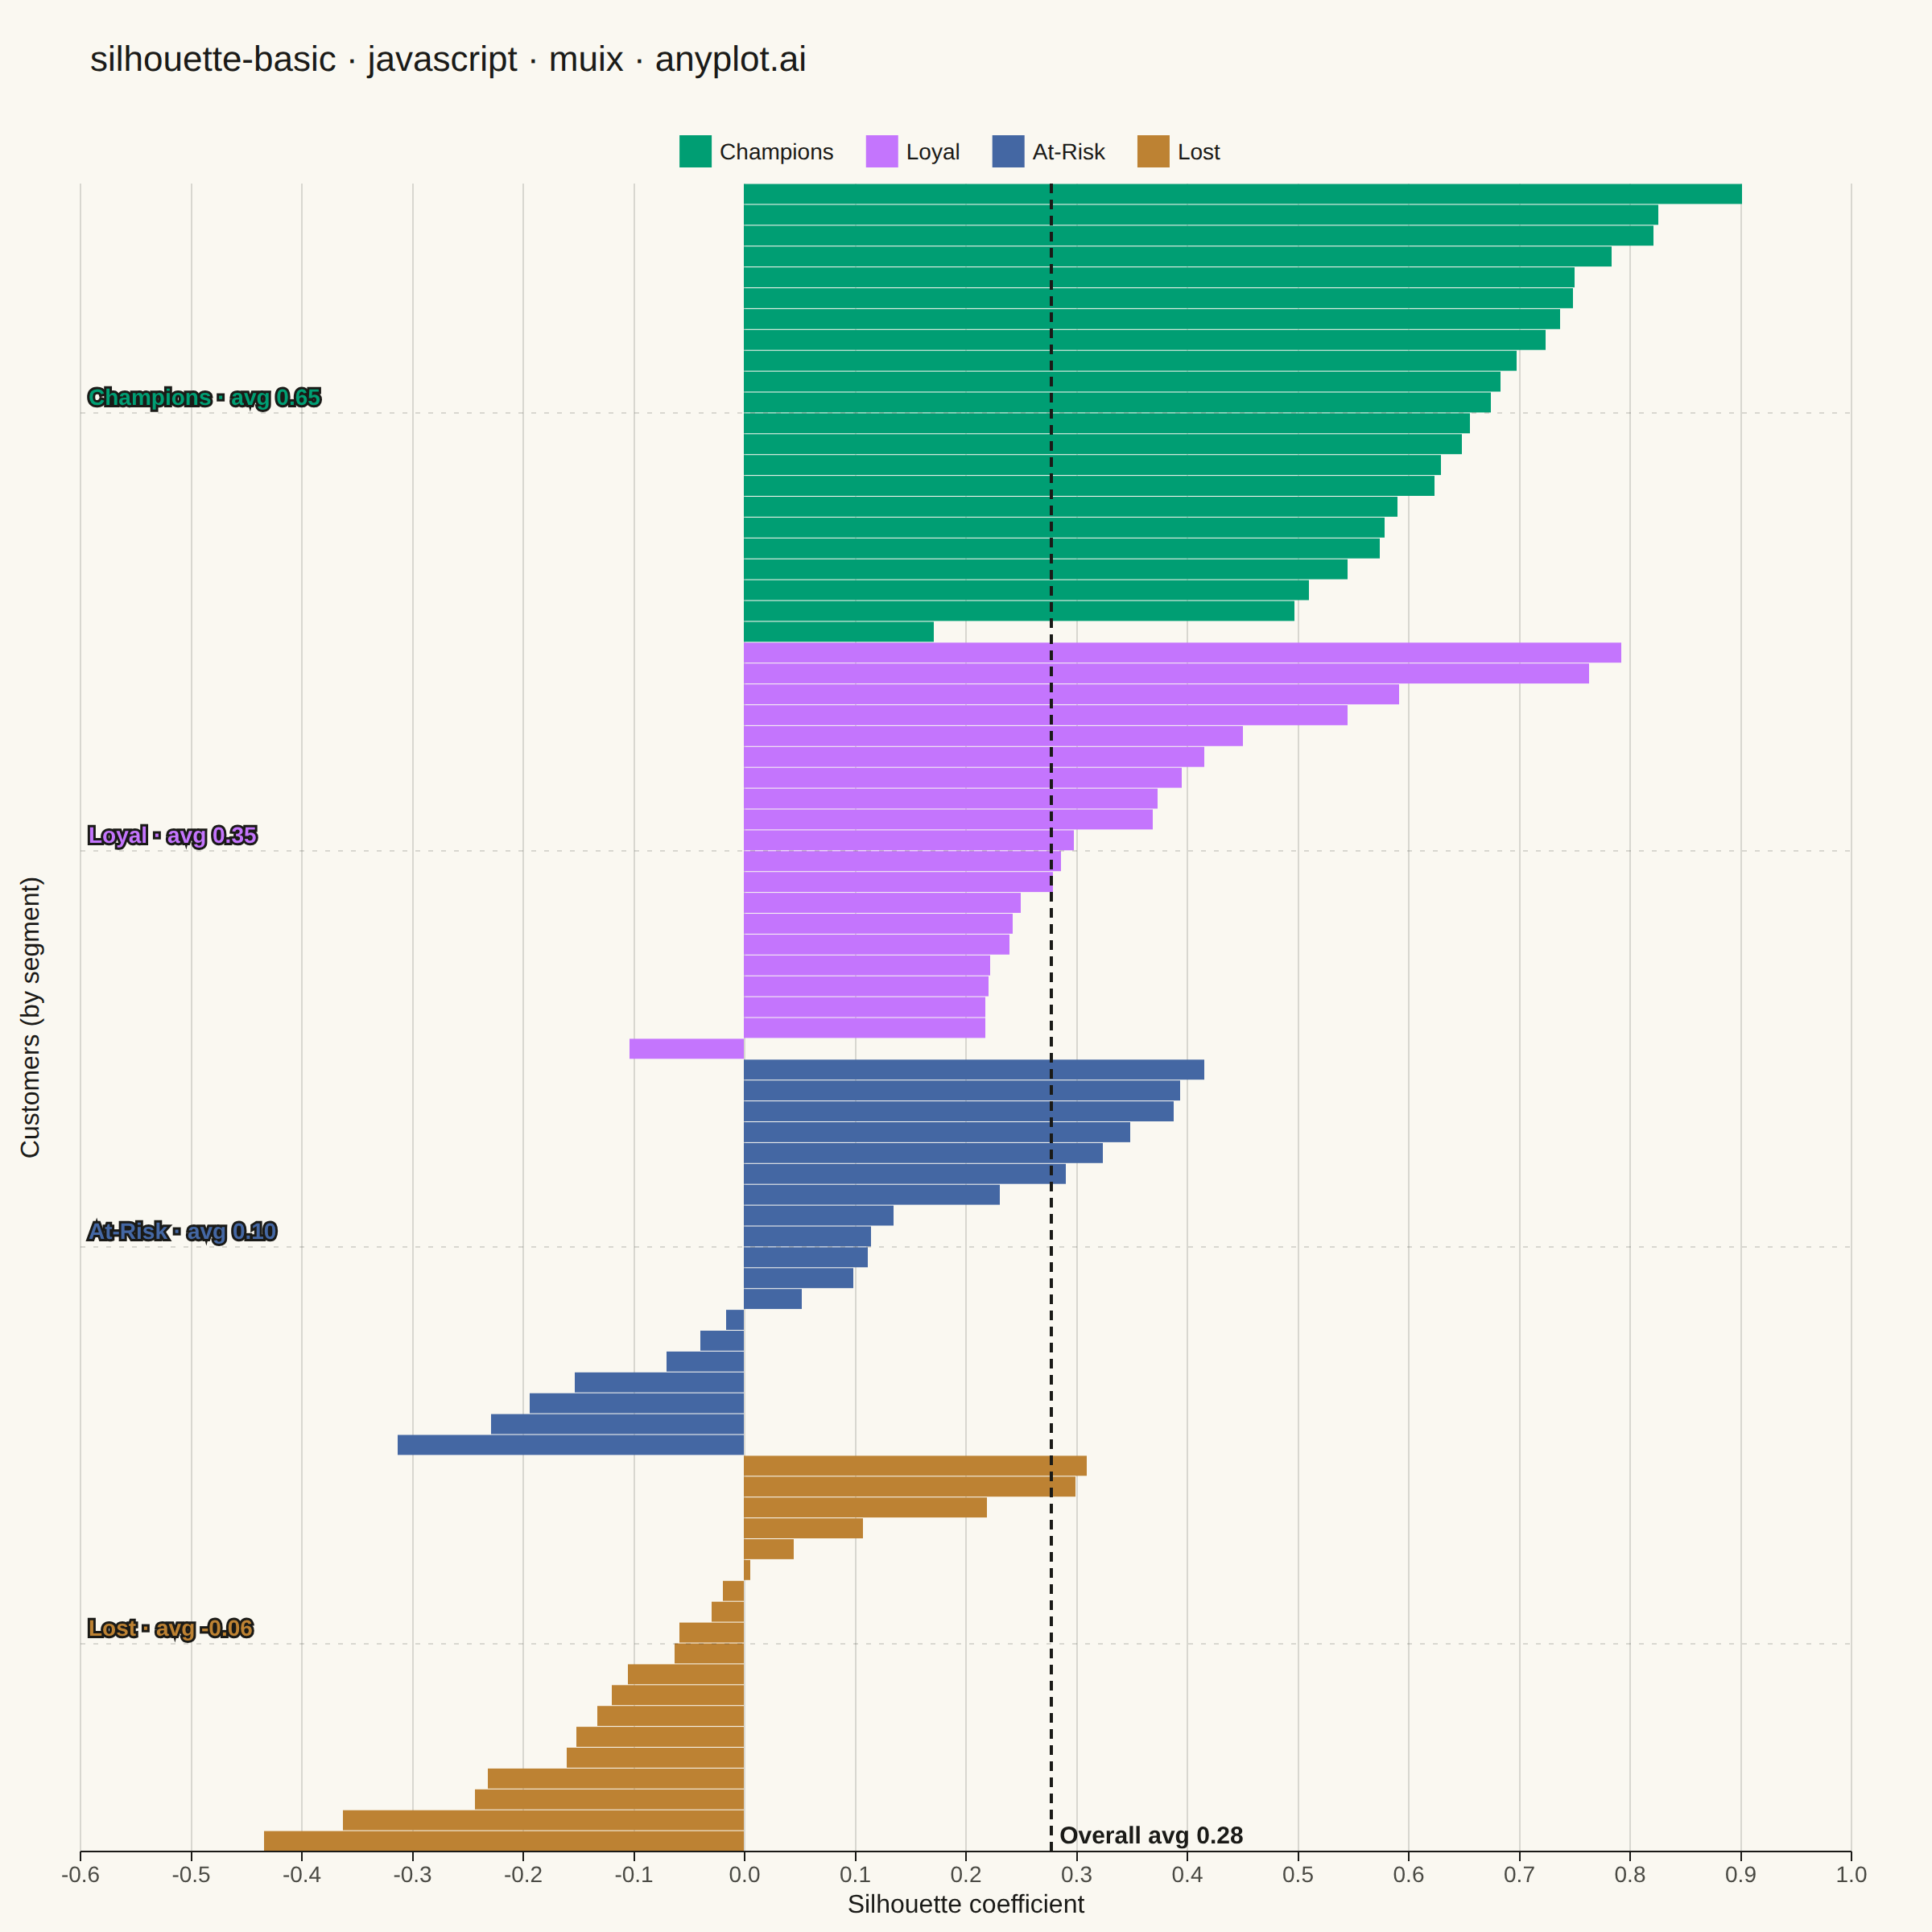
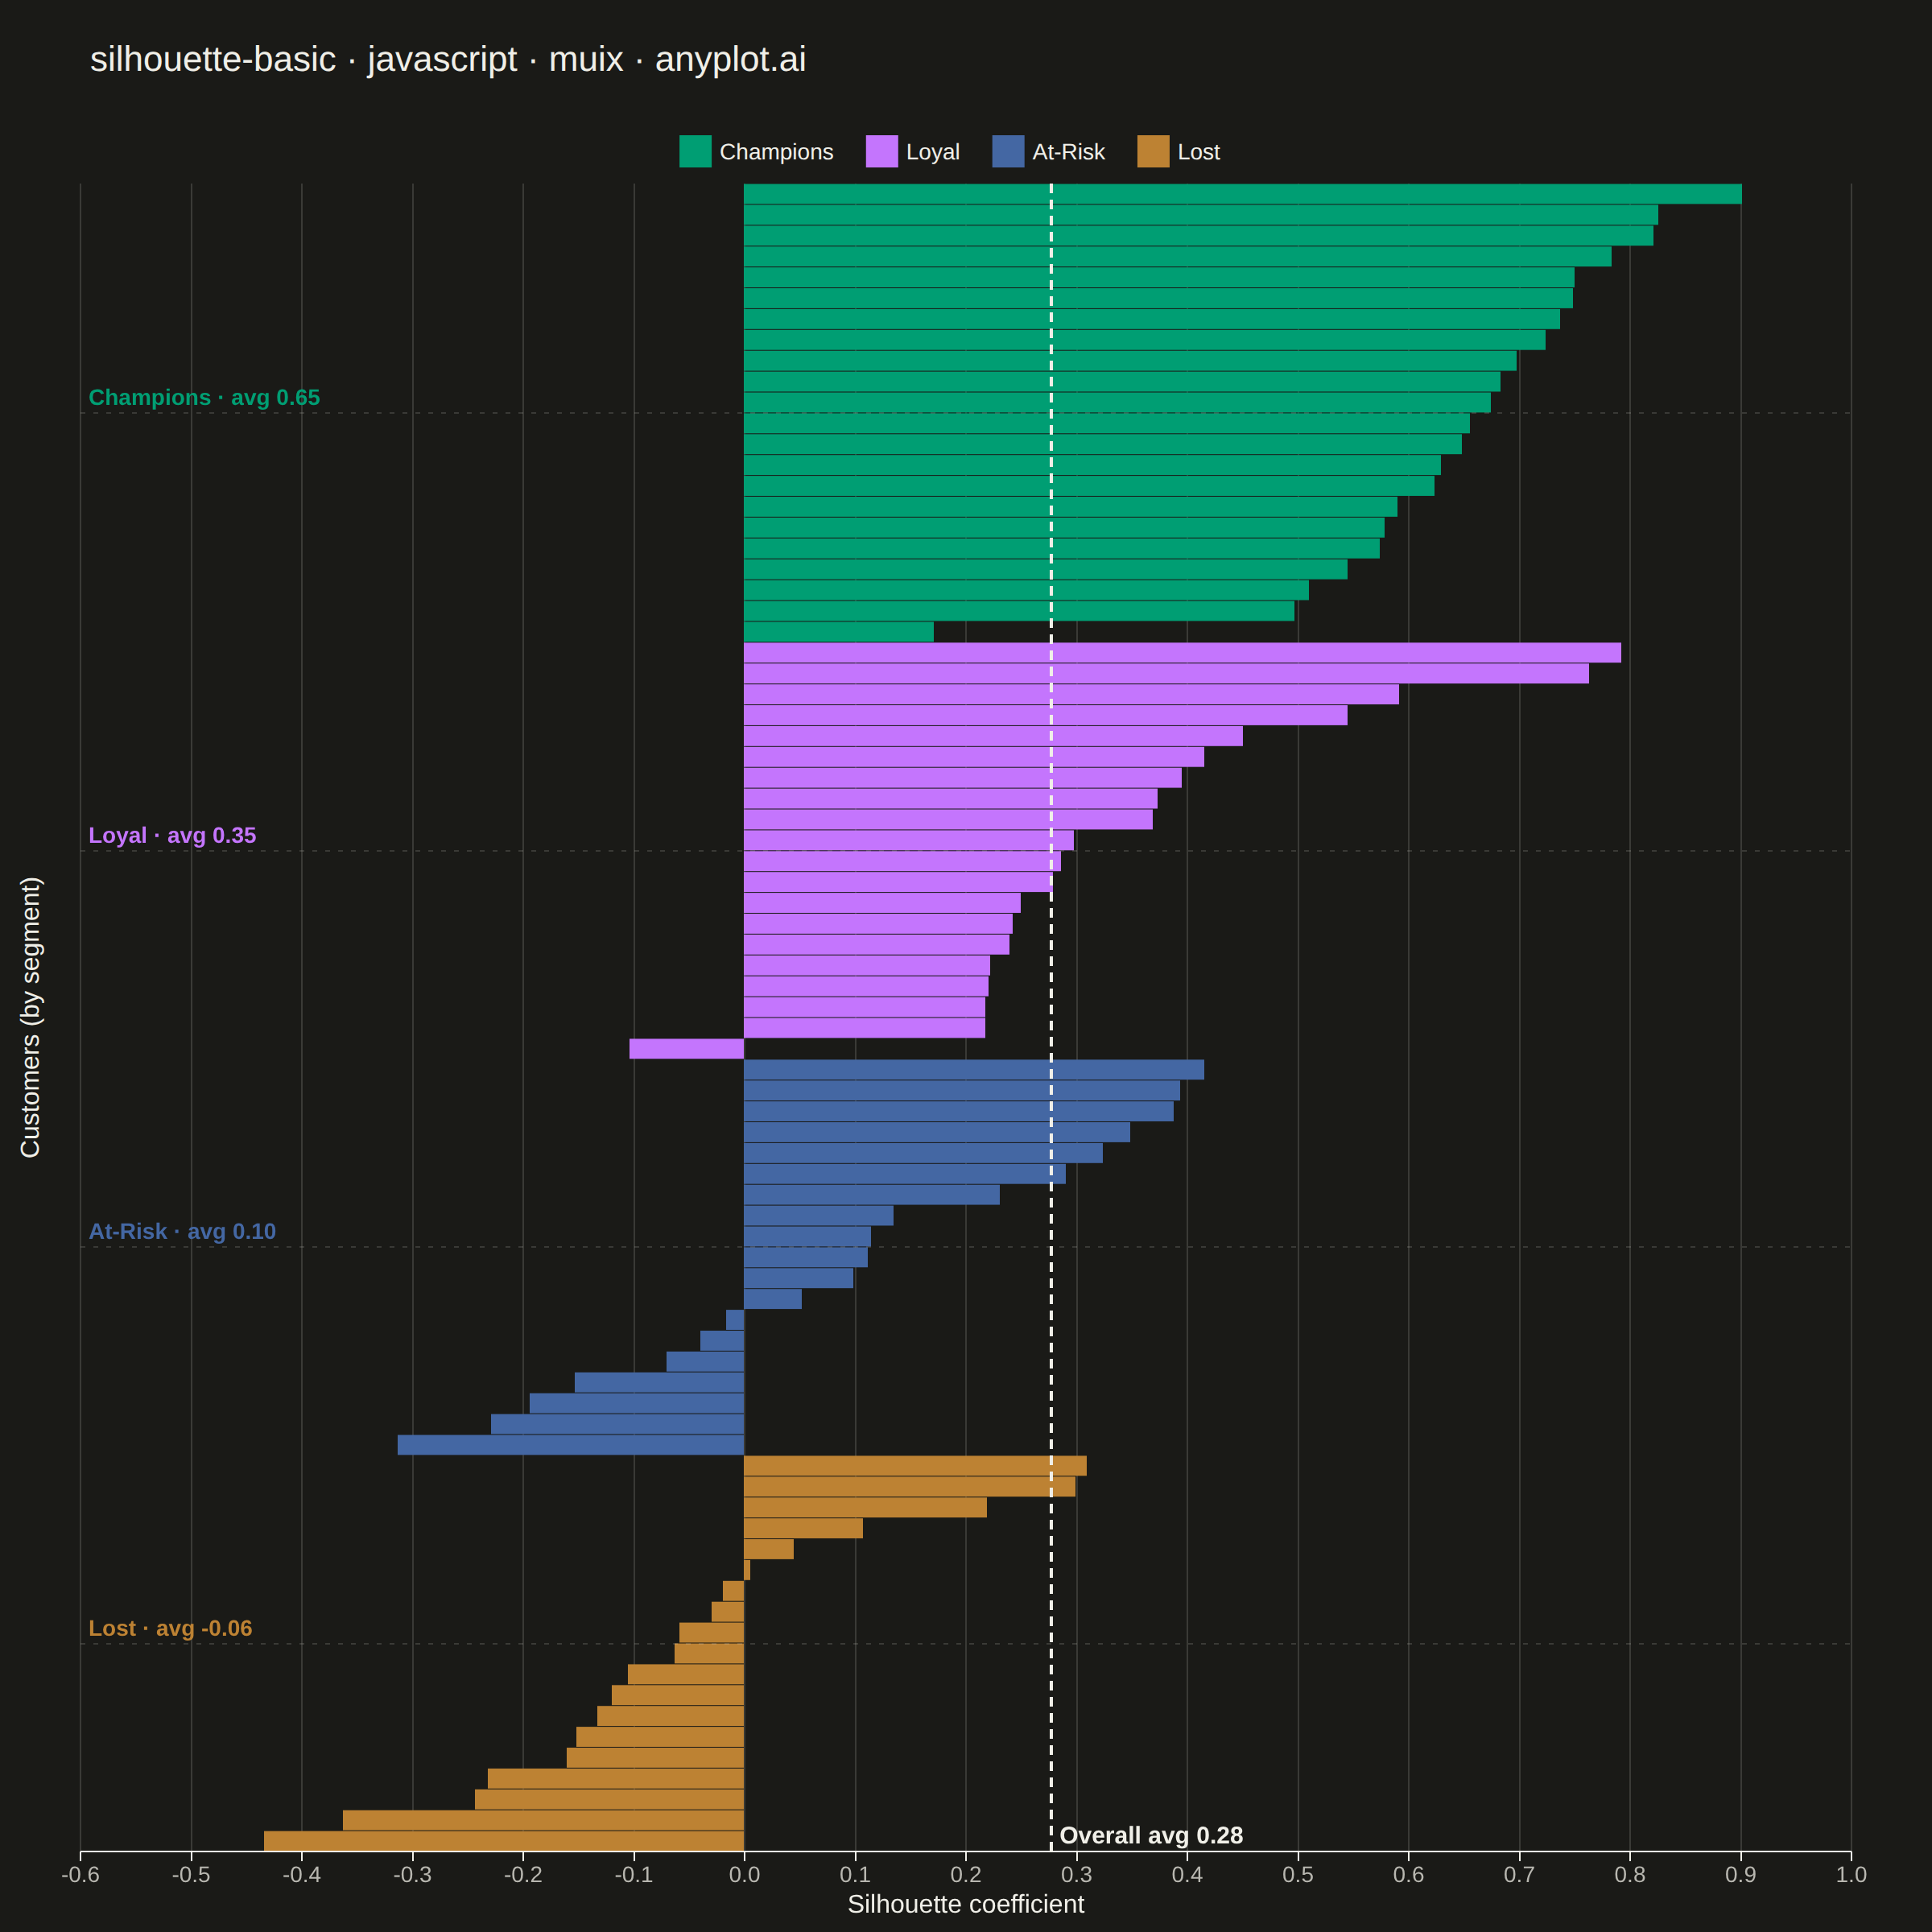
A silhouette plot visualizes the quality of clustering results by showing the silhouette coefficient for each sample, grouped by cluster assignment. Each horizontal bar represents a sample's silhouette score (-1 to 1), where positive values indicate good cluster membership and negative values suggest potential misclassification. This visualization helps evaluate cluster cohesion (how similar samples are to their own cluster) and separation (how distinct they are from neighboring clusters).
// anyplot.ai
// silhouette-basic: Silhouette Plot
// Library: muix 7.29.1 | JavaScript 22.23.2
// Quality: 89/100 | Created: 2026-09-09
//# anyplot-orientation: square
import { BarChart } from "@mui/x-charts/BarChart";
import { ChartsReferenceLine } from "@mui/x-charts/ChartsReferenceLine";
import Box from "@mui/material/Box";
import Typography from "@mui/material/Typography";

const t = window.ANYPLOT_TOKENS;

// --- Data (in-memory, deterministic) ---------------------------------------
// Tiny fixed-seed LCG — the browser has no seeded RNG.
function makeLcg(seed: number) {
  let state = seed >>> 0;
  return function next() {
    state = (Math.imul(state, 1664525) + 1013904223) >>> 0;
    return state / 4294967296;
  };
}

function randNormal(rng: () => number) {
  const u1 = Math.max(rng(), 1e-9);
  const u2 = rng();
  return Math.sqrt(-2 * Math.log(u1)) * Math.cos(2 * Math.PI * u2);
}

const rng = makeLcg(42);
const MIN_SCORE = -0.6;
const MAX_SCORE = 0.95;

// Customer-segmentation clustering (RFM features -> k-means, k=4). Silhouette
// coefficient per customer, grouped by segment and sorted best-to-worst within
// each segment — segments ordered by average score, best cohesion first.
const segments = [
  { name: "Champions", meanScore: 0.6, spread: 0.16, count: 22 },
  { name: "Loyal", meanScore: 0.35, spread: 0.22, count: 20 },
  { name: "At-Risk", meanScore: 0.12, spread: 0.22, count: 19 },
  { name: "Lost", meanScore: -0.05, spread: 0.24, count: 19 },
];

const segmentColors = [t.palette[0], t.palette[1], t.palette[2], t.palette[3]];

let allScores: number[] = [];
const segmentData = segments.map((segment) => {
  const scores: number[] = [];
  for (let i = 0; i < segment.count; i += 1) {
    const raw = segment.meanScore + randNormal(rng) * segment.spread;
    scores.push(Math.max(MIN_SCORE, Math.min(MAX_SCORE, raw)));
  }
  scores.sort((a, b) => b - a);
  allScores = allScores.concat(scores);
  const avgScore = scores.reduce((sum, v) => sum + v, 0) / scores.length;
  return { ...segment, scores, avgScore };
});

const overallAvg = allScores.reduce((sum, v) => sum + v, 0) / allScores.length;
const totalSamples = segmentData.reduce((sum, s) => sum + s.count, 0);
const categories = Array.from(
  { length: totalSamples },
  (_, i) => `customer-${i}`,
);

// One series per segment, stacked on the same axis positions — each series
// only has a non-null value at the index range that belongs to it, so every
// bar renders with exactly one (segment-colored) fill.
let cursor = 0;
const series = segmentData.map((segment, segmentIndex) => {
  const data: (number | null)[] = new Array(totalSamples).fill(null);
  for (let i = 0; i < segment.scores.length; i += 1) {
    data[cursor + i] = segment.scores[i];
  }
  cursor += segment.count;
  return {
    id: segment.name,
    label: segment.name,
    data,
    color: segmentColors[segmentIndex],
    stack: "silhouette",
  };
});

// Midpoint category of each segment's band, used to place its average-score
// annotation at the segment's vertical center.
let offset = 0;
const segmentMidpoints = segmentData.map((segment) => {
  const mid = categories[offset + Math.floor(segment.count / 2)];
  offset += segment.count;
  return mid;
});

// --- Chart (default-exported component — the harness mounts it) -------------
export default function Chart() {
  const W = window.ANYPLOT_SIZE.width;
  const H = window.ANYPLOT_SIZE.height;
  const CHART_TOP = 64;
  const theme = window.ANYPLOT_THEME;

  const title = "silhouette-basic · javascript · muix · anyplot.ai";
  const titleSize =
    title.length > 67 ? Math.round((22 * 67) / title.length) : 22;

  // Light theme puts lavender/ochre annotation text directly on the cream
  // background, below WCAG 3:1 contrast for those two hues. A thin ink-color
  // halo (paintOrder "stroke" draws the stroke behind the fill) keeps the
  // segment-colored fill intact while restoring crisp edges. Dark theme
  // already reads cleanly (light hues on near-black), so skip it there.
  const labelHalo =
    theme === "light"
      ? { stroke: t.ink, strokeWidth: 3, paintOrder: "stroke" as const }
      : {};

  return (
    <Box sx={{ position: "relative", width: W, height: H, bgcolor: t.pageBg }}>
      <Box sx={{ position: "absolute", top: 20, left: 56, right: 56 }}>
        <Typography sx={{ color: t.ink, fontSize: titleSize, fontWeight: 500 }}>
          {title}
        </Typography>
      </Box>
      <Box
        sx={{
          position: "absolute",
          top: CHART_TOP,
          left: 0,
          right: 0,
          bottom: 0,
        }}
      >
        <BarChart
          width={W}
          height={H - CHART_TOP}
          layout="horizontal"
          skipAnimation
          borderRadius={0}
          series={series}
          yAxis={[
            {
              scaleType: "band",
              data: categories,
              label: "Customers (by segment)",
              labelStyle: { fontSize: 16, fill: t.ink },
              categoryGapRatio: 0.04,
              disableTicks: true,
              disableLine: true,
              tickLabelInterval: () => false,
            },
          ]}
          xAxis={[
            {
              min: MIN_SCORE,
              max: 1,
              label: "Silhouette coefficient",
              labelStyle: { fontSize: 16, fill: t.ink },
              tickLabelStyle: { fontSize: 14, fill: t.inkSoft },
              valueFormatter: (value: number) => value.toFixed(1),
            },
          ]}
          grid={{ vertical: true }}
          slotProps={{
            legend: {
              labelStyle: { fontSize: 14, fontWeight: 500 },
              itemGap: 20,
            },
          }}
        >
          <ChartsReferenceLine
            x={overallAvg}
            label={`Overall avg ${overallAvg.toFixed(2)}`}
            labelAlign="end"
            labelStyle={{ fontSize: 15, fill: t.ink, fontWeight: 600 }}
            lineStyle={{
              stroke: t.ink,
              strokeDasharray: "6 4",
              strokeWidth: 2,
            }}
          />
          {segmentData.map((segment, i) => (
            <ChartsReferenceLine
              key={segment.name}
              y={segmentMidpoints[i]}
              label={`${segment.name} · avg ${segment.avgScore.toFixed(2)}`}
              labelAlign="start"
              labelStyle={{
                fontSize: 14,
                fill: segmentColors[i],
                fontWeight: 600,
                ...labelHalo,
              }}
              lineStyle={{
                stroke: t.grid,
                strokeDasharray: "3 5",
                strokeWidth: 1,
              }}
            />
          ))}
        </BarChart>
      </Box>
    </Box>
  );
}
Runnable source as JSON, for any HTTP client: https://api.anyplot.ai/specs/silhouette-basic/muix/code. Any spec id and library id listed in llms-full.txt fit the same URL shape; every URL below is complete and callable.
{
  "spec_id": "silhouette-basic",
  "language": "javascript",
  "library": "muix",
  "page": "https://anyplot.ai/silhouette-basic/javascript/muix",
  "hub": "https://anyplot.ai/silhouette-basic",
  "code_json": "https://api.anyplot.ai/specs/silhouette-basic/muix/code",
  "spec_json": "https://api.anyplot.ai/specs/silhouette-basic",
  "render_light_png": "https://storage.googleapis.com/anyplot-images/plots/silhouette-basic/javascript/muix/plot-light.png",
  "render_dark_png": "https://storage.googleapis.com/anyplot-images/plots/silhouette-basic/javascript/muix/plot-dark.png",
  "interactive_light_html": "https://storage.googleapis.com/anyplot-images/plots/silhouette-basic/javascript/muix/plot-light.html",
  "interactive_dark_html": "https://storage.googleapis.com/anyplot-images/plots/silhouette-basic/javascript/muix/plot-dark.html",
  "quality_score": 89.0,
  "license": "MIT",
  "guide": "https://anyplot.ai/llms.txt"
}
Part of Silhouette Plot on anyplot.ai.