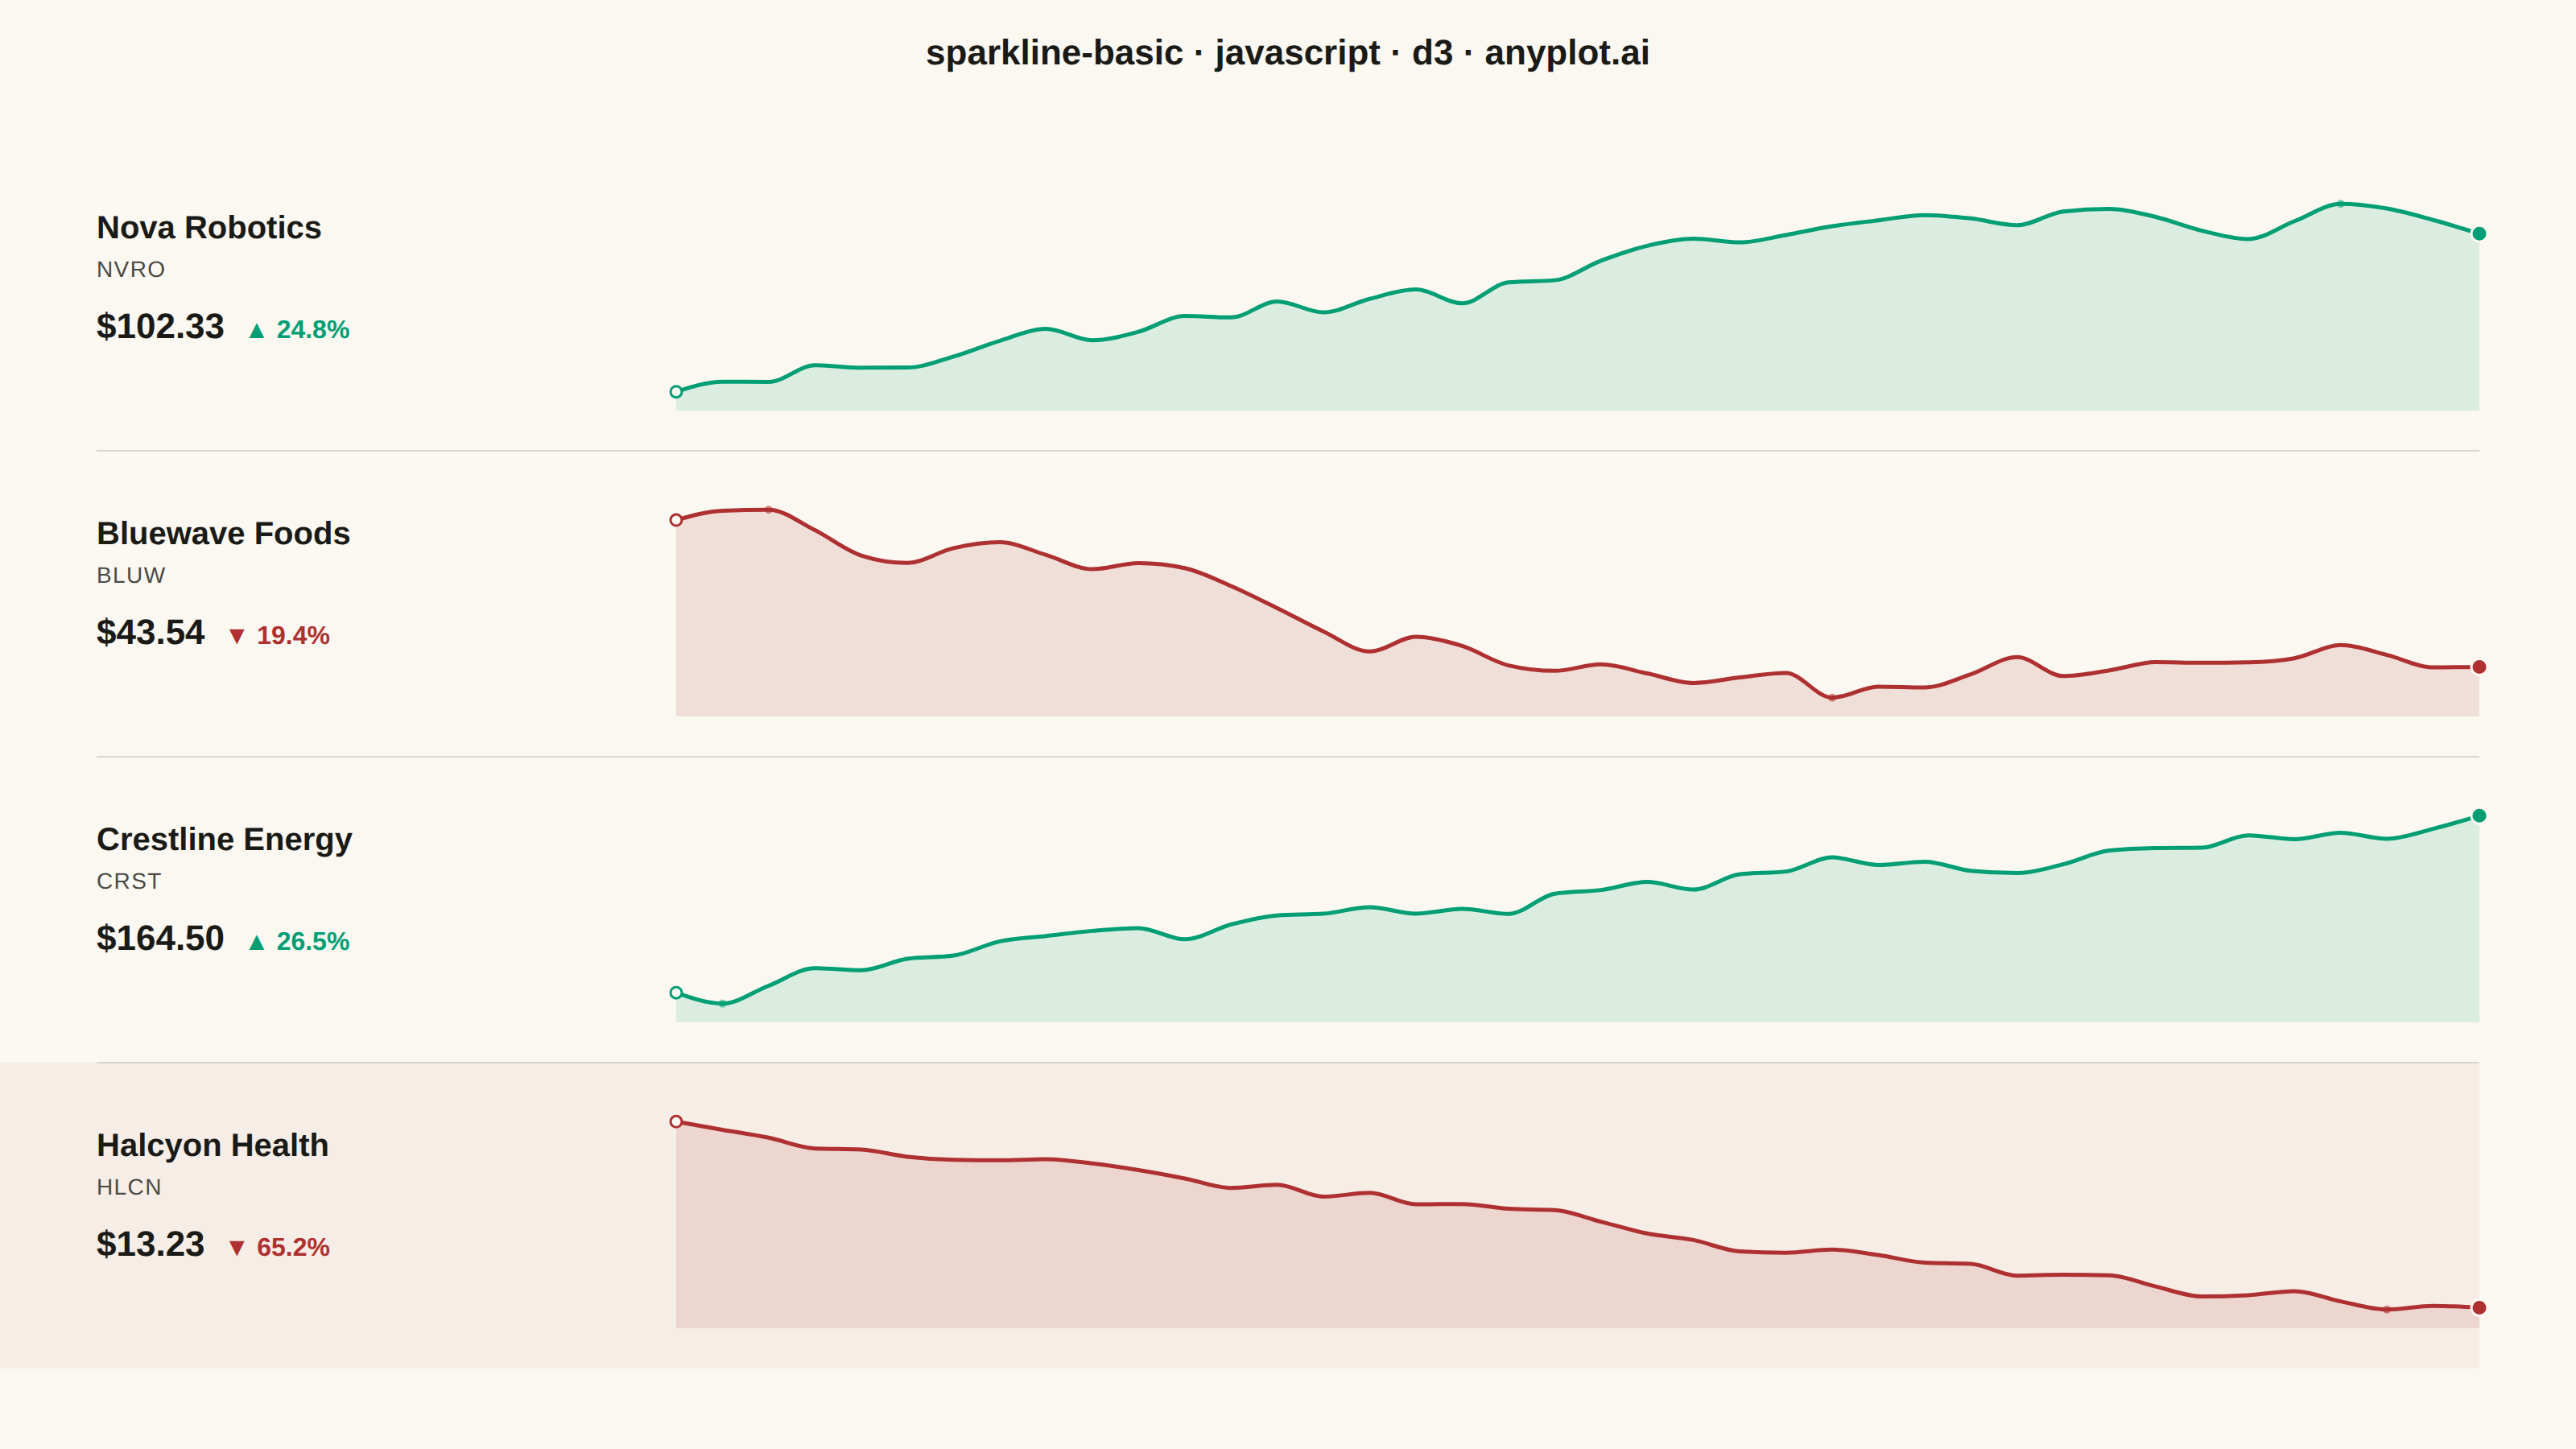
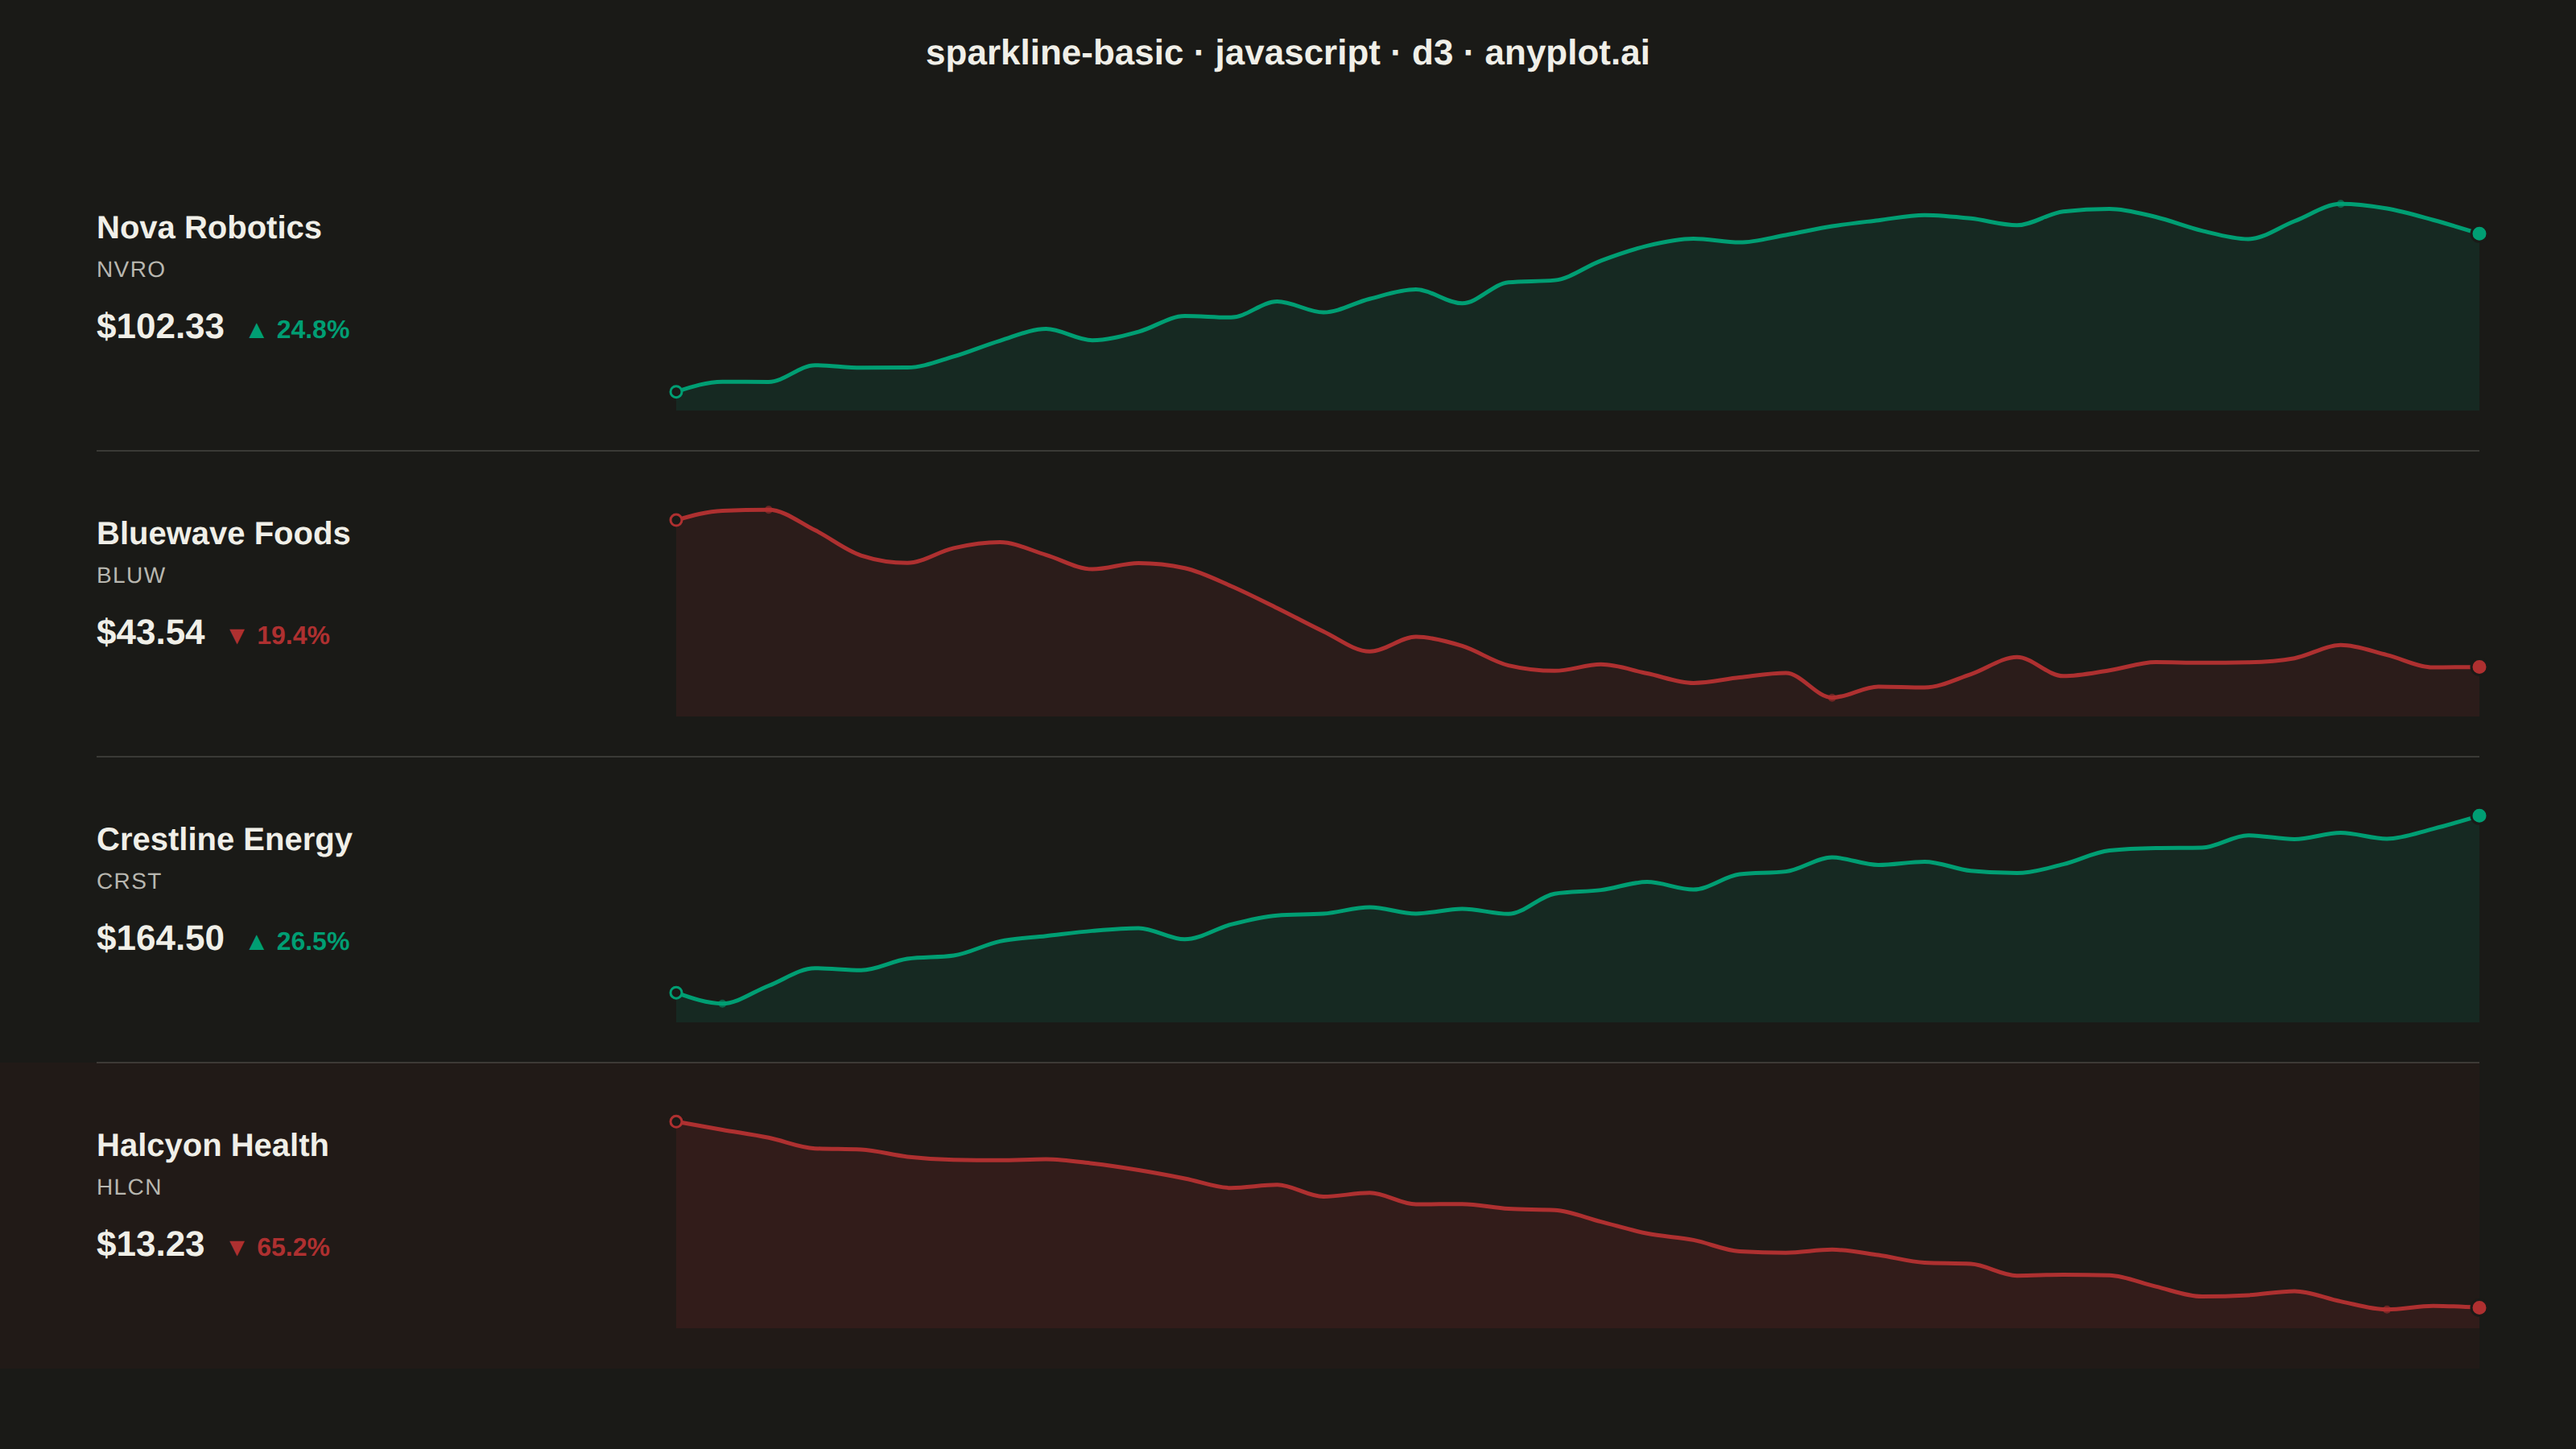
The same plot in 14 other libraries — JavaScript: Chart.js, Apache ECharts, Highcharts, MUI X Charts; Python: Altair, Bokeh, lets-plot, Matplotlib, Plotly, plotnine, Pygal, Seaborn; R: ggplot2; Julia: Makie.jl. Compare all 15 side by side: Basic Sparkline in Python, R, Julia and JavaScript.
A sparkline is a small, condensed line chart designed to be embedded inline with text or in dashboard cells. It shows trends at a glance without axes, axis labels, or detailed scales - pure data visualization in minimal space. The defining characteristic is extreme minimalism: a single continuous line that conveys the shape of data without any chart chrome.
// anyplot.ai
// sparkline-basic: Basic Sparkline
// Library: d3 7.9.0 | JavaScript 22.23.2
// Quality: 93/100 | Created: 2026-09-09

const t = window.ANYPLOT_TOKENS;
const { width, height } = window.ANYPLOT_SIZE;

// --- Data (in-memory, deterministic) ----------------------------------------
// A tiny fixed-seed LCG — the browser has no seeded RNG.
const lcg = (seed) => {
  let s = seed;
  return () => {
    s = (s * 1103515245 + 12345) & 0x7fffffff;
    return s / 0x7fffffff;
  };
};

const buildSeries = (start, drift, volatility, seed, n = 40) => {
  const rng = lcg(seed);
  const values = [start];
  for (let i = 1; i < n; i += 1) {
    const step = drift + (rng() - 0.5) * volatility * 2;
    values.push(Math.max(1, values[i - 1] + step));
  }
  return values;
};

const stocks = [
  {
    name: "Nova Robotics",
    ticker: "NVRO",
    values: buildSeries(82, 0.55, 2.4, 11),
  },
  {
    name: "Bluewave Foods",
    ticker: "BLUW",
    values: buildSeries(54, -0.35, 1.6, 23),
  },
  {
    name: "Crestline Energy",
    ticker: "CRST",
    values: buildSeries(130, 0.9, 3.1, 37),
  },
  {
    name: "Halcyon Health",
    ticker: "HLCN",
    values: buildSeries(38, -0.5, 1.1, 53),
  },
];

// --- SVG mount ----------------------------------------------------------------
const svg = d3
  .select("#container")
  .append("svg")
  .attr("width", width)
  .attr("height", height);

// --- Title ----------------------------------------------------------------
svg
  .append("text")
  .attr("x", width / 2)
  .attr("y", 40)
  .attr("text-anchor", "middle")
  .attr("fill", t.ink)
  .style("font-size", "22px")
  .style("font-weight", "600")
  .text("sparkline-basic · javascript · d3 · anyplot.ai");

// --- Layout: one table-style row per stock, sparkline embedded inline -------
const marginTop = 90;
const rowHeight = 190;
const labelX = 60;
const sparkX0 = 420;
const sparkX1 = width - 60;
const sparkHeight = 140;

// Pre-compute per-stock change so the standout mover can be highlighted.
const changes = stocks.map((stock) => {
  const values = stock.values;
  const first = values[0];
  const last = values[values.length - 1];
  return ((last - first) / first) * 100;
});
const standoutIndex = changes.reduce(
  (best, c, i) => (Math.abs(c) > Math.abs(changes[best]) ? i : best),
  0,
);

// Idiomatic D3 data-join: one <g class="row"> per stock, data-bound.
const rows = svg.selectAll("g.row").data(stocks).join("g").attr("class", "row");

rows.each(function (stock, i) {
  const row = d3.select(this);
  const y0 = marginTop + i * rowHeight;
  const values = stock.values;
  const n = values.length;
  const first = values[0];
  const last = values[n - 1];
  const change = changes[i];
  const up = change >= 0;
  const color = up ? t.palette[0] : t.palette[4];
  const arrow = up ? "▲" : "▼";
  const isStandout = i === standoutIndex;

  // Subtle full-row tint calling out the largest absolute mover.
  if (isStandout) {
    row
      .append("rect")
      .attr("x", 0)
      .attr("y", y0)
      .attr("width", sparkX1)
      .attr("height", rowHeight)
      .attr("fill", color)
      .attr("opacity", 0.05);
  }

  // Divider between rows (table feel — not an axis of the sparkline itself)
  if (i > 0) {
    row
      .append("line")
      .attr("x1", labelX)
      .attr("x2", sparkX1)
      .attr("y1", y0)
      .attr("y2", y0)
      .attr("stroke", t.grid)
      .attr("stroke-width", 1);
  }

  // Label block — the standout mover gets a bolder company name.
  row
    .append("text")
    .attr("x", labelX)
    .attr("y", y0 + 58)
    .attr("fill", t.ink)
    .style("font-size", "20px")
    .style("font-weight", isStandout ? "700" : "600")
    .text(stock.name);

  row
    .append("text")
    .attr("x", labelX)
    .attr("y", y0 + 82)
    .attr("fill", t.inkSoft)
    .style("font-size", "14px")
    .style("letter-spacing", "0.05em")
    .text(stock.ticker);

  const priceLabel = row
    .append("text")
    .attr("x", labelX)
    .attr("y", y0 + 120)
    .attr("fill", t.ink)
    .style("font-size", "22px")
    .style("font-weight", "700");
  priceLabel.append("tspan").text(`$${last.toFixed(2)}`);
  priceLabel
    .append("tspan")
    .attr("dx", "12")
    .attr("fill", color)
    .style("font-size", "16px")
    .style("font-weight", "600")
    .text(`${arrow} ${Math.abs(change).toFixed(1)}%`);

  // Sparkline — pure line, no axes/ticks/gridlines
  const sparkY0 = y0 + (rowHeight - sparkHeight) / 2;
  const sparkY1 = sparkY0 + sparkHeight;
  const x = d3
    .scaleLinear()
    .domain([0, n - 1])
    .range([sparkX0, sparkX1]);
  const [vMin, vMax] = d3.extent(values);
  const pad = (vMax - vMin) * 0.1 || 1;
  const y = d3
    .scaleLinear()
    .domain([vMin - pad, vMax + pad])
    .range([sparkY1, sparkY0]);

  const area = d3
    .area()
    .x((d, i2) => x(i2))
    .y0(sparkY1)
    .y1((d) => y(d))
    .curve(d3.curveMonotoneX);
  const line = d3
    .line()
    .x((d, i2) => x(i2))
    .y((d) => y(d))
    .curve(d3.curveMonotoneX);

  row
    .append("path")
    .datum(values)
    .attr("d", area)
    .attr("fill", color)
    .attr("opacity", 0.12);
  row
    .append("path")
    .datum(values)
    .attr("d", line)
    .attr("fill", "none")
    .attr("stroke", color)
    .attr("stroke-width", 2.5)
    .attr("stroke-linejoin", "round")
    .attr("stroke-linecap", "round");

  // First point — subtle hollow reference marker
  row
    .append("circle")
    .attr("cx", x(0))
    .attr("cy", y(first))
    .attr("r", 3.5)
    .attr("fill", t.pageBg)
    .attr("stroke", color)
    .attr("stroke-width", 1.5);

  // Last point — filled marker, the current value
  row
    .append("circle")
    .attr("cx", x(n - 1))
    .attr("cy", y(last))
    .attr("r", 5)
    .attr("fill", color)
    .attr("stroke", t.pageBg)
    .attr("stroke-width", 1.5);

  // Min/max markers — small faded dots, skipped where they'd sit on top of
  // the first/last markers already drawn above.
  const maxIdx = values.indexOf(vMax);
  const minIdx = values.indexOf(vMin);
  for (const idx of new Set([minIdx, maxIdx])) {
    if (idx === 0 || idx === n - 1) continue;
    row
      .append("circle")
      .attr("cx", x(idx))
      .attr("cy", y(values[idx]))
      .attr("r", 2.5)
      .attr("fill", color)
      .attr("opacity", 0.55);
  }
});
Runnable source as JSON, for any HTTP client: https://api.anyplot.ai/specs/sparkline-basic/d3/code. Any spec id and library id listed in llms-full.txt fit the same URL shape; every URL below is complete and callable.
{
  "spec_id": "sparkline-basic",
  "language": "javascript",
  "library": "d3",
  "page": "https://anyplot.ai/sparkline-basic/javascript/d3",
  "hub": "https://anyplot.ai/sparkline-basic",
  "code_json": "https://api.anyplot.ai/specs/sparkline-basic/d3/code",
  "spec_json": "https://api.anyplot.ai/specs/sparkline-basic",
  "render_light_png": "https://storage.googleapis.com/anyplot-images/plots/sparkline-basic/javascript/d3/plot-light.png",
  "render_dark_png": "https://storage.googleapis.com/anyplot-images/plots/sparkline-basic/javascript/d3/plot-dark.png",
  "interactive_light_html": "https://storage.googleapis.com/anyplot-images/plots/sparkline-basic/javascript/d3/plot-light.html",
  "interactive_dark_html": "https://storage.googleapis.com/anyplot-images/plots/sparkline-basic/javascript/d3/plot-dark.html",
  "quality_score": 93.0,
  "license": "MIT",
  "guide": "https://anyplot.ai/llms.txt"
}
Part of Basic Sparkline on anyplot.ai.