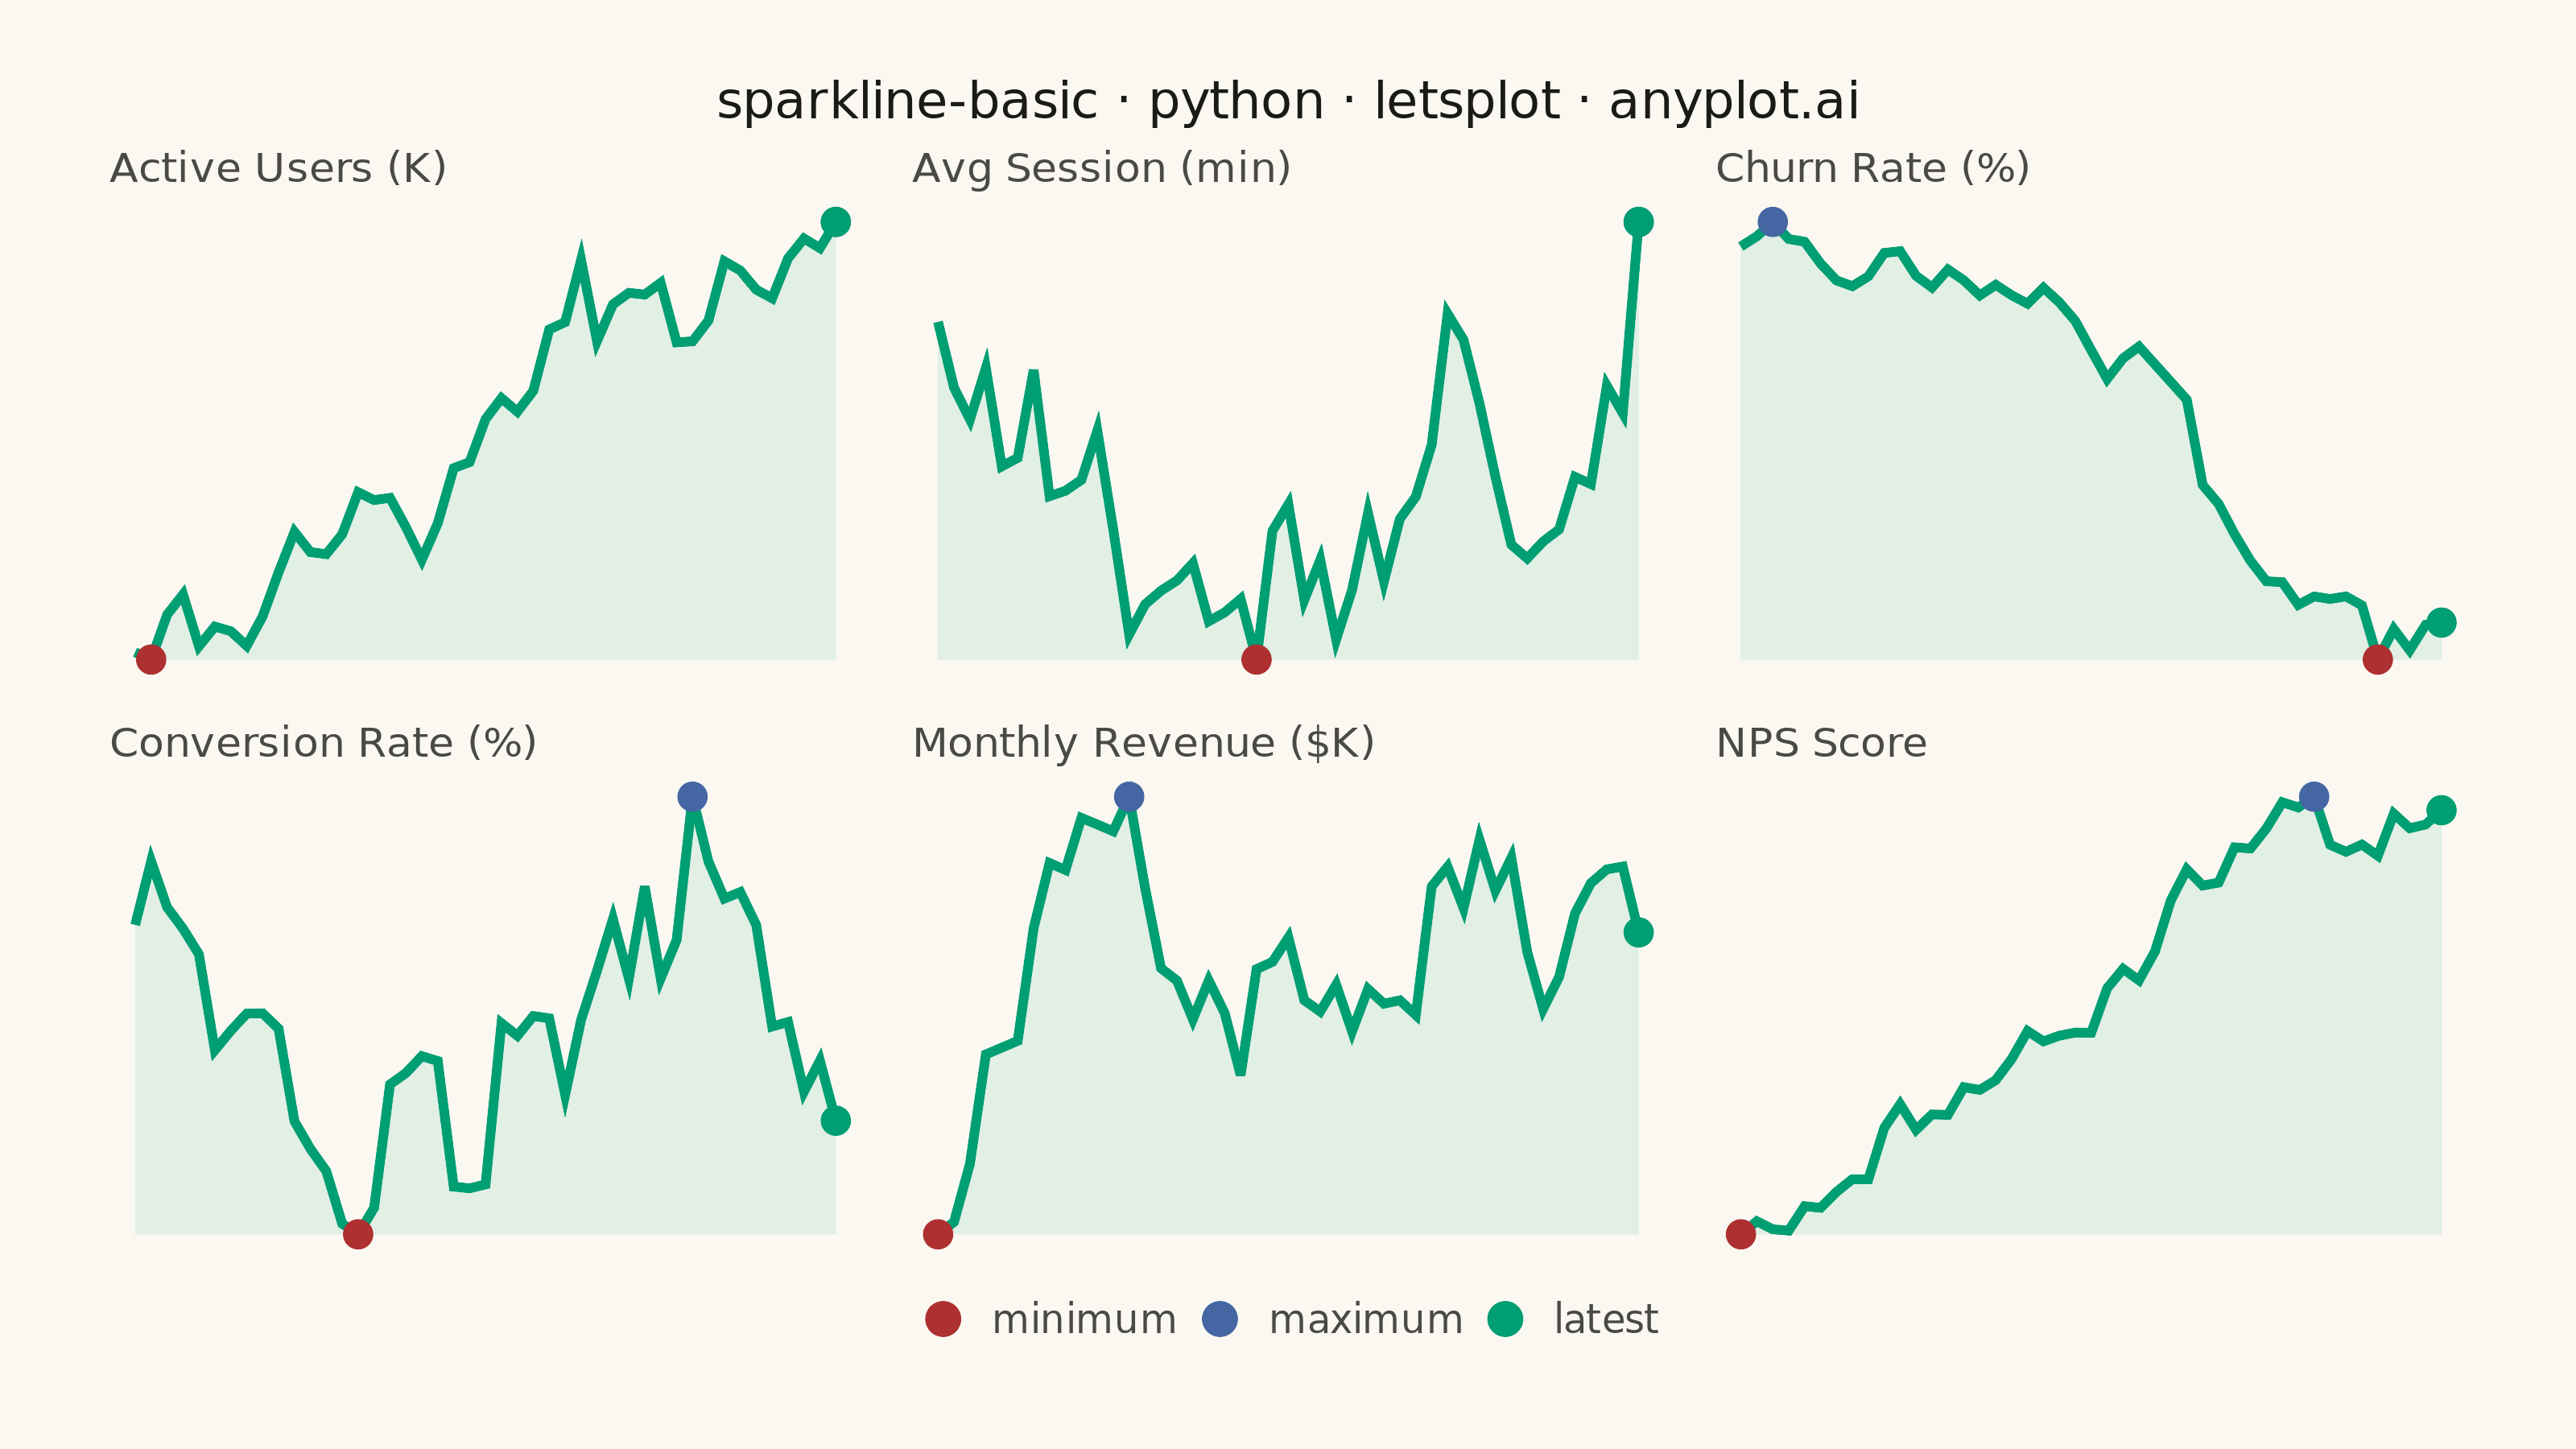
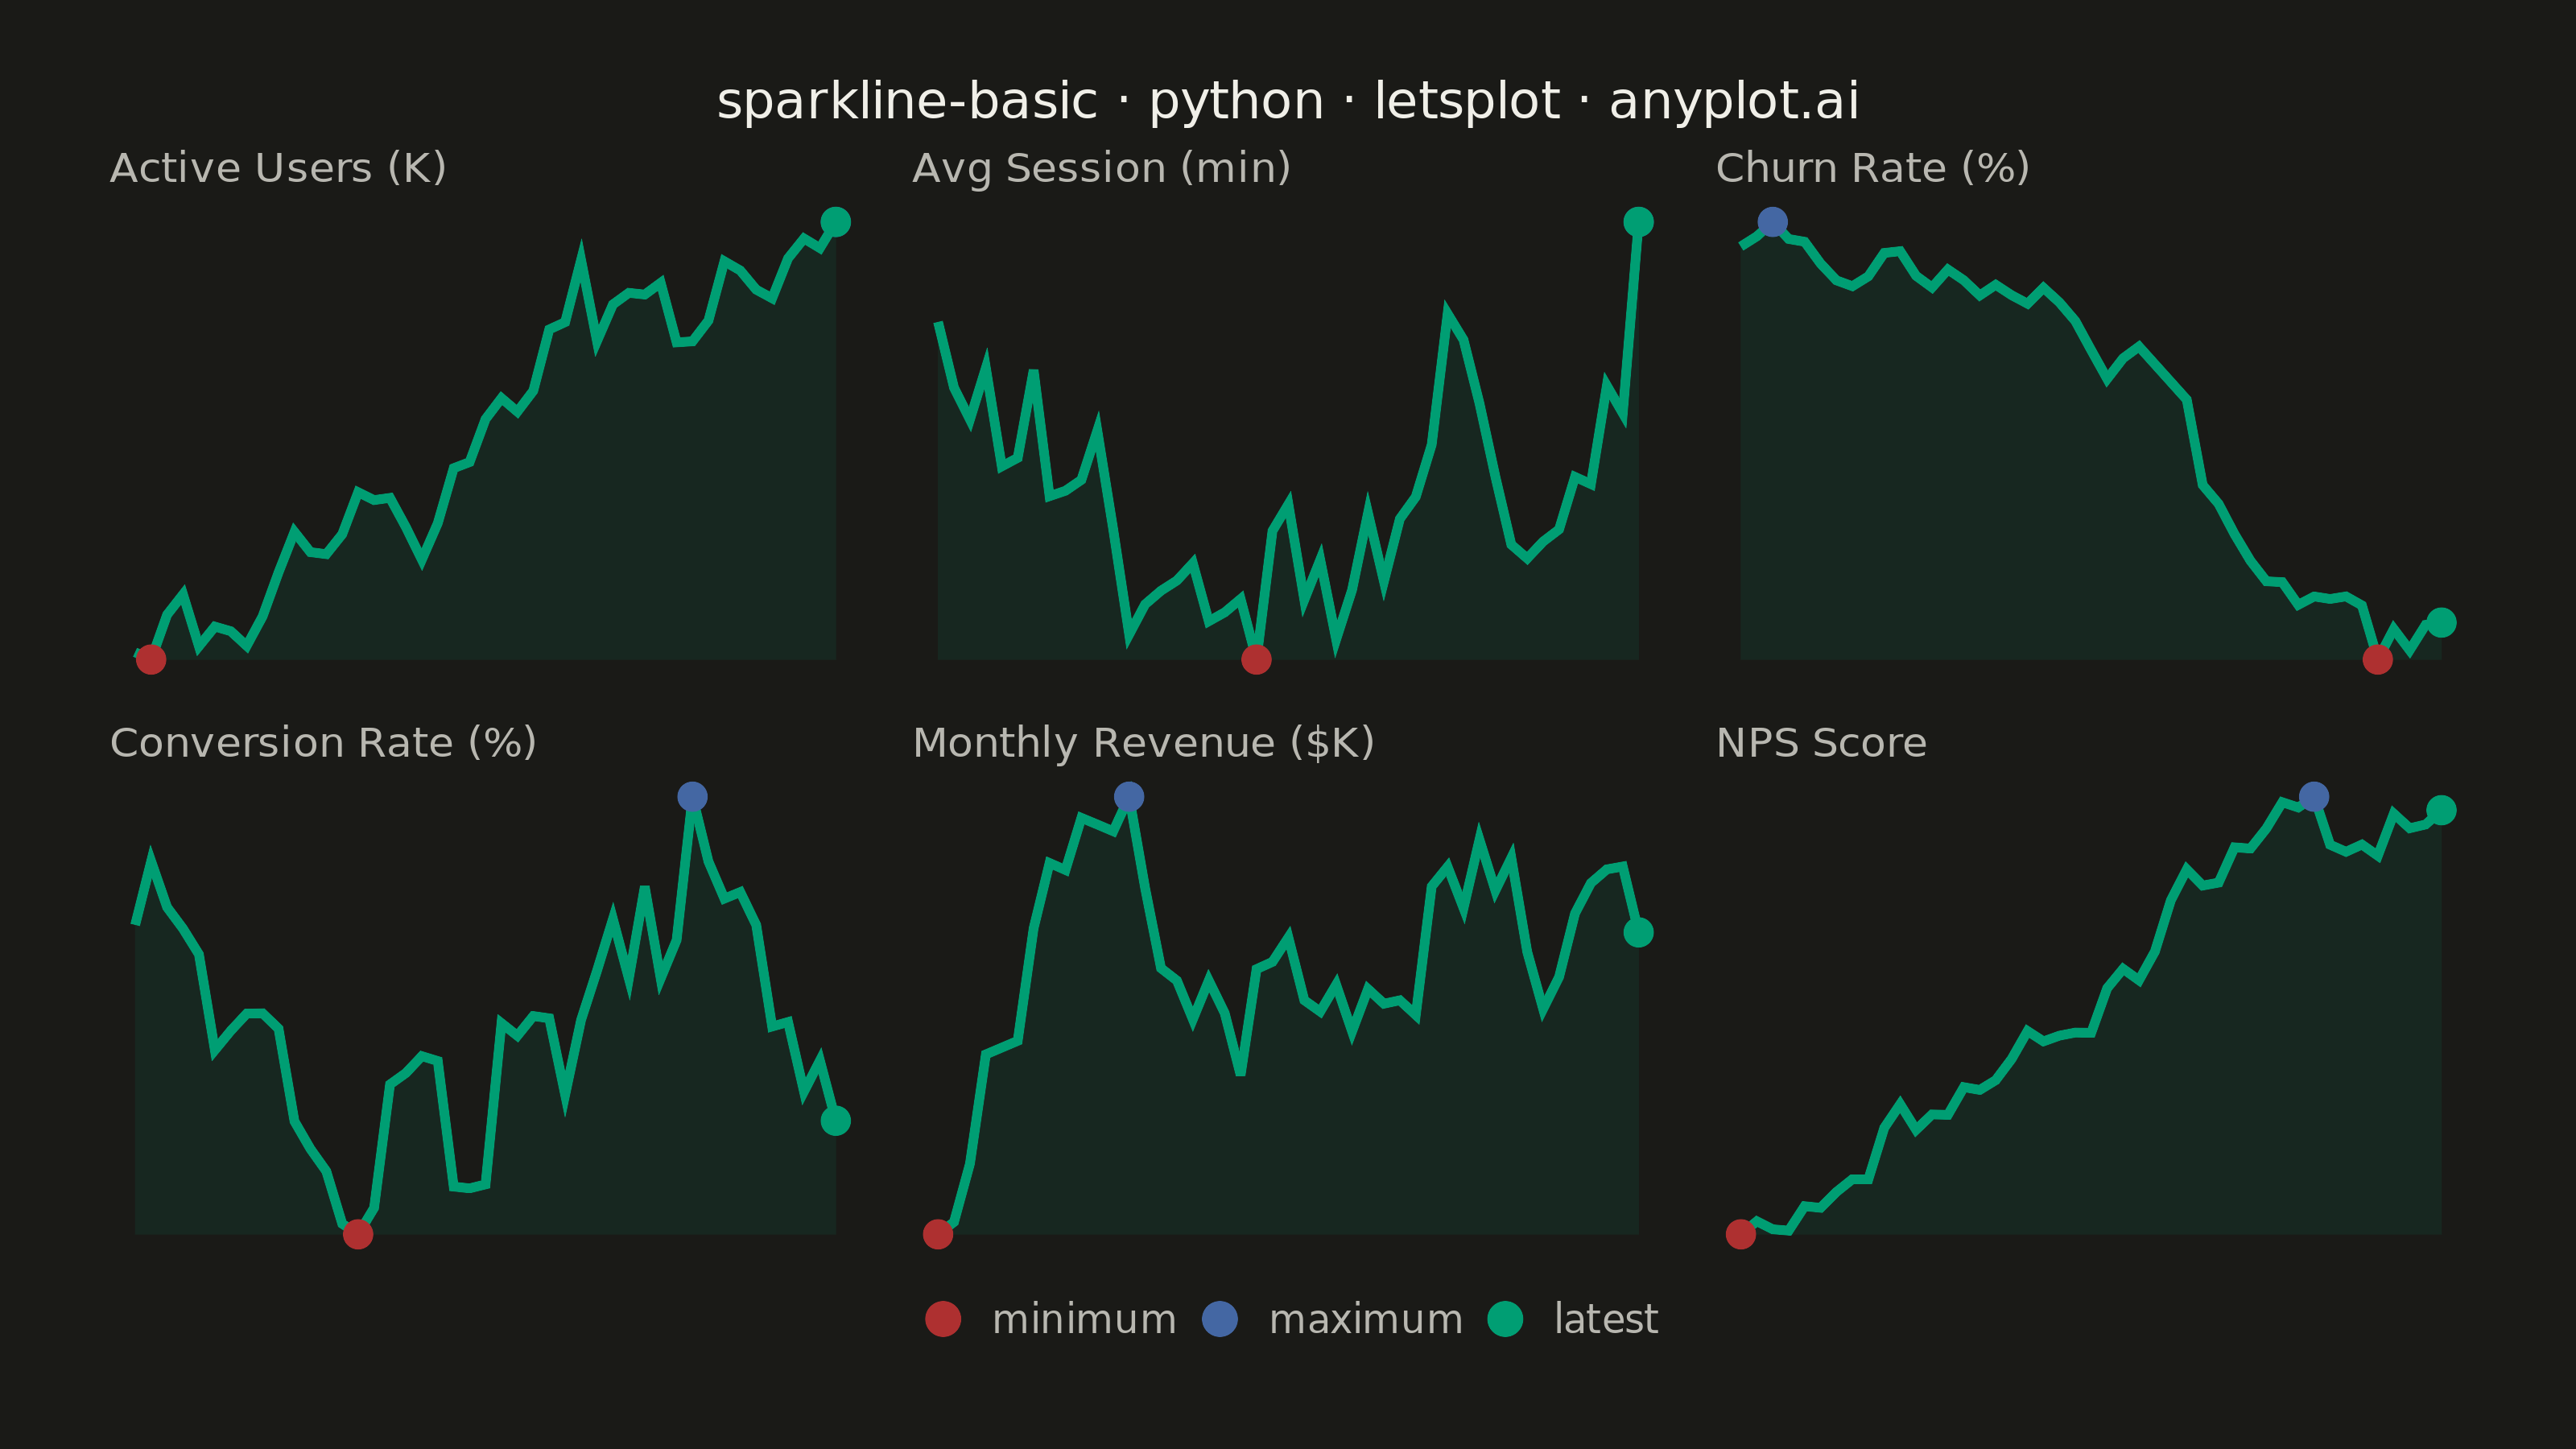
A sparkline is a small, condensed line chart designed to be embedded inline with text or in dashboard cells. It shows trends at a glance without axes, labels, or detailed scales - pure data visualization in minimal space. The defining characteristic is extreme minimalism: a single continuous line that conveys the shape of data without any chart chrome.
""" anyplot.ai
sparkline-basic: Basic Sparkline
Library: letsplot 4.10.1 | Python 3.13.13
Quality: 93/100 | Updated: 2026-06-16
"""

import os

import numpy as np
import pandas as pd
from lets_plot import (
    LetsPlot,
    aes,
    element_blank,
    element_rect,
    element_text,
    facet_wrap,
    geom_line,
    geom_point,
    geom_ribbon,
    ggplot,
    ggsave,
    ggsize,
    labs,
    scale_color_manual,
    theme,
    theme_void,
)


LetsPlot.setup_html()

# Theme-adaptive chrome (see prompts/default-style-guide.md "Theme-adaptive Chrome")
THEME = os.getenv("ANYPLOT_THEME", "light")
PAGE_BG = "#FAF8F1" if THEME == "light" else "#1A1A17"
INK = "#1A1A17" if THEME == "light" else "#F0EFE8"
INK_SOFT = "#4A4A44" if THEME == "light" else "#B8B7B0"

# Imprint palette — brand green is the sparkline line; red/blue mark the extremes
BRAND = "#009E73"  # Imprint position 1 — the trend line (always first series)
LOW = "#AE3030"  # Imprint matte red — minimum (semantic low)
HIGH = "#4467A3"  # Imprint blue — maximum

# Data — a small-multiples KPI dashboard: six product metrics over 45 days.
# Each metric gets its own trend shape so the sparklines tell distinct stories.
np.random.seed(42)
n_days = 45
days = np.arange(n_days)

series = {
    "Monthly Revenue ($K)": 120 + np.cumsum(np.random.randn(n_days) * 2.0 + 0.7),
    "Active Users (K)": 48 + np.cumsum(np.random.randn(n_days) * 1.4 + 0.35),
    "Conversion Rate (%)": 3.1 + np.cumsum(np.random.randn(n_days) * 0.12),
    "Avg Session (min)": 9.0 + np.cumsum(np.random.randn(n_days) * 0.18 - 0.02),
    "Churn Rate (%)": 5.4 - np.cumsum(np.random.randn(n_days) * 0.05 + 0.018),
    "NPS Score": 31 + np.cumsum(np.random.randn(n_days) * 0.7 + 0.45),
}
order = list(series.keys())

# Long-format frame plus per-metric extreme/endpoint frames for the highlight dots
frames, mins, maxs, lasts = [], [], [], []
for name, vals in series.items():
    i_min, i_max = int(np.argmin(vals)), int(np.argmax(vals))
    frames.append(pd.DataFrame({"metric": name, "day": days, "value": vals, "floor": vals.min()}))
    mins.append({"metric": name, "day": i_min, "value": vals[i_min]})
    maxs.append({"metric": name, "day": i_max, "value": vals[i_max]})
    lasts.append({"metric": name, "day": n_days - 1, "value": vals[-1]})

df = pd.concat(frames, ignore_index=True)
df["metric"] = pd.Categorical(df["metric"], categories=order, ordered=True)

# One tidy frame of highlight dots, with a "kind" column that drives the legend key.
kinds = ["minimum", "maximum", "latest"]
dots = pd.concat(
    [
        pd.DataFrame(mins).assign(kind="minimum"),
        pd.DataFrame(maxs).assign(kind="maximum"),
        pd.DataFrame(lasts).assign(kind="latest"),
    ],
    ignore_index=True,
)
dots["metric"] = pd.Categorical(dots["metric"], categories=order, ordered=True)
dots["kind"] = pd.Categorical(dots["kind"], categories=kinds, ordered=True)

# Plot — pure sparklines: no axes, ticks, or gridlines; each panel free on y.
# Subtle area anchored to each panel's floor, thin line, and red/blue/green dots.
plot = (
    ggplot(df, aes("day", "value"))
    + geom_ribbon(aes(ymin="floor", ymax="value"), fill=BRAND, alpha=0.10, size=0)
    + geom_line(color=BRAND, size=1.3)
    # A single mapped point layer so min/max/latest get a real legend key.
    + geom_point(data=dots, mapping=aes(color="kind"), size=4.2)
    + scale_color_manual(name="", values={"minimum": LOW, "maximum": HIGH, "latest": BRAND})
    + facet_wrap("metric", ncol=3, scales="free_y")
    + labs(title="sparkline-basic · python · letsplot · anyplot.ai")
    + ggsize(800, 450)  # scale=4 on export -> 3200 x 1800 px (landscape)
    + theme_void()
    + theme(
        plot_background=element_rect(fill=PAGE_BG, color=PAGE_BG),
        panel_background=element_rect(fill=PAGE_BG, color=PAGE_BG),
        plot_title=element_text(size=16, color=INK, hjust=0.5),
        strip_text=element_text(size=13, color=INK_SOFT, hjust=0),
        strip_background=element_blank(),  # drop the bordered strip frame (cleaner sparkline chrome)
        legend_position="bottom",  # compact key: red=min, blue=max, green=latest
        legend_text=element_text(size=12, color=INK_SOFT),
        legend_background=element_rect(fill=PAGE_BG, color=PAGE_BG),
        legend_key=element_rect(fill=PAGE_BG, color=PAGE_BG),
        plot_margin=[24, 28, 24, 28],
    )
)

# Save PNG (scale 4x -> 3200 x 1800) and interactive HTML
ggsave(plot, f"plot-{THEME}.png", path=".", scale=4)
ggsave(plot, f"plot-{THEME}.html", path=".")
Runnable source as JSON, for any HTTP client: https://api.anyplot.ai/specs/sparkline-basic/letsplot/code. Any spec id and library id listed in llms-full.txt fit the same URL shape; every URL below is complete and callable.
{
  "spec_id": "sparkline-basic",
  "language": "python",
  "library": "letsplot",
  "page": "https://anyplot.ai/sparkline-basic/python/letsplot",
  "hub": "https://anyplot.ai/sparkline-basic",
  "code_json": "https://api.anyplot.ai/specs/sparkline-basic/letsplot/code",
  "spec_json": "https://api.anyplot.ai/specs/sparkline-basic",
  "render_light_png": "https://storage.googleapis.com/anyplot-images/plots/sparkline-basic/python/letsplot/plot-light.png",
  "render_dark_png": "https://storage.googleapis.com/anyplot-images/plots/sparkline-basic/python/letsplot/plot-dark.png",
  "interactive_light_html": "https://storage.googleapis.com/anyplot-images/plots/sparkline-basic/python/letsplot/plot-light.html",
  "interactive_dark_html": "https://storage.googleapis.com/anyplot-images/plots/sparkline-basic/python/letsplot/plot-dark.html",
  "quality_score": 93.0,
  "license": "MIT",
  "guide": "https://anyplot.ai/llms.txt"
}
Part of Basic Sparkline on anyplot.ai.