The same plot in 14 other libraries — JavaScript: Chart.js, D3.js, Apache ECharts, Highcharts; Python: Altair, Bokeh, lets-plot, Matplotlib, Plotly, plotnine, Pygal, Seaborn; R: ggplot2; Julia: Makie.jl. Compare all 15 side by side: Basic Sparkline in Python, R, Julia and JavaScript.
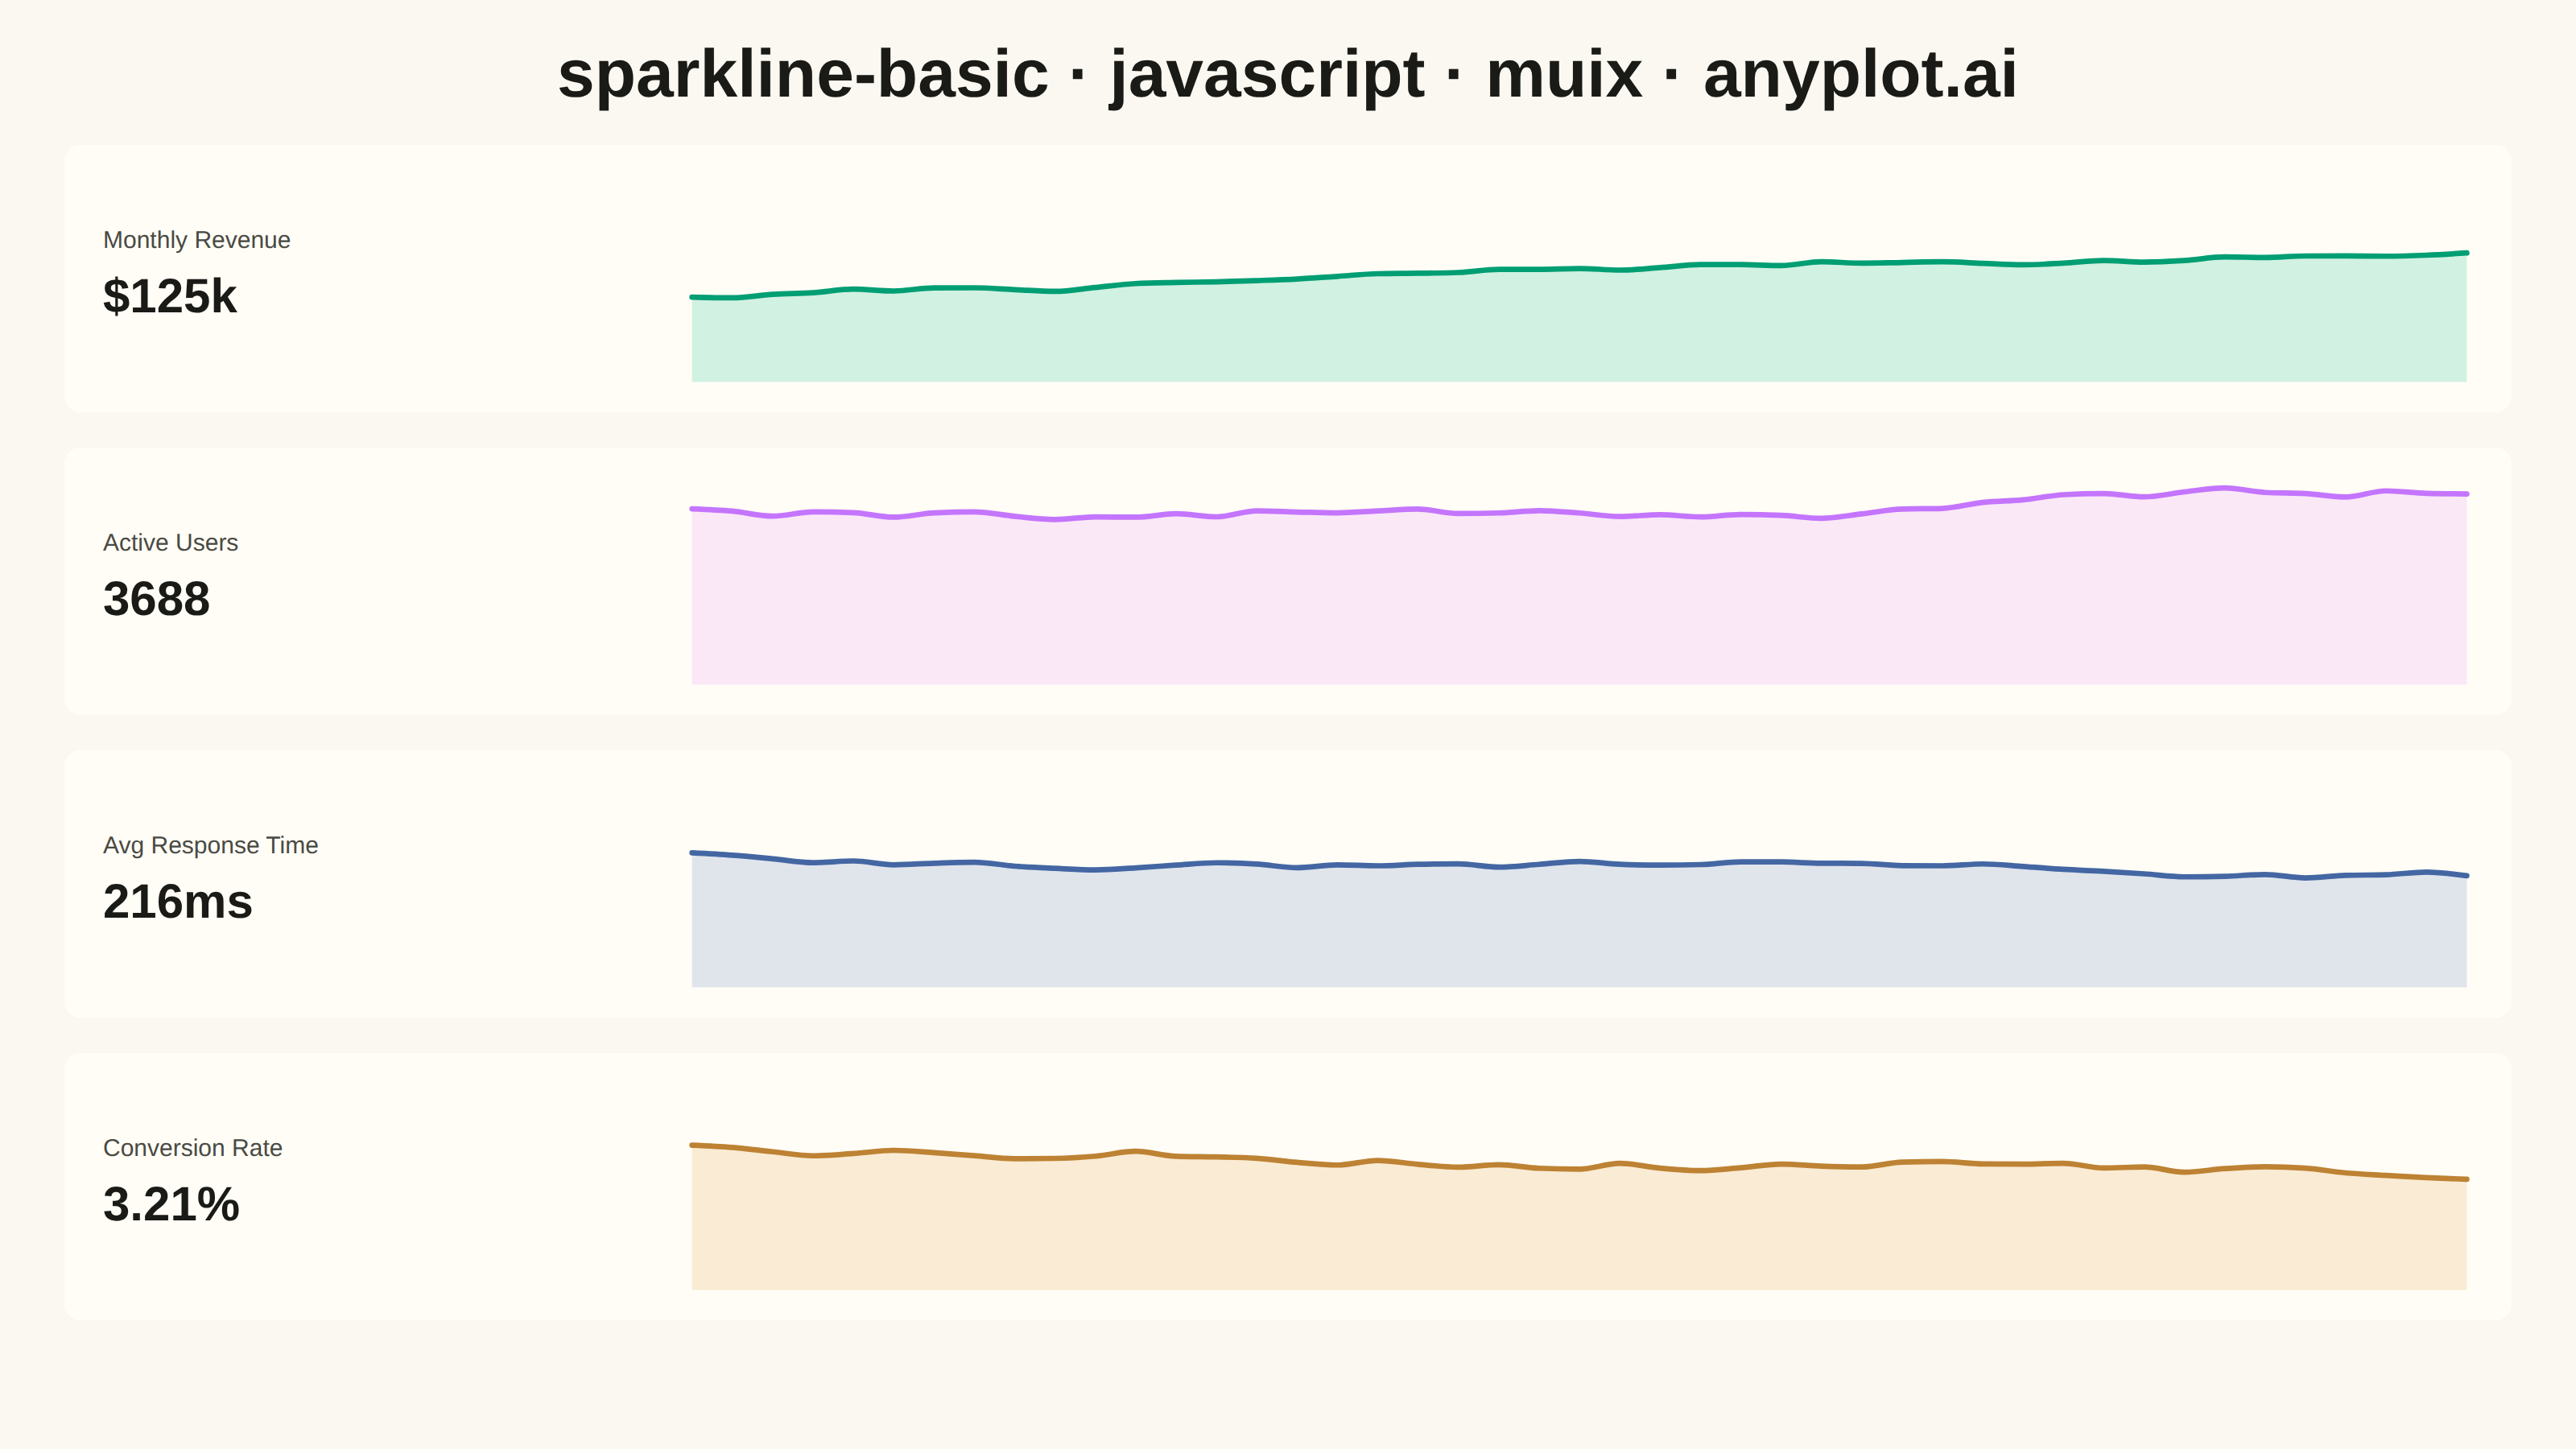
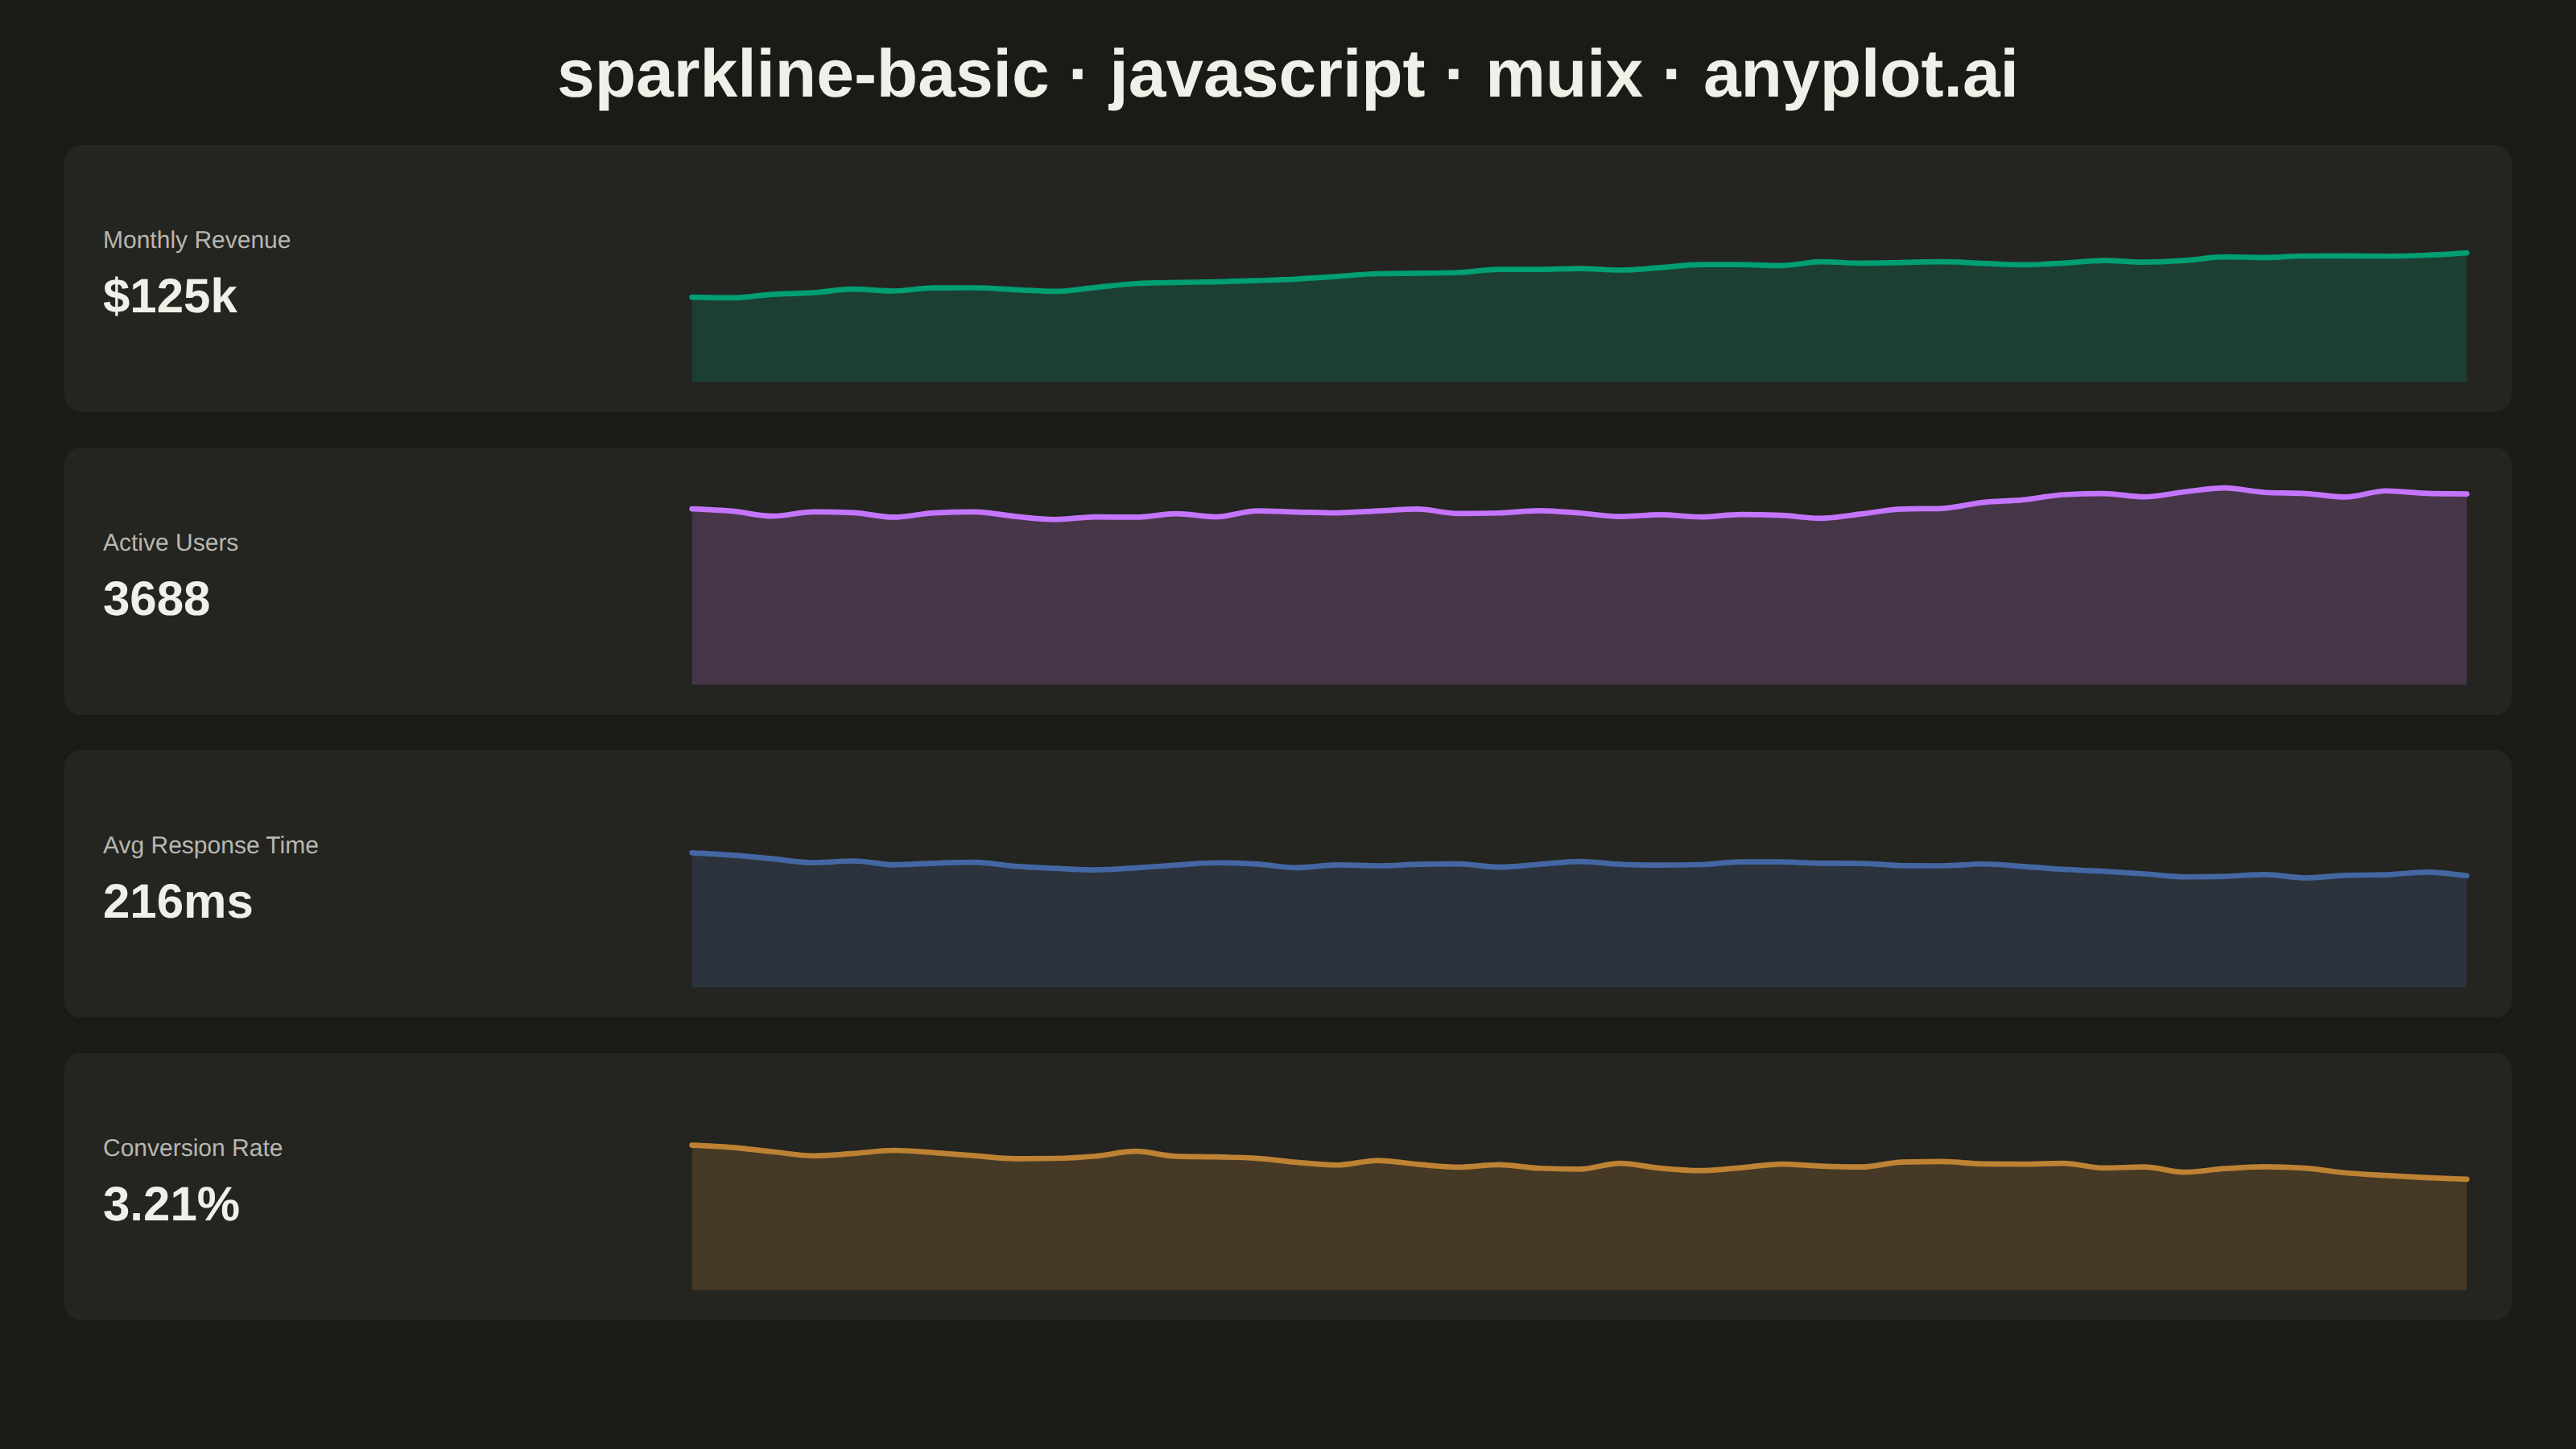
A sparkline is a small, condensed line chart designed to be embedded inline with text or in dashboard cells. It shows trends at a glance without axes, axis labels, or detailed scales - pure data visualization in minimal space. The defining characteristic is extreme minimalism: a single continuous line that conveys the shape of data without any chart chrome.
// anyplot.ai
// sparkline-basic: Basic Sparkline
// Library: muix 7.29.1 | JavaScript 22.23.2
// Quality: 88/100 | Created: 2026-09-09
//# anyplot-orientation: landscape

import { SparkLineChart } from "@mui/x-charts/SparkLineChart";
import Box from "@mui/material/Box";
import Typography from "@mui/material/Typography";

const t = window.ANYPLOT_TOKENS;

// --- Data (in-memory, deterministic fixed-seed LCG) -------------------------
// The browser has no seeded RNG, so a tiny linear congruential generator
// stands in for numpy's random.seed(42).
function makeLcg(seed) {
  let state = seed;
  return () => {
    state = (state * 1664525 + 1013904223) % 4294967296;
    return state / 4294967296;
  };
}

function randomWalk(seed, length, start, drift, volatility) {
  const rng = makeLcg(seed);
  const values = [start];
  for (let i = 1; i < length; i += 1) {
    const step = drift + (rng() - 0.5) * volatility;
    values.push(Math.max(0, values[i - 1] + step));
  }
  return values;
}

const POINTS = 45;

// Four dashboard KPI trend rows — one sparkline per metric, table-row style
const metrics = [
  {
    label: "Monthly Revenue",
    prefix: "$",
    unit: "k",
    color: t.palette[0],
    values: randomWalk(7, POINTS, 82, 0.9, 6),
  },
  {
    label: "Active Users",
    prefix: "",
    unit: "",
    color: t.palette[1],
    values: randomWalk(19, POINTS, 3400, 12, 220),
  },
  {
    label: "Avg Response Time",
    prefix: "",
    unit: "ms",
    color: t.palette[2],
    values: randomWalk(31, POINTS, 260, -1.1, 14),
  },
  {
    label: "Conversion Rate",
    prefix: "",
    unit: "%",
    color: t.palette[3],
    values: randomWalk(53, POINTS, 4.2, 0.02, 0.35),
  },
];

function formatValue(metric) {
  const last = metric.values[metric.values.length - 1];
  const decimals = last >= 100 ? 0 : last >= 10 ? 1 : 2;
  return `${metric.prefix}${last.toFixed(decimals)}${metric.unit}`;
}

const TITLE = "sparkline-basic · javascript · muix · anyplot.ai";
const TITLE_HEIGHT = 90;
const OUTER_PADDING = 40;
const ROW_GAP = 22;
const LABEL_COLUMN_WIDTH = 330;

// --- Chart (default-exported component — the harness mounts it) -------------
export default function Chart() {
  const width = window.ANYPLOT_SIZE.width;
  const height = window.ANYPLOT_SIZE.height;
  const bodyHeight = height - TITLE_HEIGHT - OUTER_PADDING * 2;
  const rowHeight = (bodyHeight - ROW_GAP * (metrics.length - 1)) / metrics.length;
  const sparkWidth = width - OUTER_PADDING * 2 - LABEL_COLUMN_WIDTH - 32;
  const sparkHeight = rowHeight - 12;

  return (
    <Box sx={{ width, height, display: "flex", flexDirection: "column" }}>
      <Box
        sx={{
          height: TITLE_HEIGHT,
          display: "flex",
          alignItems: "center",
          justifyContent: "center",
          flexShrink: 0,
        }}
      >
        <Typography sx={{ color: t.ink, fontSize: 42, fontWeight: 600 }}>
          {TITLE}
        </Typography>
      </Box>

      <Box
        sx={{
          display: "flex",
          flexDirection: "column",
          gap: `${ROW_GAP}px`,
          padding: `0px ${OUTER_PADDING}px ${OUTER_PADDING}px`,
          boxSizing: "border-box",
        }}
      >
        {metrics.map((metric) => (
          <Box
            key={metric.label}
            sx={{
              height: rowHeight,
              backgroundColor: t.elevatedBg,
              borderRadius: "10px",
              padding: "0px 24px",
              boxSizing: "border-box",
              display: "flex",
              alignItems: "center",
              gap: "32px",
            }}
          >
            <Box sx={{ width: LABEL_COLUMN_WIDTH, flexShrink: 0 }}>
              <Typography sx={{ color: t.inkSoft, fontSize: 15 }}>
                {metric.label}
              </Typography>
              <Typography sx={{ color: t.ink, fontSize: 30, fontWeight: 600 }}>
                {formatValue(metric)}
              </Typography>
            </Box>

            <SparkLineChart
              data={metric.values}
              width={sparkWidth}
              height={sparkHeight}
              colors={[metric.color]}
              curve="monotoneX"
              area
              skipAnimation
              margin={{ top: 10, bottom: 10, left: 4, right: 4 }}
              sx={{
                "& .MuiLineElement-root": {
                  strokeWidth: 3.5,
                  strokeLinecap: "round",
                  strokeLinejoin: "round",
                },
                "& .MuiAreaElement-root": {
                  fillOpacity: 0.18,
                },
              }}
            />
          </Box>
        ))}
      </Box>
    </Box>
  );
}
Runnable source as JSON, for any HTTP client: https://api.anyplot.ai/specs/sparkline-basic/muix/code. Any spec id and library id listed in llms-full.txt fit the same URL shape; every URL below is complete and callable.
{
  "spec_id": "sparkline-basic",
  "language": "javascript",
  "library": "muix",
  "page": "https://anyplot.ai/sparkline-basic/javascript/muix",
  "hub": "https://anyplot.ai/sparkline-basic",
  "code_json": "https://api.anyplot.ai/specs/sparkline-basic/muix/code",
  "spec_json": "https://api.anyplot.ai/specs/sparkline-basic",
  "render_light_png": "https://storage.googleapis.com/anyplot-images/plots/sparkline-basic/javascript/muix/plot-light.png",
  "render_dark_png": "https://storage.googleapis.com/anyplot-images/plots/sparkline-basic/javascript/muix/plot-dark.png",
  "interactive_light_html": "https://storage.googleapis.com/anyplot-images/plots/sparkline-basic/javascript/muix/plot-light.html",
  "interactive_dark_html": "https://storage.googleapis.com/anyplot-images/plots/sparkline-basic/javascript/muix/plot-dark.html",
  "quality_score": 88.0,
  "license": "MIT",
  "guide": "https://anyplot.ai/llms.txt"
}
Part of Basic Sparkline on anyplot.ai.