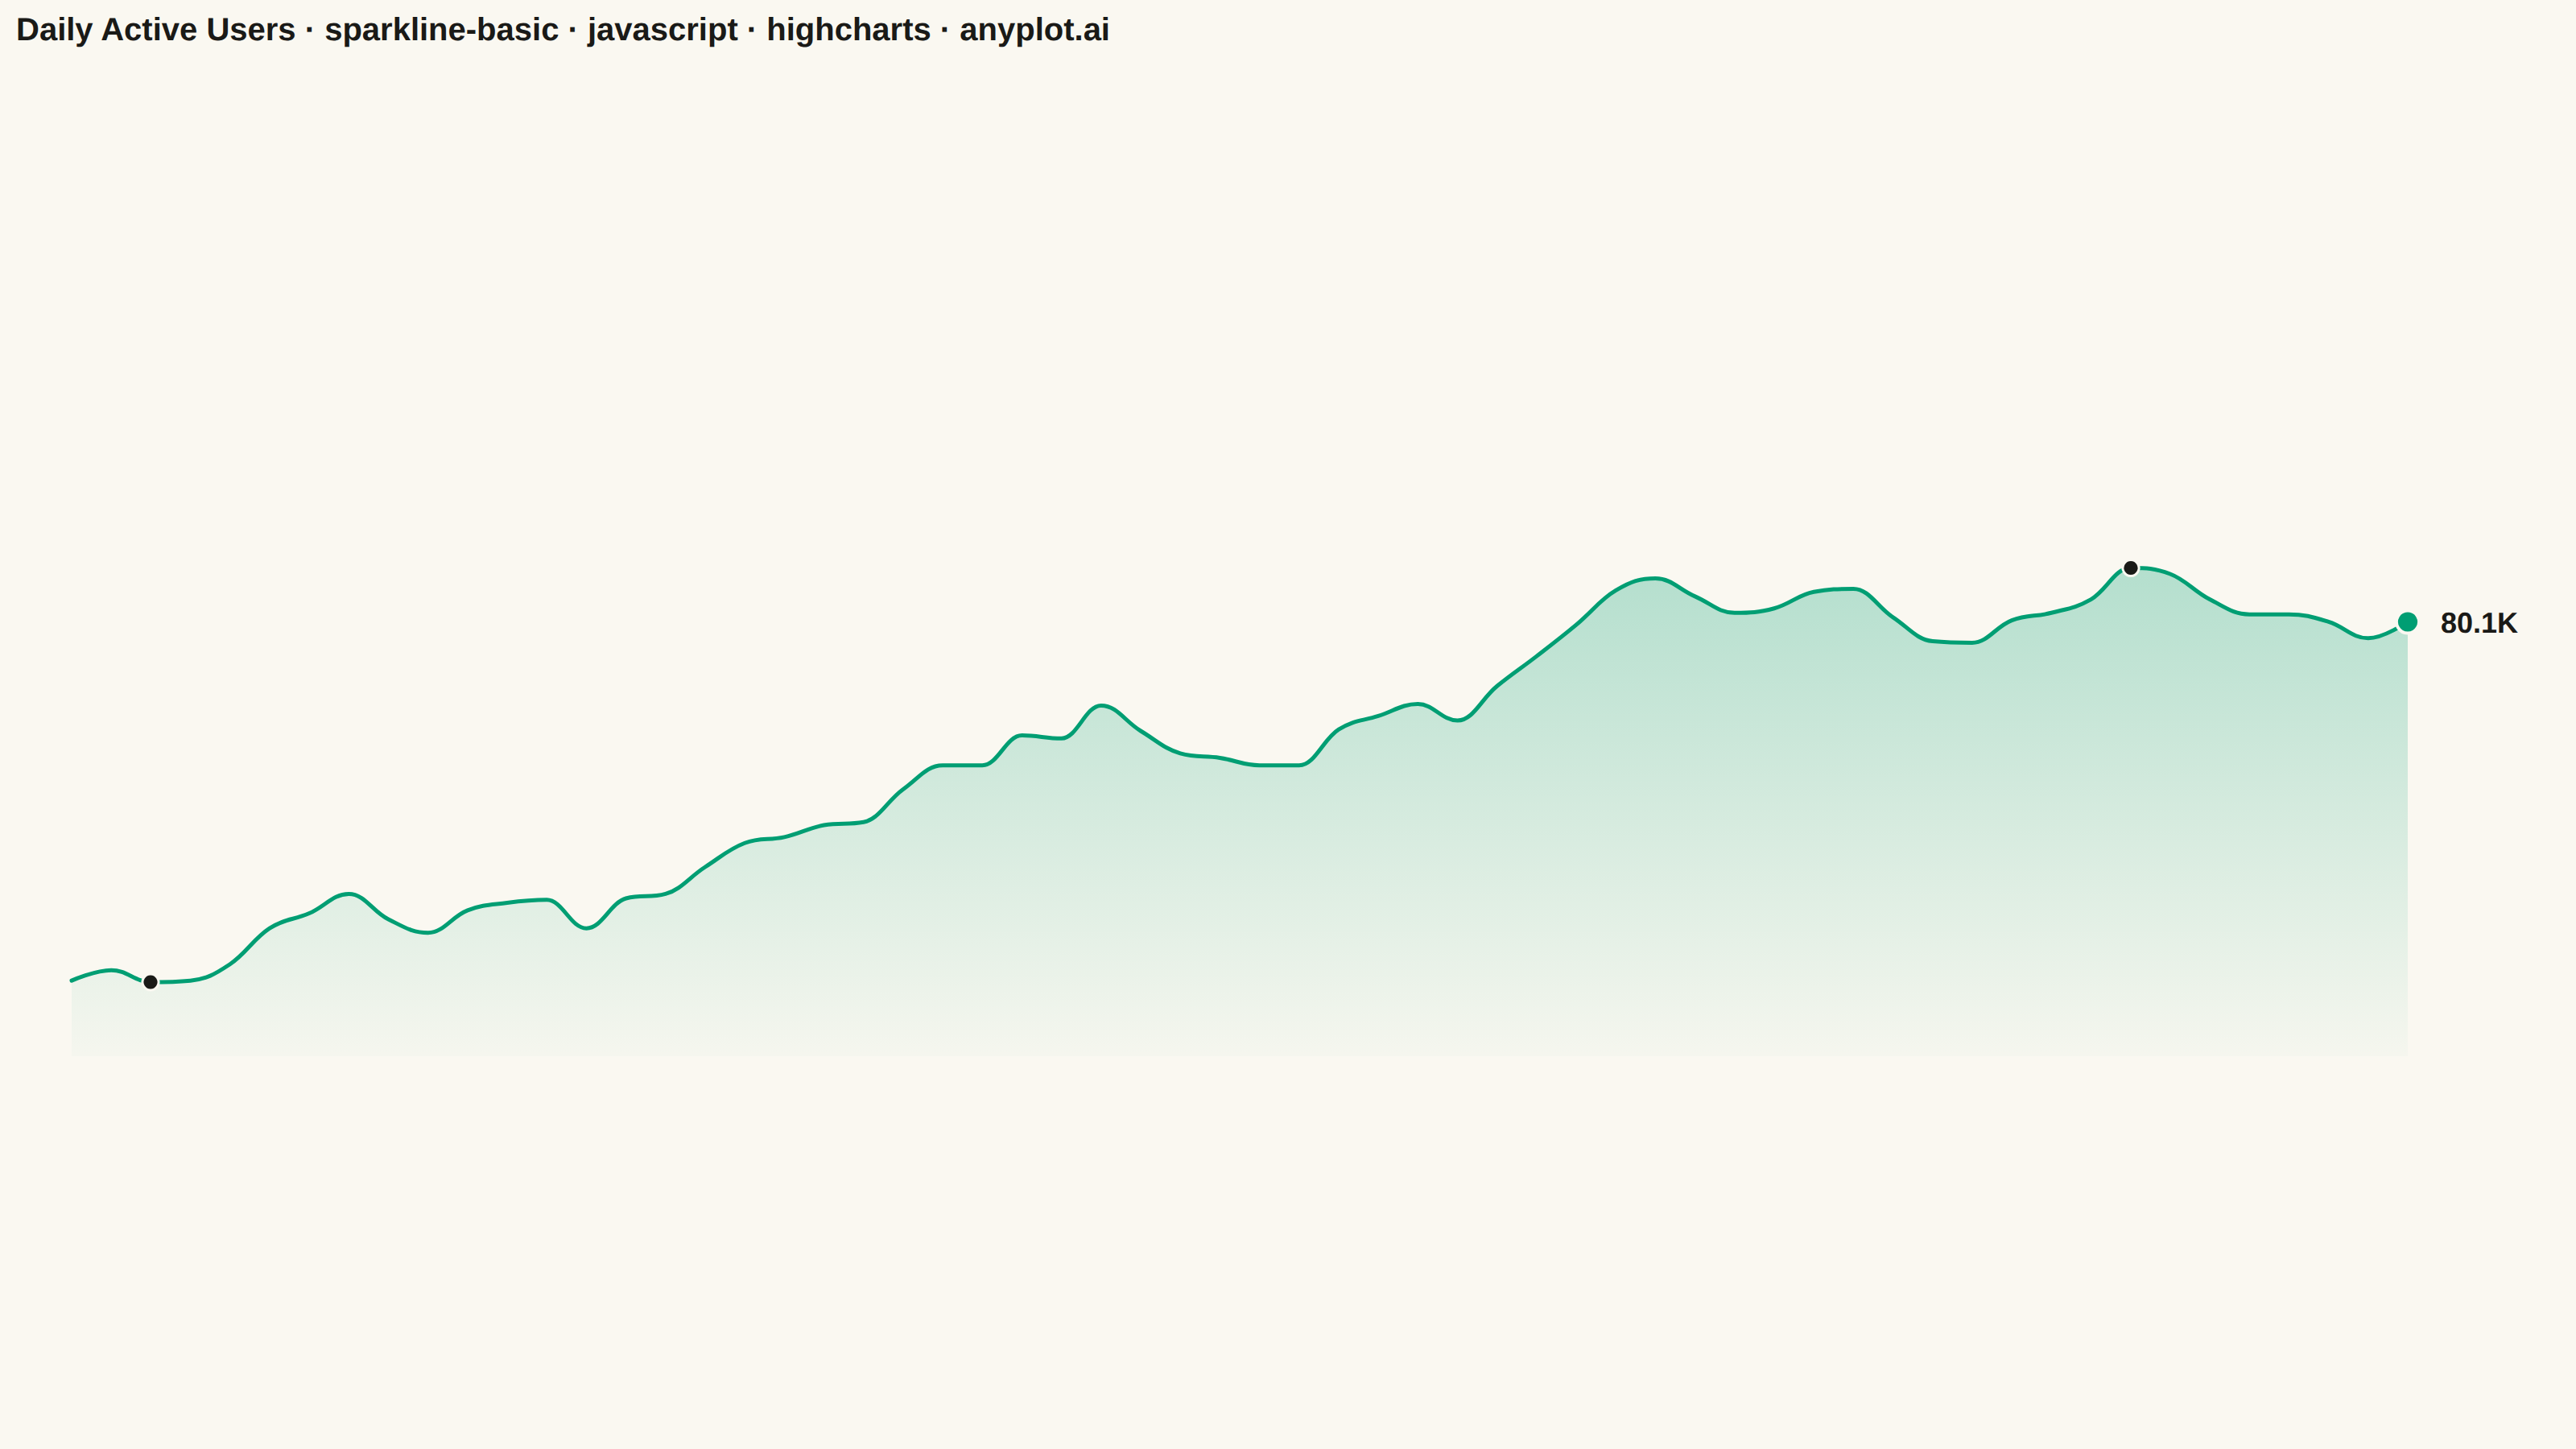
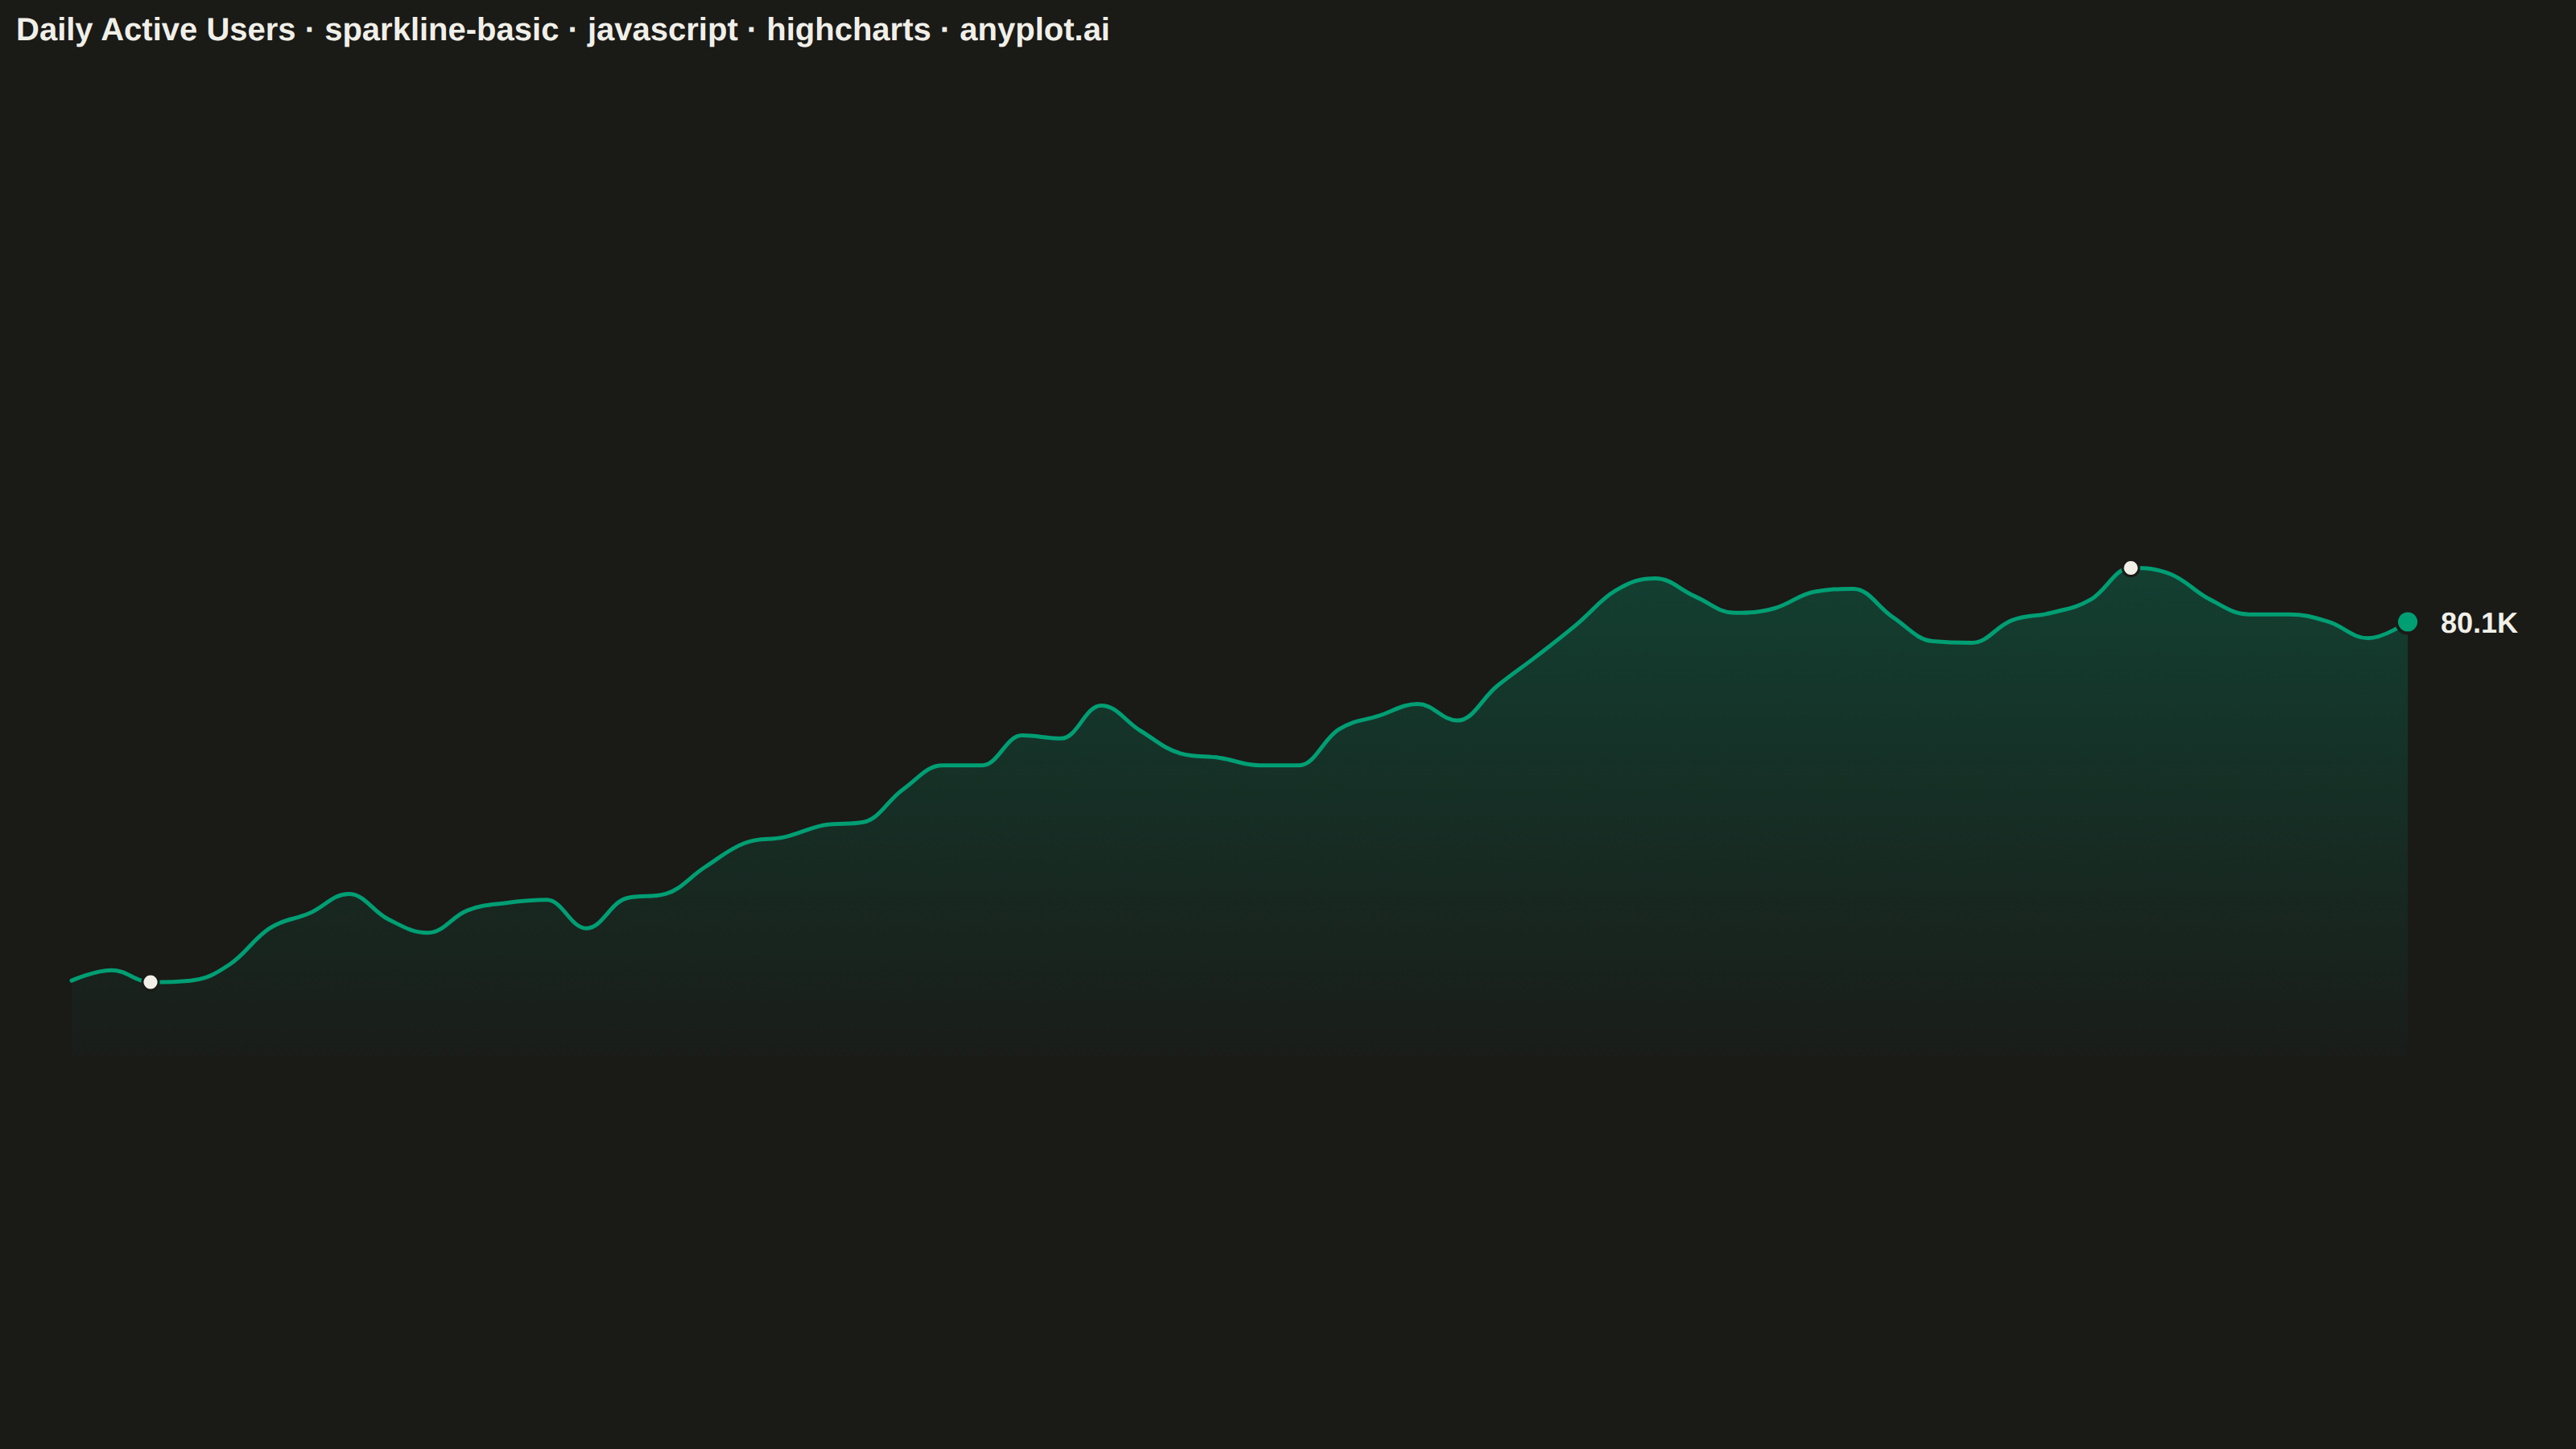
The same plot in 14 other libraries — JavaScript: Chart.js, D3.js, Apache ECharts, MUI X Charts; Python: Altair, Bokeh, lets-plot, Matplotlib, Plotly, plotnine, Pygal, Seaborn; R: ggplot2; Julia: Makie.jl. Compare all 15 side by side: Basic Sparkline in Python, R, Julia and JavaScript.
A sparkline is a small, condensed line chart designed to be embedded inline with text or in dashboard cells. It shows trends at a glance without axes, axis labels, or detailed scales - pure data visualization in minimal space. The defining characteristic is extreme minimalism: a single continuous line that conveys the shape of data without any chart chrome.
// anyplot.ai
// sparkline-basic: Basic Sparkline
// Library: highcharts 12.6.0 | JavaScript 22.23.2
// Quality: 90/100 | Created: 2026-09-09

const t = window.ANYPLOT_TOKENS;

// --- Data (in-memory, deterministic LCG — daily active users, thousands) --
function lcg(seed) {
  let state = seed % 2147483647;
  if (state <= 0) state += 2147483646;
  return function () {
    state = (state * 48271) % 2147483647;
    return (state - 1) / 2147483646;
  };
}
const rand = lcg(42);
const days = 60;
const values = [];
let level = 58;
for (let i = 0; i < days; i++) {
  level = Math.max(30, level + 0.35 + (rand() - 0.5) * 4.5);
  values.push(Math.round(level * 10) / 10);
}

const minIndex = values.indexOf(Math.min(...values));
const maxIndex = values.indexOf(Math.max(...values));
const lastIndex = values.length - 1;
const dataRange = values[maxIndex] - values[minIndex];

const referenceMarker = {
  enabled: true,
  radius: 5,
  fillColor: t.ink,
  lineColor: t.pageBg,
  lineWidth: 1.5,
};

const seriesData = values.map((value, index) => {
  if (index === lastIndex) {
    return {
      y: value,
      marker: { enabled: true, radius: 7, fillColor: t.palette[0], lineColor: t.pageBg, lineWidth: 2 },
      dataLabels: {
        enabled: true,
        format: `${value}K`,
        align: "left",
        verticalAlign: "middle",
        x: 16,
        crop: false,
        overflow: "allow",
        style: { color: t.ink, fontSize: "18px", fontWeight: "600", textOutline: "none" },
      },
    };
  }
  if (index === minIndex || index === maxIndex) {
    return { y: value, marker: referenceMarker };
  }
  return value;
});

const title = "Daily Active Users · sparkline-basic · javascript · highcharts · anyplot.ai";
const titleFontSize = Math.round(22 * Math.min(1, 67 / title.length));

// --- Chart -------------------------------------------------------------
Highcharts.chart("container", {
  chart: {
    type: "areaspline",
    backgroundColor: "transparent",
    animation: false,
    margin: [90, 90, 30, 30],
    style: { fontFamily: "inherit" },
  },
  credits: { enabled: false },
  colors: t.palette,
  title: {
    text: title,
    align: "left",
    style: { color: t.ink, fontSize: `${titleFontSize}px`, fontWeight: "600" },
  },
  xAxis: { visible: false },
  yAxis: {
    visible: false,
    startOnTick: false,
    endOnTick: false,
    // Pad by a full data-range width on each side so the trend line occupies
    // roughly the middle third of the plot area — a compact sparkline band
    // rather than a full-bleed area chart.
    min: Math.floor(Math.min(...values) - dataRange),
    max: Math.ceil(Math.max(...values) + dataRange),
  },
  legend: { enabled: false },
  tooltip: {
    backgroundColor: t.elevatedBg,
    borderWidth: 0,
    style: { color: t.ink, fontSize: "14px" },
    valueSuffix: "K DAU",
  },
  plotOptions: {
    series: { animation: false },
    areaspline: {
      lineWidth: 2.5,
      color: t.palette[0],
      // Cap the fill's baseline close to the data minimum instead of the
      // default 0 (which sits far below the padded yAxis min and would
      // otherwise render the fill all the way to the bottom of the canvas).
      threshold: Math.floor(Math.min(...values) - dataRange * 0.15),
      fillColor: {
        linearGradient: { x1: 0, y1: 0, x2: 0, y2: 1 },
        stops: [
          [0, Highcharts.color(t.palette[0]).setOpacity(0.28).get()],
          [1, Highcharts.color(t.palette[0]).setOpacity(0.02).get()],
        ],
      },
      marker: { enabled: false },
    },
  },
  series: [{ name: "Daily active users", data: seriesData }],
});
Runnable source as JSON, for any HTTP client: https://api.anyplot.ai/specs/sparkline-basic/highcharts/code. Any spec id and library id listed in llms-full.txt fit the same URL shape; every URL below is complete and callable.
{
  "spec_id": "sparkline-basic",
  "language": "javascript",
  "library": "highcharts",
  "page": "https://anyplot.ai/sparkline-basic/javascript/highcharts",
  "hub": "https://anyplot.ai/sparkline-basic",
  "code_json": "https://api.anyplot.ai/specs/sparkline-basic/highcharts/code",
  "spec_json": "https://api.anyplot.ai/specs/sparkline-basic",
  "render_light_png": "https://storage.googleapis.com/anyplot-images/plots/sparkline-basic/javascript/highcharts/plot-light.png",
  "render_dark_png": "https://storage.googleapis.com/anyplot-images/plots/sparkline-basic/javascript/highcharts/plot-dark.png",
  "interactive_light_html": "https://storage.googleapis.com/anyplot-images/plots/sparkline-basic/javascript/highcharts/plot-light.html",
  "interactive_dark_html": "https://storage.googleapis.com/anyplot-images/plots/sparkline-basic/javascript/highcharts/plot-dark.html",
  "quality_score": 90.0,
  "license": "MIT",
  "guide": "https://anyplot.ai/llms.txt"
}
Part of Basic Sparkline on anyplot.ai.