The same plot in 14 other libraries — JavaScript: Chart.js, D3.js, Highcharts, MUI X Charts; Python: Altair, Bokeh, lets-plot, Matplotlib, Plotly, plotnine, Pygal, Seaborn; R: ggplot2; Julia: Makie.jl. Compare all 15 side by side: Basic Sparkline in Python, R, Julia and JavaScript.
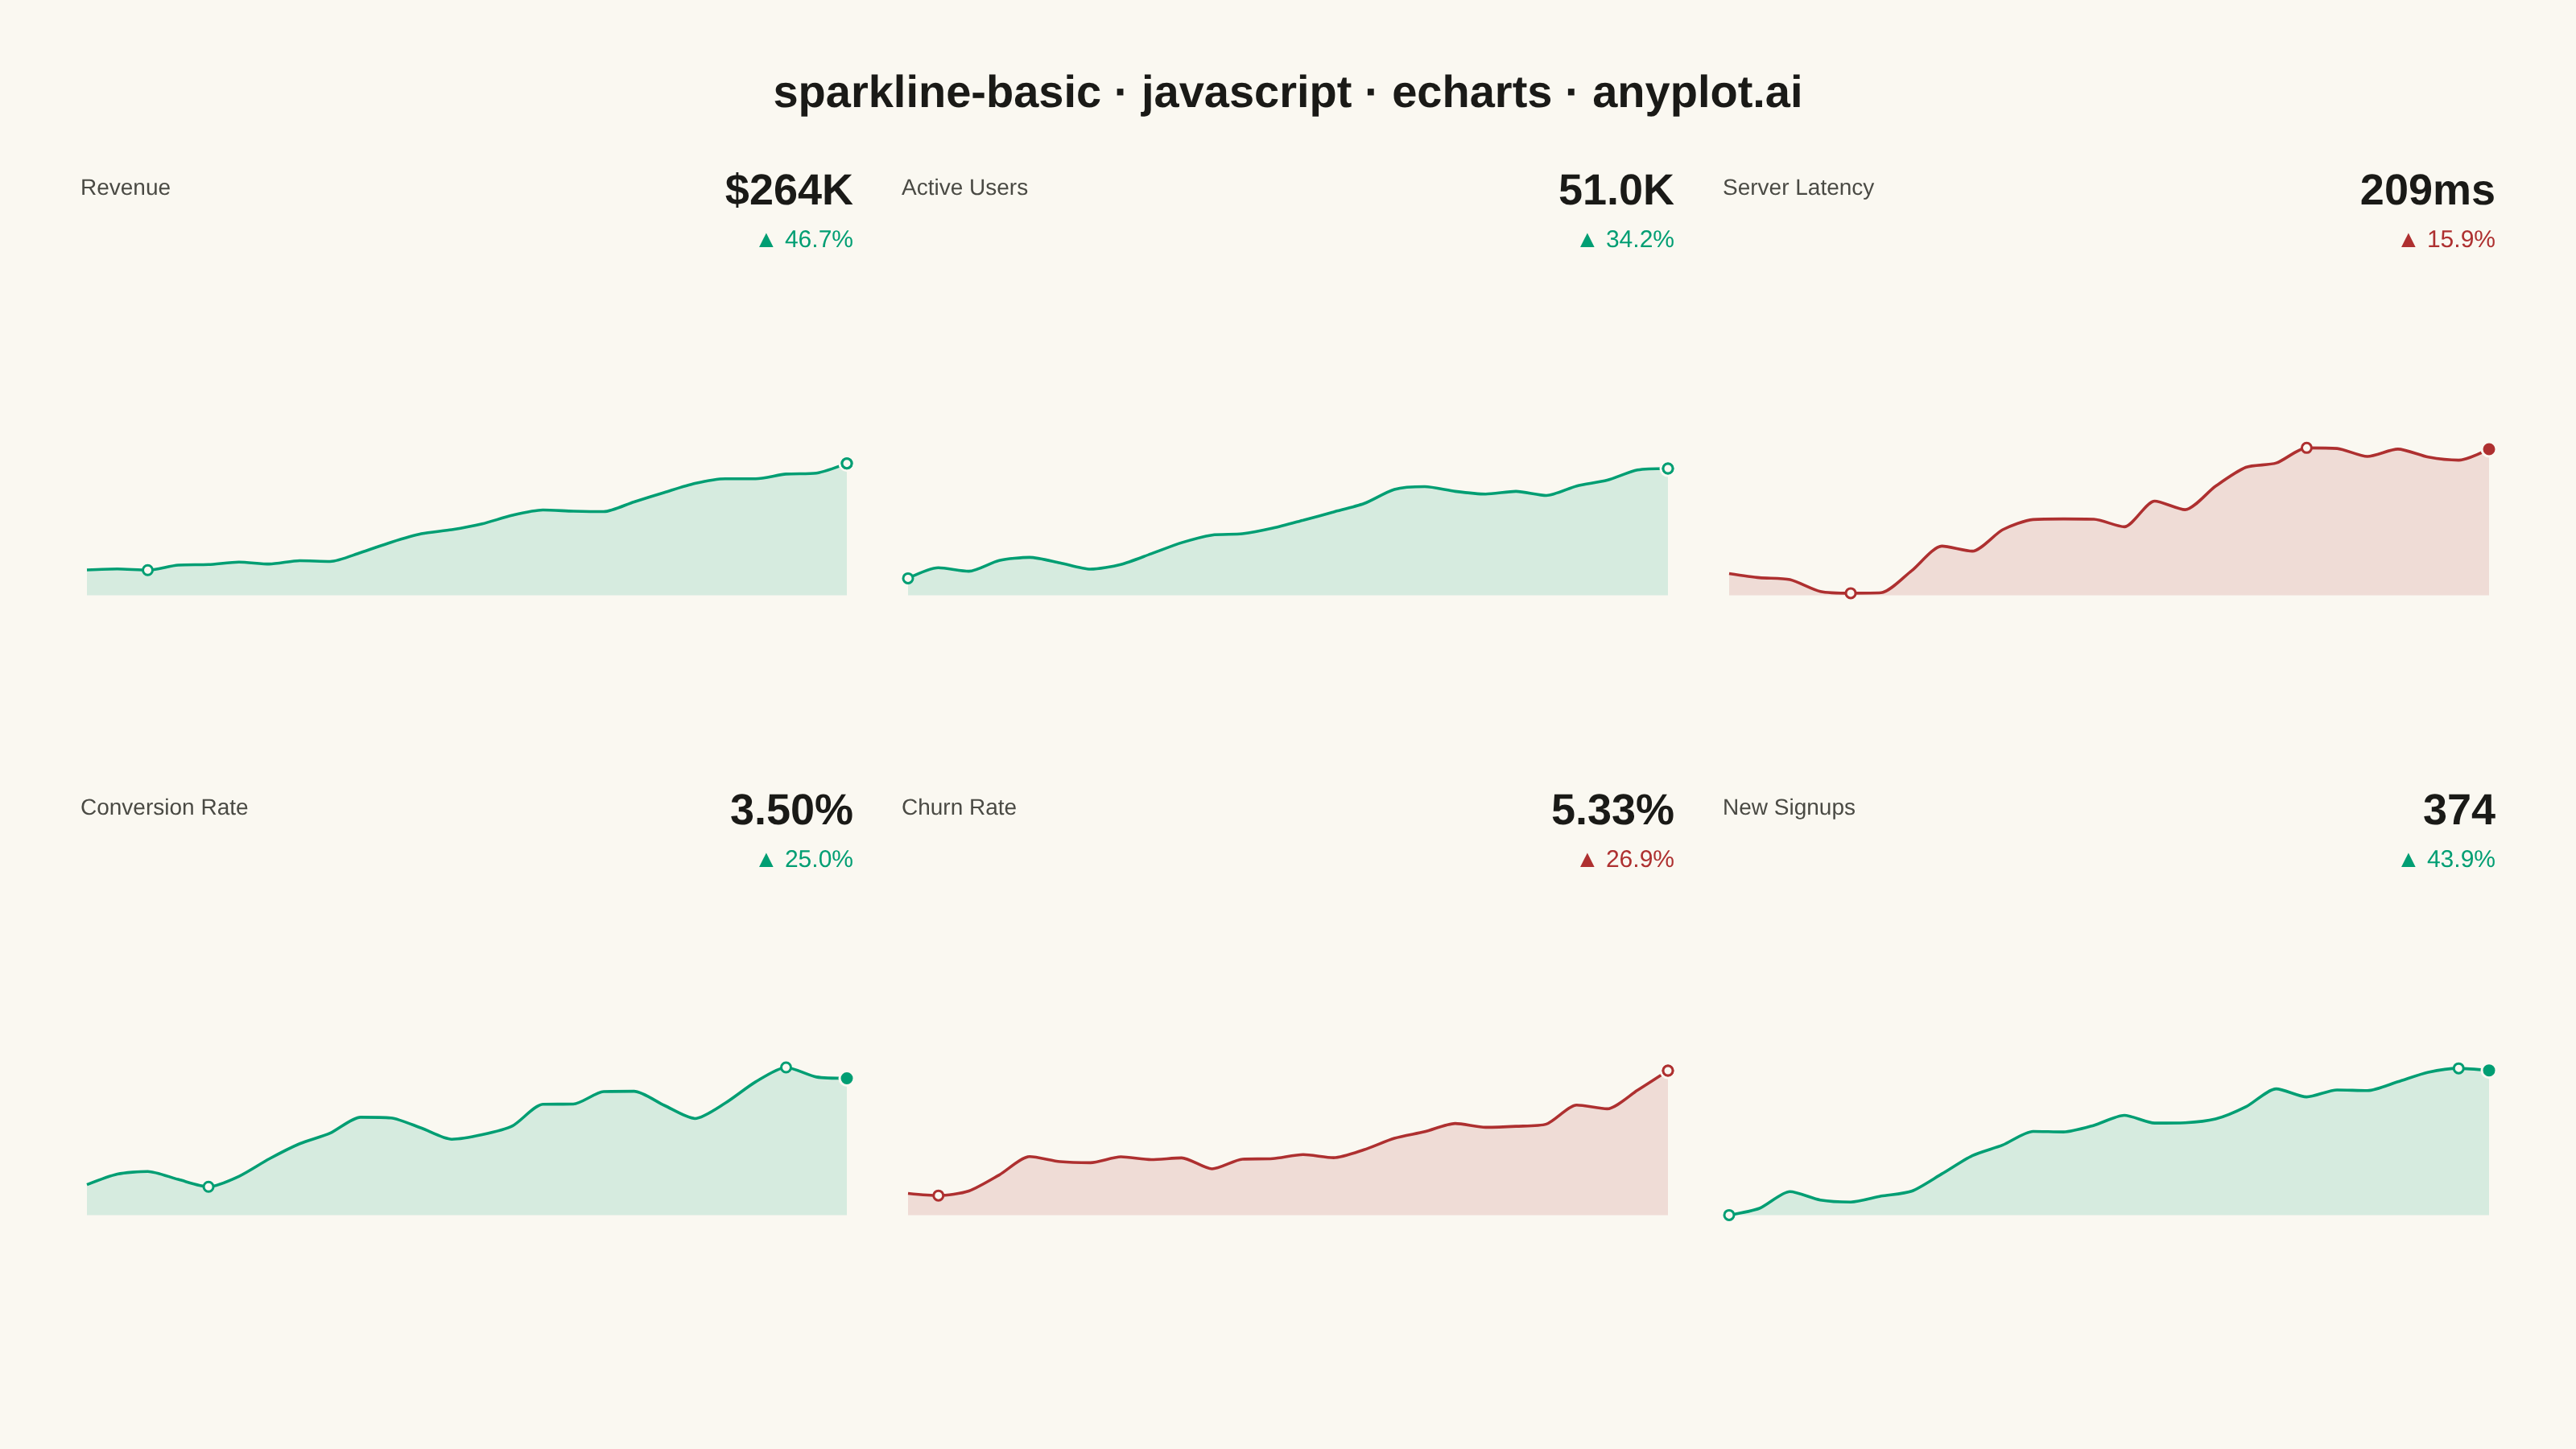
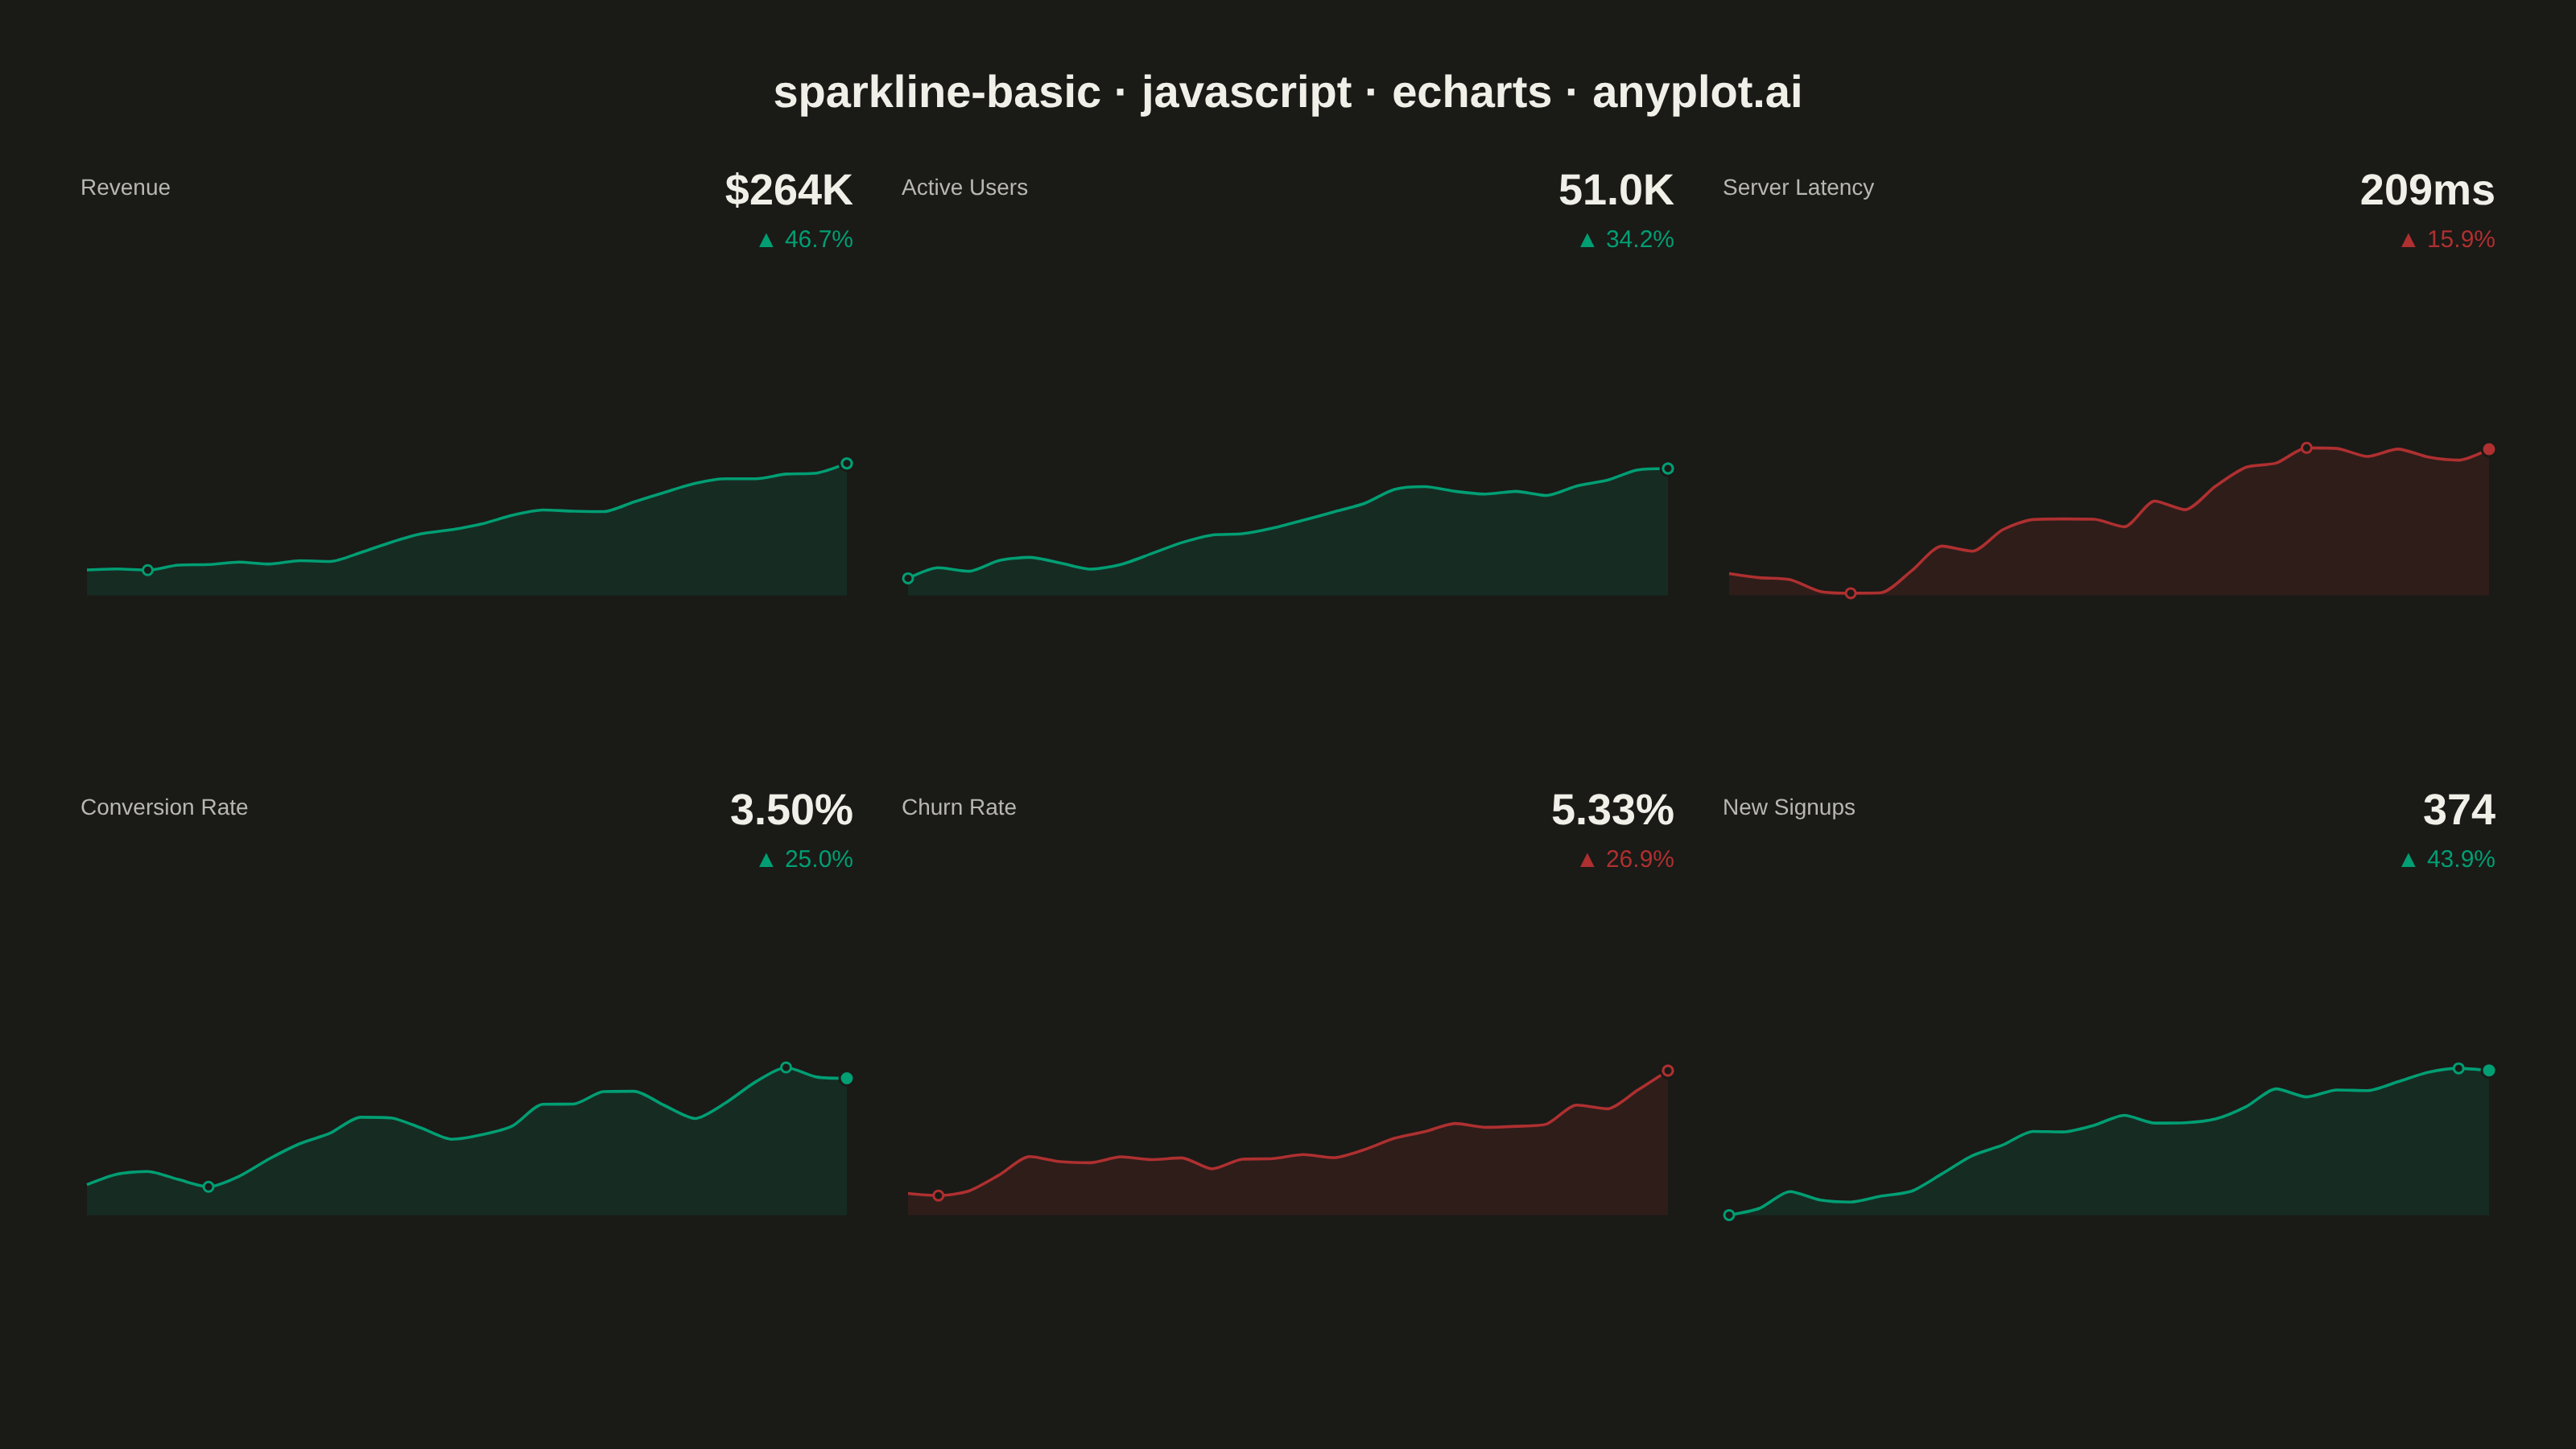
A sparkline is a small, condensed line chart designed to be embedded inline with text or in dashboard cells. It shows trends at a glance without axes, axis labels, or detailed scales - pure data visualization in minimal space. The defining characteristic is extreme minimalism: a single continuous line that conveys the shape of data without any chart chrome.
// anyplot.ai
// sparkline-basic: Basic Sparkline
// Library: echarts 6.1.0 | JavaScript 22.23.2
// Quality: 89/100 | Created: 2026-09-09

//# anyplot-orientation: landscape
const t = window.ANYPLOT_TOKENS;

// --- Data: six KPI trend series (deterministic random walks) ---------------
// Tiny fixed-seed LCG — the browser has no seeded Math.random.
let seed = 42;
const lcg = () => {
  seed = (seed * 1664525 + 1013904223) % 4294967296;
  return seed / 4294967296;
};

const POINTS = 26;
// One shared walk generator (rather than inlining the loop per metric) avoids
// repeating the same random-walk math six times — DRY across metrics, not the
// default "no functions" style.
const walk = (start, drift, volatility) => {
  const series = [start];
  for (let i = 1; i < POINTS; i += 1) {
    series.push(Math.max(series[i - 1] + drift + (lcg() - 0.5) * volatility, 0));
  }
  return series;
};

// goodWhenUp: whether an upward trend is a positive signal for this metric.
const metrics = [
  { label: "Revenue", data: walk(180, 3.2, 10), goodWhenUp: true, format: (v) => `$${Math.round(v)}K` },
  { label: "Active Users", data: walk(38, 0.45, 2.5), goodWhenUp: true, format: (v) => `${v.toFixed(1)}K` },
  { label: "Server Latency", data: walk(180, 1.6, 9), goodWhenUp: false, format: (v) => `${Math.round(v)}ms` },
  { label: "Conversion Rate", data: walk(2.8, 0.02, 0.25), goodWhenUp: true, format: (v) => `${v.toFixed(2)}%` },
  { label: "Churn Rate", data: walk(4.2, 0.045, 0.3), goodWhenUp: false, format: (v) => `${v.toFixed(2)}%` },
  { label: "New Signups", data: walk(260, 3.8, 22), goodWhenUp: true, format: (v) => `${Math.round(v)}` },
];

// Trend direction drives color: green (Imprint brand) for a positive signal,
// matte red for a negative one — the finance up/down semantic exception.
const cards = metrics.map((m) => {
  const first = m.data[0];
  const last = m.data[m.data.length - 1];
  const deltaPct = ((last - first) / first) * 100;
  const trendUp = deltaPct >= 0;
  const good = m.goodWhenUp === trendUp;
  return { ...m, last, deltaPct, trendUp, color: good ? t.palette[0] : t.palette[4] };
});

// --- Layout: a 2x3 grid of KPI tiles, each an independent mini sparkline ---
// Positions are in the harness's CSS mount space (1600x900 for landscape,
// scaled 2x to the 3200x1800 output) — see window.ANYPLOT_SIZE.
const SIZE = window.ANYPLOT_SIZE;
const COLS = 3;
const ROWS = 2;
const MARGIN = 50;
const GAP = 30;
const CONTENT_TOP = 110;
const CONTENT_BOTTOM = 50;
const CARD_W = (SIZE.width - 2 * MARGIN - (COLS - 1) * GAP) / COLS;
const CARD_H = (SIZE.height - CONTENT_TOP - CONTENT_BOTTOM - (ROWS - 1) * GAP) / ROWS;
const HEADER_H = 70; // label + value + trend text block above each sparkline
const SPARK_RATIO = 5; // width:height for the line itself — spec calls for 4:1-8:1

const grid = [];
const xAxis = [];
const yAxis = [];
const series = [];
const graphic = [];

cards.forEach((card, i) => {
  const row = Math.floor(i / COLS);
  const col = i % COLS;
  const x0 = MARGIN + col * (CARD_W + GAP);
  const y0 = CONTENT_TOP + row * (CARD_H + GAP);
  // Keep the sparkline itself compact (per SPARK_RATIO) and center it, with
  // the freed vertical space as padding, in the space below the text header.
  const sparkHeight = (CARD_W - 8) / SPARK_RATIO;
  const sparkTop = y0 + HEADER_H + (CARD_H - HEADER_H - sparkHeight) / 2;

  graphic.push(
    {
      type: "text",
      left: x0,
      top: y0,
      style: { text: card.label, fontSize: 14, fill: t.inkSoft },
    },
    {
      // `right` anchors the text's own right edge — `left` + textAlign:"right"
      // does not work for auto-sized graphic text (the box == the glyph run).
      type: "text",
      right: SIZE.width - (x0 + CARD_W),
      top: y0 - 4,
      style: { text: card.format(card.last), fontSize: 27, fontWeight: "bold", fill: t.ink },
    },
    {
      type: "text",
      right: SIZE.width - (x0 + CARD_W),
      top: y0 + 32,
      style: {
        text: `${card.trendUp ? "▲" : "▼"} ${Math.abs(card.deltaPct).toFixed(1)}%`,
        fontSize: 15,
        fill: card.color,
      },
    },
  );

  grid.push({ left: x0 + 4, top: sparkTop, width: CARD_W - 8, height: sparkHeight });
  xAxis.push({
    gridIndex: i,
    type: "category",
    data: card.data.map((_, idx) => idx),
    boundaryGap: false,
    show: false,
  });
  yAxis.push({ gridIndex: i, type: "value", scale: true, show: false, splitLine: { show: false } });
  series.push({
    type: "line",
    xAxisIndex: i,
    yAxisIndex: i,
    data: card.data,
    symbol: "none",
    smooth: 0.25,
    lineStyle: { width: 1.8, color: card.color },
    areaStyle: { color: card.color, opacity: 0.14 },
    markPoint: {
      symbol: "circle",
      symbolSize: 9,
      label: { show: false },
      itemStyle: { color: card.color, borderColor: t.pageBg, borderWidth: 1.5 },
      data: [
        { coord: [POINTS - 1, card.last] }, // latest value: filled dot
        // series max/min: hollow rings, a lighter secondary emphasis
        { type: "max", symbolSize: 6, itemStyle: { color: t.pageBg, borderColor: card.color, borderWidth: 1.5 } },
        { type: "min", symbolSize: 6, itemStyle: { color: t.pageBg, borderColor: card.color, borderWidth: 1.5 } },
      ],
    },
  });
});

// --- Init ---------------------------------------------------------------
const chart = echarts.init(document.getElementById("container"));

// --- Option ---------------------------------------------------------------
chart.setOption({
  animation: false,
  color: t.palette,
  backgroundColor: "transparent",
  title: {
    text: "sparkline-basic · javascript · echarts · anyplot.ai",
    left: "center",
    top: 40,
    textStyle: { color: t.ink, fontSize: 28 },
  },
  grid,
  xAxis,
  yAxis,
  series,
  graphic,
});
Runnable source as JSON, for any HTTP client: https://api.anyplot.ai/specs/sparkline-basic/echarts/code. Any spec id and library id listed in llms-full.txt fit the same URL shape; every URL below is complete and callable.
{
  "spec_id": "sparkline-basic",
  "language": "javascript",
  "library": "echarts",
  "page": "https://anyplot.ai/sparkline-basic/javascript/echarts",
  "hub": "https://anyplot.ai/sparkline-basic",
  "code_json": "https://api.anyplot.ai/specs/sparkline-basic/echarts/code",
  "spec_json": "https://api.anyplot.ai/specs/sparkline-basic",
  "render_light_png": "https://storage.googleapis.com/anyplot-images/plots/sparkline-basic/javascript/echarts/plot-light.png",
  "render_dark_png": "https://storage.googleapis.com/anyplot-images/plots/sparkline-basic/javascript/echarts/plot-dark.png",
  "interactive_light_html": "https://storage.googleapis.com/anyplot-images/plots/sparkline-basic/javascript/echarts/plot-light.html",
  "interactive_dark_html": "https://storage.googleapis.com/anyplot-images/plots/sparkline-basic/javascript/echarts/plot-dark.html",
  "quality_score": 89.0,
  "license": "MIT",
  "guide": "https://anyplot.ai/llms.txt"
}
Part of Basic Sparkline on anyplot.ai.