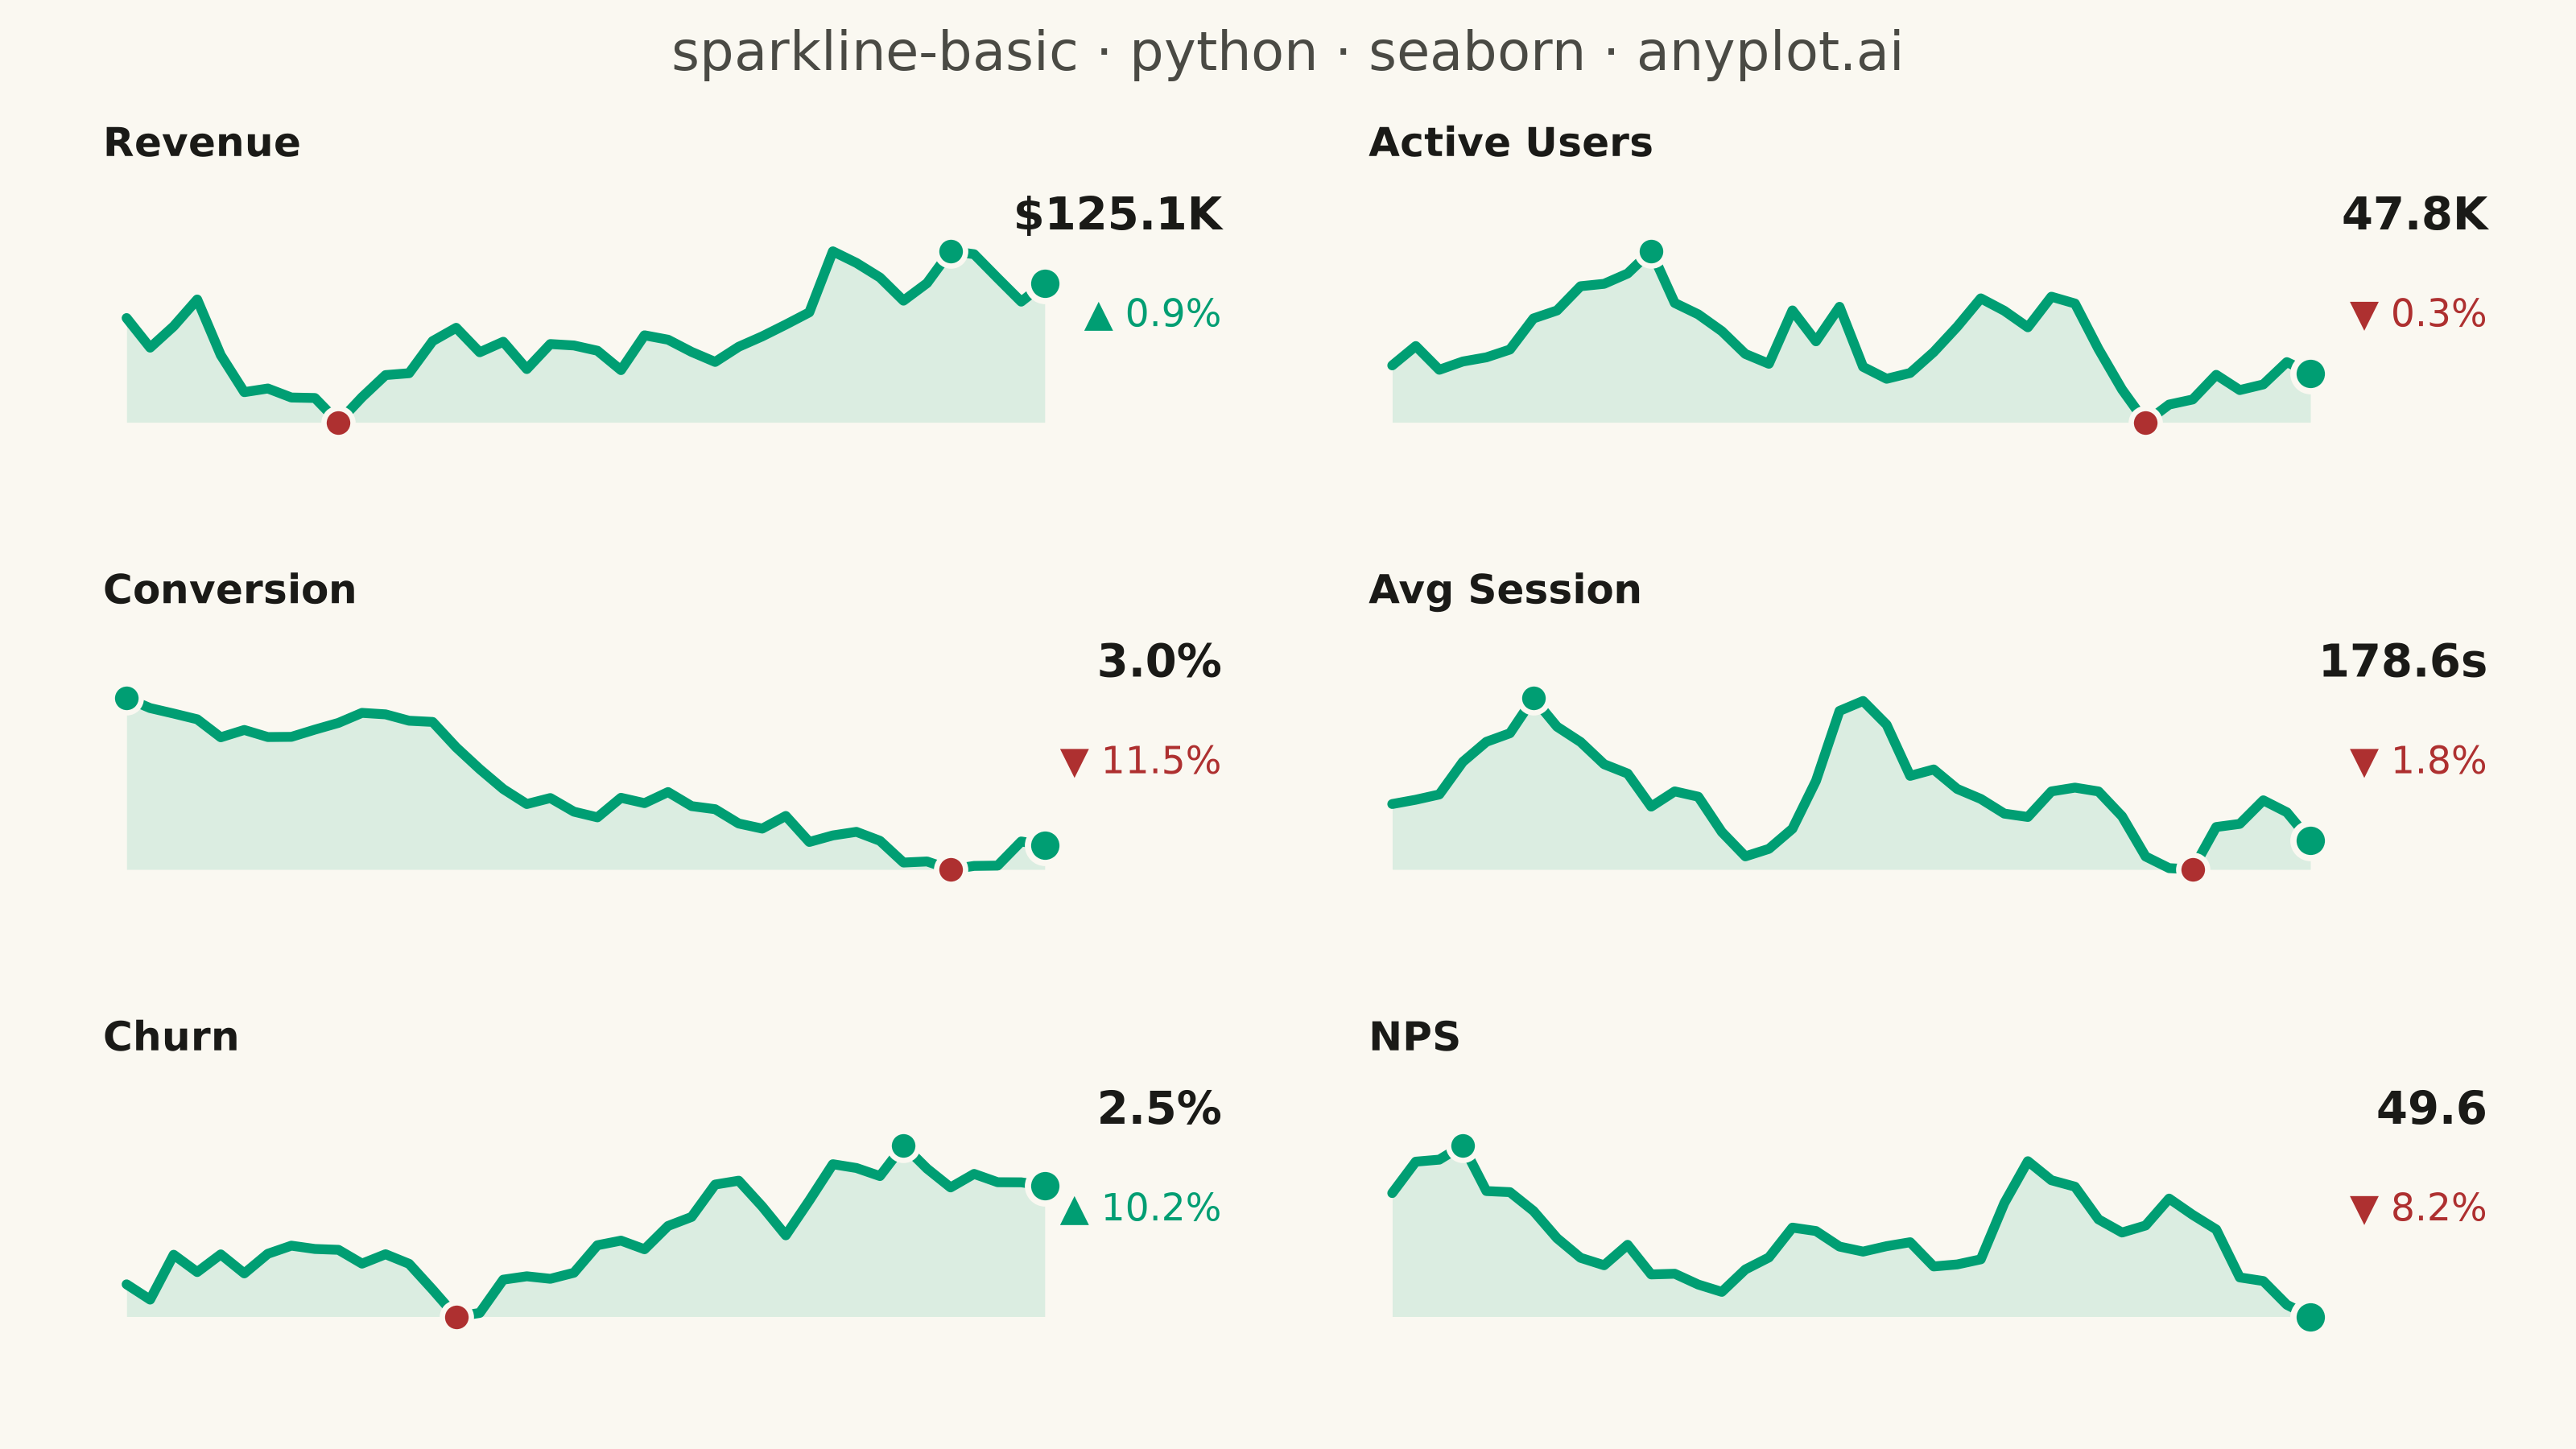
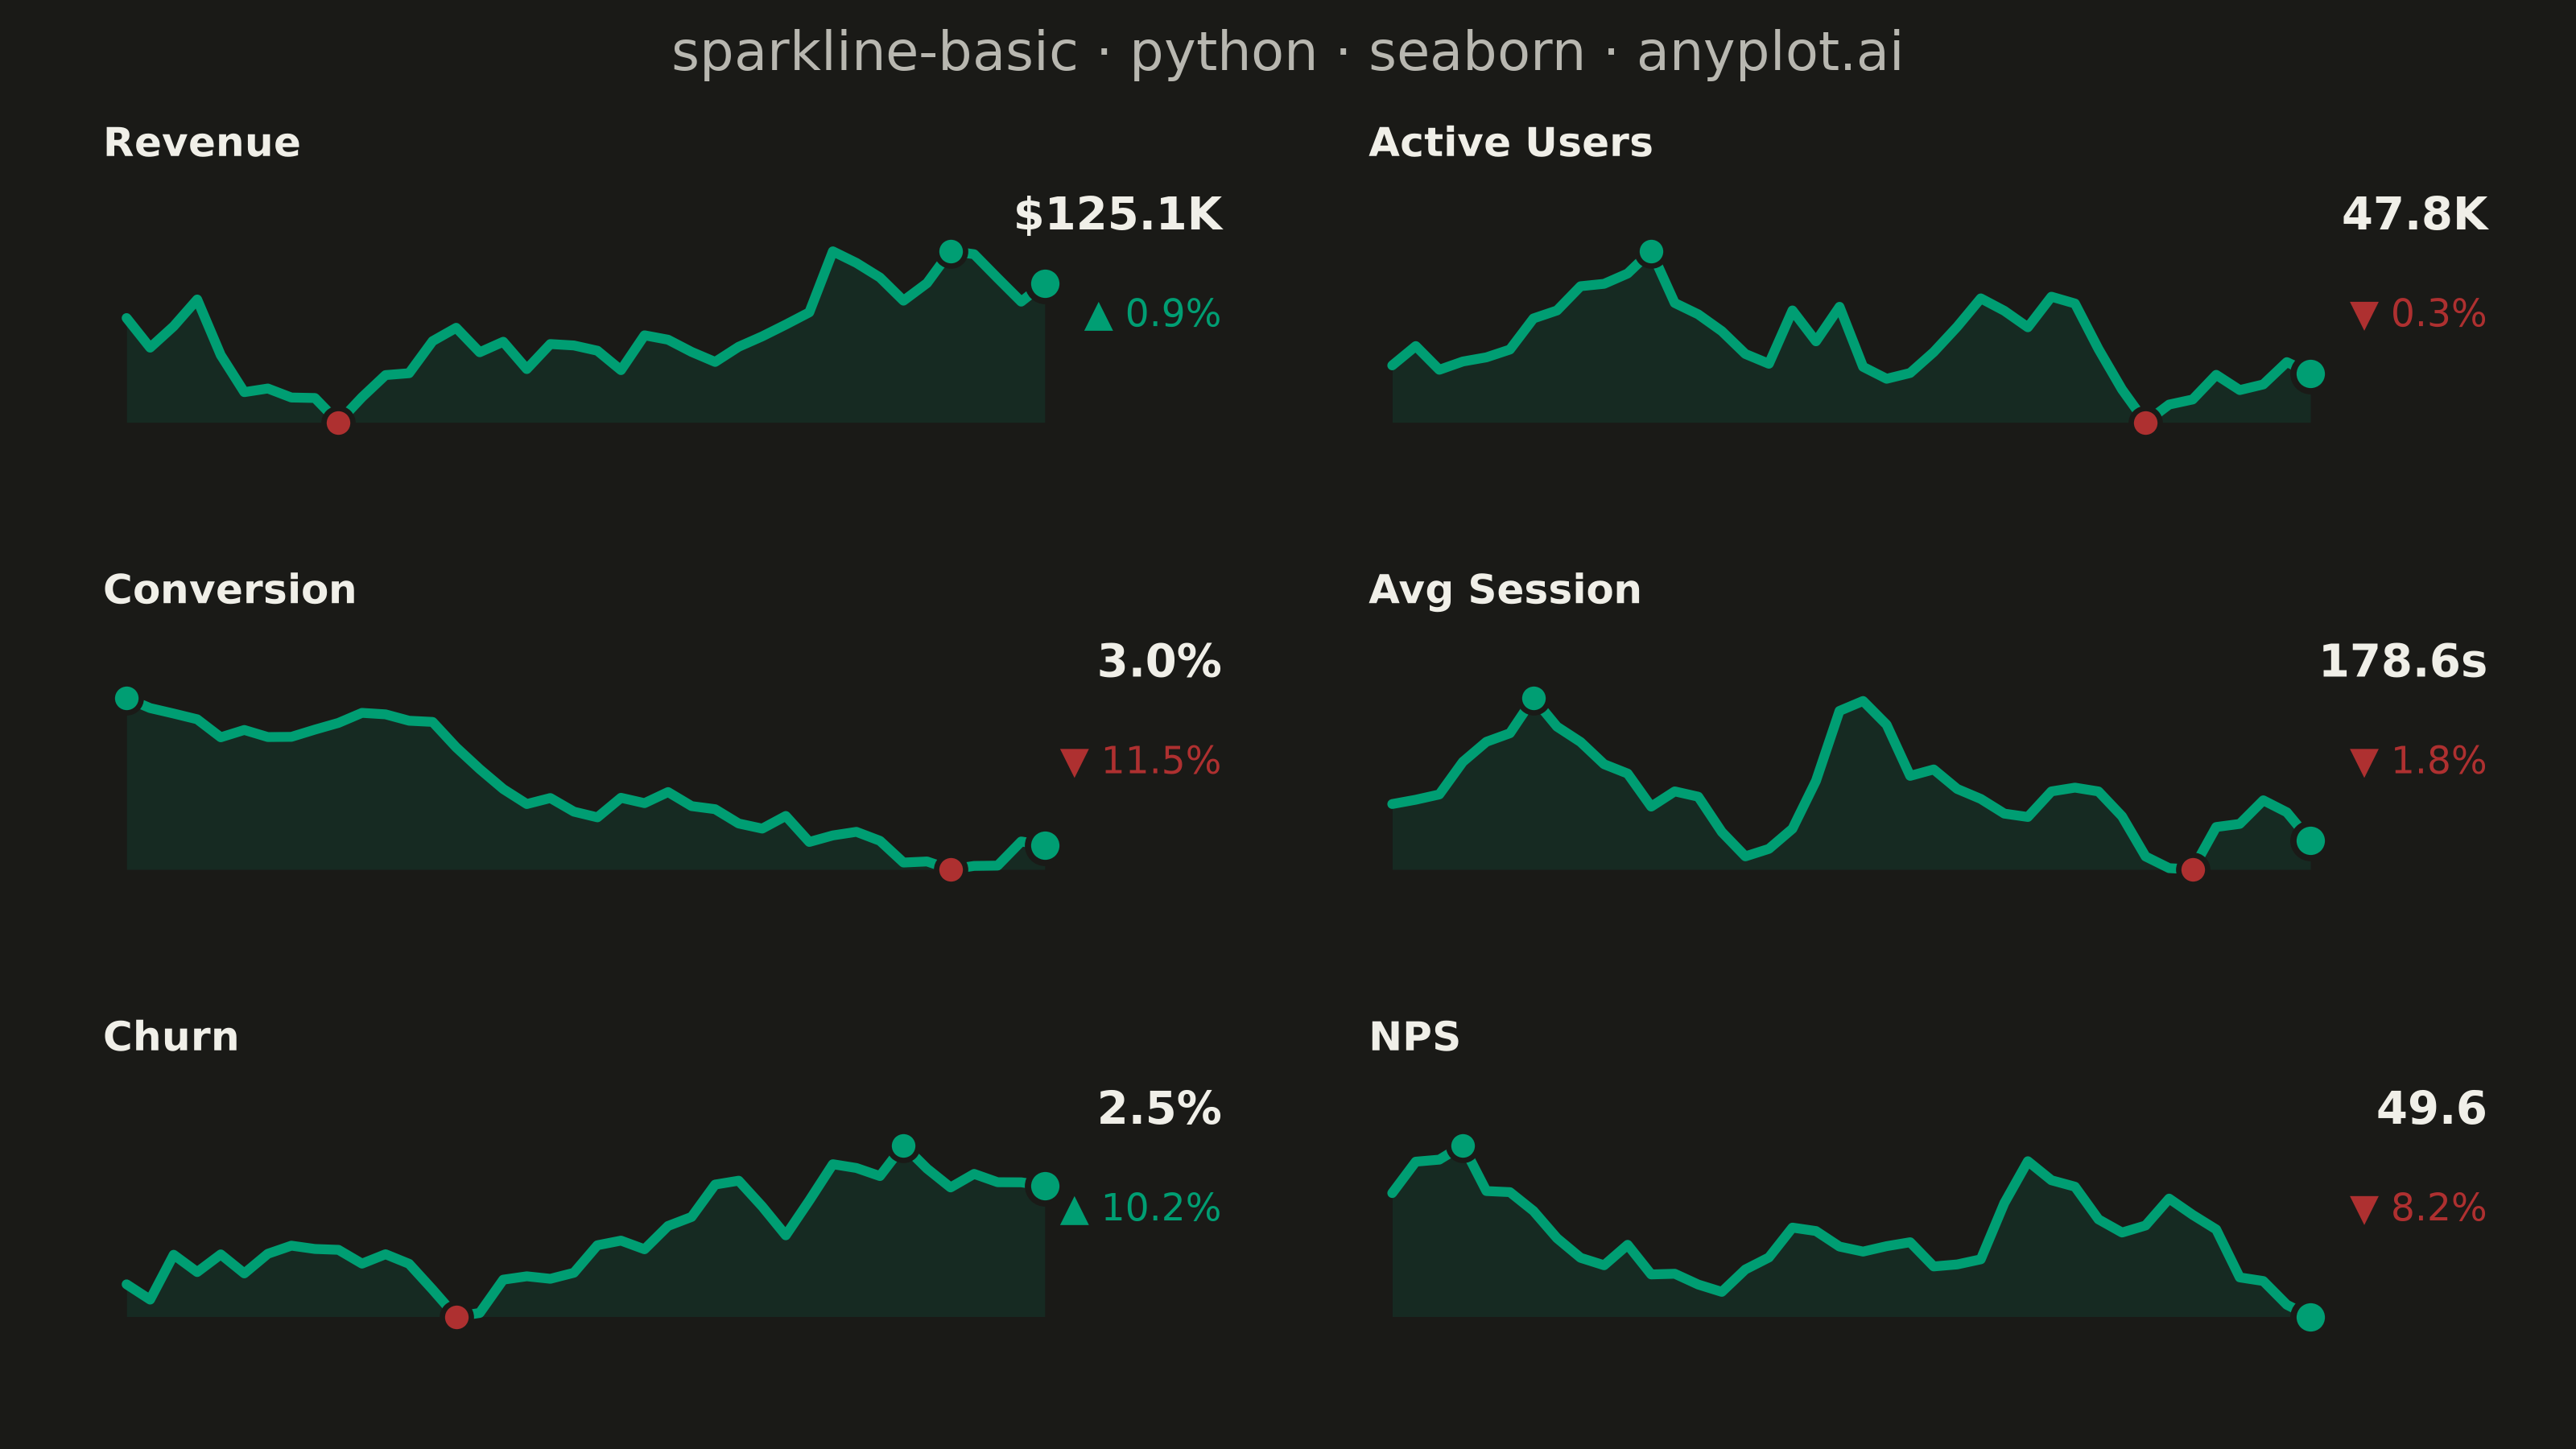
A sparkline is a small, condensed line chart designed to be embedded inline with text or in dashboard cells. It shows trends at a glance without axes, labels, or detailed scales - pure data visualization in minimal space. The defining characteristic is extreme minimalism: a single continuous line that conveys the shape of data without any chart chrome.
""" anyplot.ai
sparkline-basic: Basic Sparkline
Library: seaborn 0.13.2 | Python 3.13.13
Quality: 92/100 | Updated: 2026-06-16
"""

import os

import matplotlib.pyplot as plt
import numpy as np
import pandas as pd
import seaborn as sns


# Theme-adaptive chrome (Imprint palette) ---------------------------------
THEME = os.getenv("ANYPLOT_THEME", "light")
PAGE_BG = "#FAF8F1" if THEME == "light" else "#1A1A17"
INK = "#1A1A17" if THEME == "light" else "#F0EFE8"
INK_SOFT = "#4A4A44" if THEME == "light" else "#B8B7B0"

# Imprint palette — first series is ALWAYS brand green
BRAND = "#009E73"  # brand green — the sparkline line
LOW = "#AE3030"  # matte red — semantic anchor for the low point

# Data — daily readings for six dashboard KPIs ----------------------------
rng = np.random.default_rng(42)
metrics = [
    ("Revenue", "$", "K", 124.0, 0.9),
    ("Active Users", "", "K", 48.0, 0.7),
    ("Conversion", "", "%", 3.4, 0.04),
    ("Avg Session", "", "s", 182.0, 2.2),
    ("Churn", "", "%", 2.3, 0.05),
    ("NPS", "", "", 54.0, 0.8),
]
N_DAYS = 40
meta = {m[0]: m for m in metrics}
order = [m[0] for m in metrics]

records = []
for name, _prefix, _suffix, base, vol in metrics:
    walk = np.cumsum(rng.normal(0, vol, N_DAYS))
    y = base + walk - walk[0]
    for day, value in enumerate(y):
        records.append({"metric": name, "day": day, "value": value})
df = pd.DataFrame(records)

# Theme — strip every default chrome element; sparklines carry none --------
sns.set_theme(
    style="white",
    rc={"figure.facecolor": PAGE_BG, "axes.facecolor": PAGE_BG, "text.color": INK, "font.family": "sans-serif"},
)

# Idiomatic seaborn small-multiples: relplot builds the faceted grid -------
g = sns.relplot(
    data=df,
    x="day",
    y="value",
    col="metric",
    col_order=order,
    col_wrap=2,
    kind="line",
    color=BRAND,
    linewidth=2.2,
    height=1.5,
    aspect=2.6,
    facet_kws={"sharex": False, "sharey": False, "despine": True},
)
g.set_titles(col_template="")
g.set_axis_labels("", "")
g.figure.set_size_inches(8, 4.5)
g.figure.set_dpi(400)

# Per-facet sparkline detailing: area fill, focal dots, value + trend delta
for ax, name in zip(g.axes.flat, order, strict=True):
    prefix, suffix = meta[name][1], meta[name][2]
    sub = df[df["metric"] == name]
    x = sub["day"].to_numpy()
    y = sub["value"].to_numpy()

    ax.fill_between(x, y.min(), y, color=BRAND, alpha=0.12, linewidth=0)

    # Highlight min (red), max (brand green), and the current value
    i_min, i_max = int(np.argmin(y)), int(np.argmax(y))
    ax.scatter(i_min, y[i_min], color=LOW, s=42, zorder=5, edgecolors=PAGE_BG, linewidths=1.2)
    ax.scatter(i_max, y[i_max], color=BRAND, s=42, zorder=5, edgecolors=PAGE_BG, linewidths=1.2)
    ax.scatter(x[-1], y[-1], color=BRAND, s=60, zorder=6, edgecolors=PAGE_BG, linewidths=1.4)

    # Breathing room above/below the trace
    span = y.max() - y.min()
    ax.set_ylim(y.min() - span * 0.35, y.max() + span * 0.45)
    ax.set_xlim(-1, N_DAYS + 7)

    # Metric label (top-left) — the only text chrome a sparkline keeps
    ax.set_title(name, loc="left", fontsize=9, fontweight="bold", color=INK, pad=4)

    # Current value + trend delta vs. start (arrow makes direction explicit)
    last = y[-1]
    delta = (last - y[0]) / y[0] * 100
    arrow, dcolor = ("▲", BRAND) if delta >= 0 else ("▼", LOW)
    ax.text(
        0.99,
        0.93,
        f"{prefix}{last:,.1f}{suffix}",
        transform=ax.transAxes,
        ha="right",
        va="top",
        fontsize=10,
        fontweight="bold",
        color=INK,
    )
    ax.text(
        0.99,
        0.60,
        f"{arrow} {abs(delta):.1f}%",
        transform=ax.transAxes,
        ha="right",
        va="top",
        fontsize=8.5,
        color=dcolor,
    )

    # Pure sparkline: remove all remaining axes chrome
    ax.set_xticks([])
    ax.set_yticks([])
    for spine in ax.spines.values():
        spine.set_visible(False)

g.figure.suptitle("sparkline-basic · python · seaborn · anyplot.ai", fontsize=12, fontweight="medium", color=INK_SOFT)
g.figure.subplots_adjust(left=0.04, right=0.97, top=0.88, bottom=0.05, hspace=0.45, wspace=0.12)

plt.savefig(f"plot-{THEME}.png", dpi=400, facecolor=PAGE_BG)
Runnable source as JSON, for any HTTP client: https://api.anyplot.ai/specs/sparkline-basic/seaborn/code. Any spec id and library id listed in llms-full.txt fit the same URL shape; every URL below is complete and callable.
{
  "spec_id": "sparkline-basic",
  "language": "python",
  "library": "seaborn",
  "page": "https://anyplot.ai/sparkline-basic/python/seaborn",
  "hub": "https://anyplot.ai/sparkline-basic",
  "code_json": "https://api.anyplot.ai/specs/sparkline-basic/seaborn/code",
  "spec_json": "https://api.anyplot.ai/specs/sparkline-basic",
  "render_light_png": "https://storage.googleapis.com/anyplot-images/plots/sparkline-basic/python/seaborn/plot-light.png",
  "render_dark_png": "https://storage.googleapis.com/anyplot-images/plots/sparkline-basic/python/seaborn/plot-dark.png",
  "quality_score": 92.0,
  "license": "MIT",
  "guide": "https://anyplot.ai/llms.txt"
}
Part of Basic Sparkline on anyplot.ai.