The same plot in 14 other libraries — Python: Altair, Bokeh, lets-plot, Matplotlib, Plotly, plotnine, Pygal, Seaborn; Julia: Makie.jl; JavaScript: Chart.js, D3.js, Apache ECharts, Highcharts, MUI X Charts. Compare all 15 side by side: Basic Sparkline in Python, R, Julia and JavaScript.
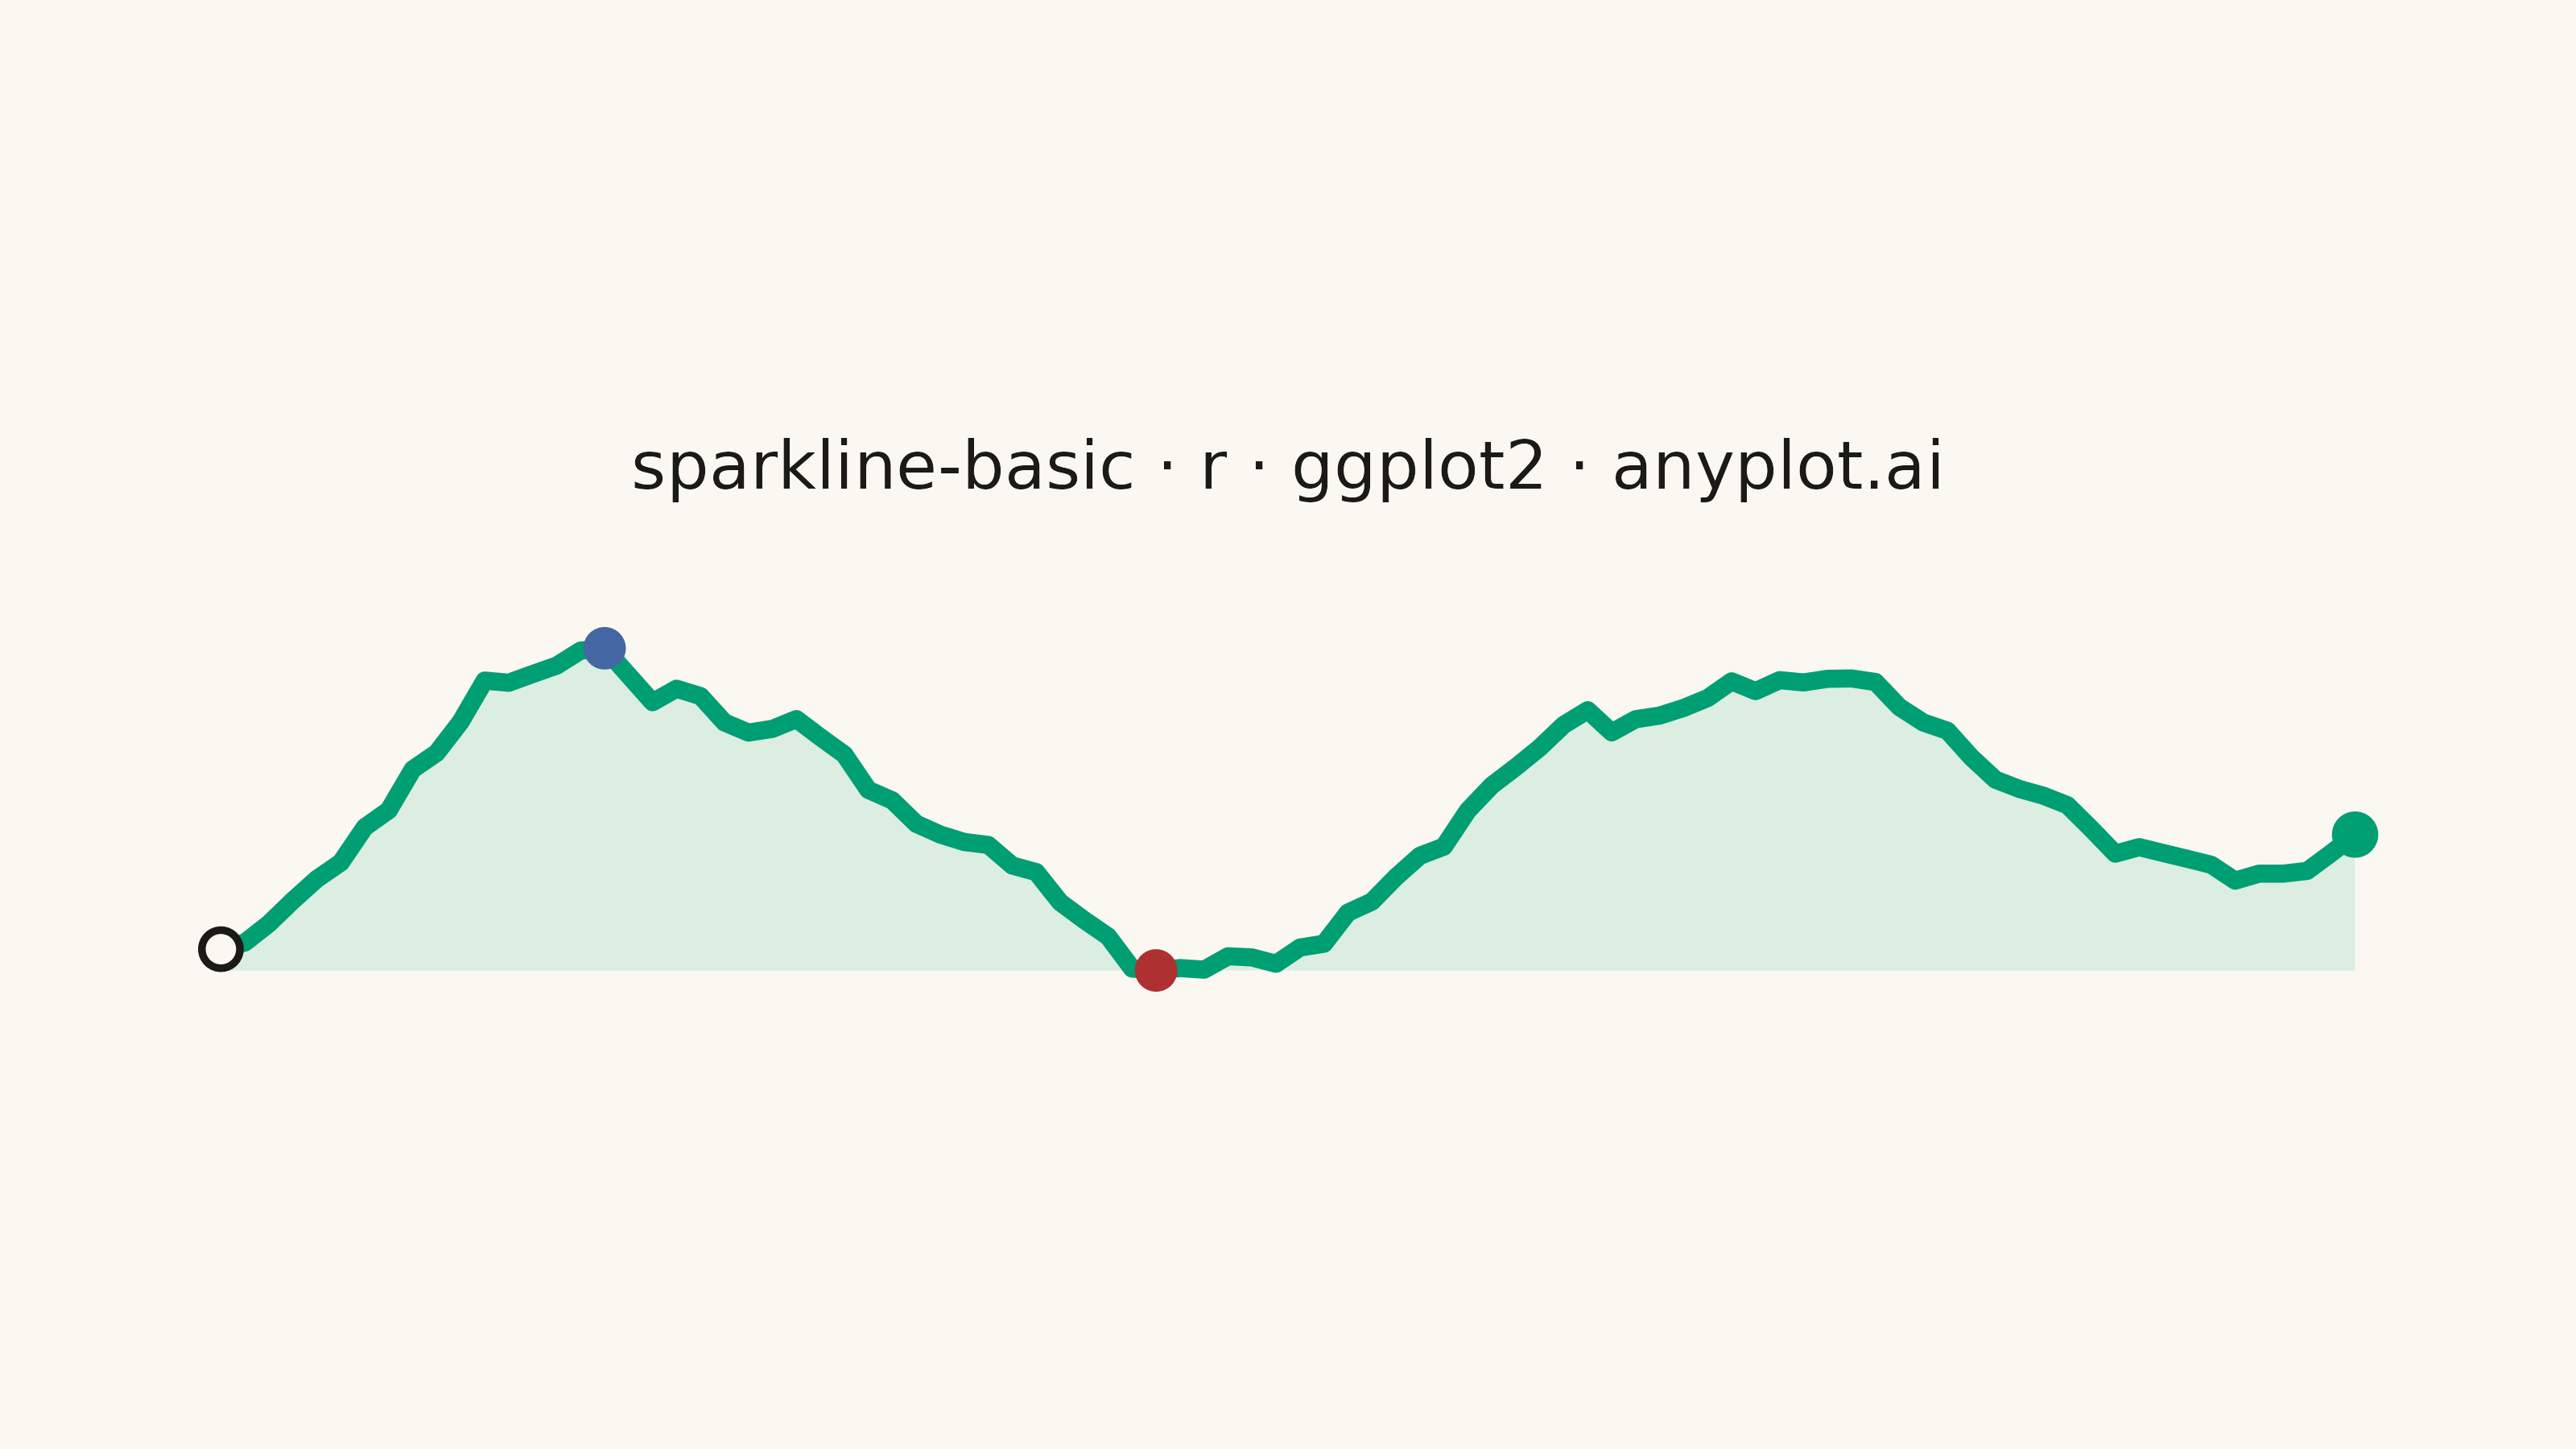
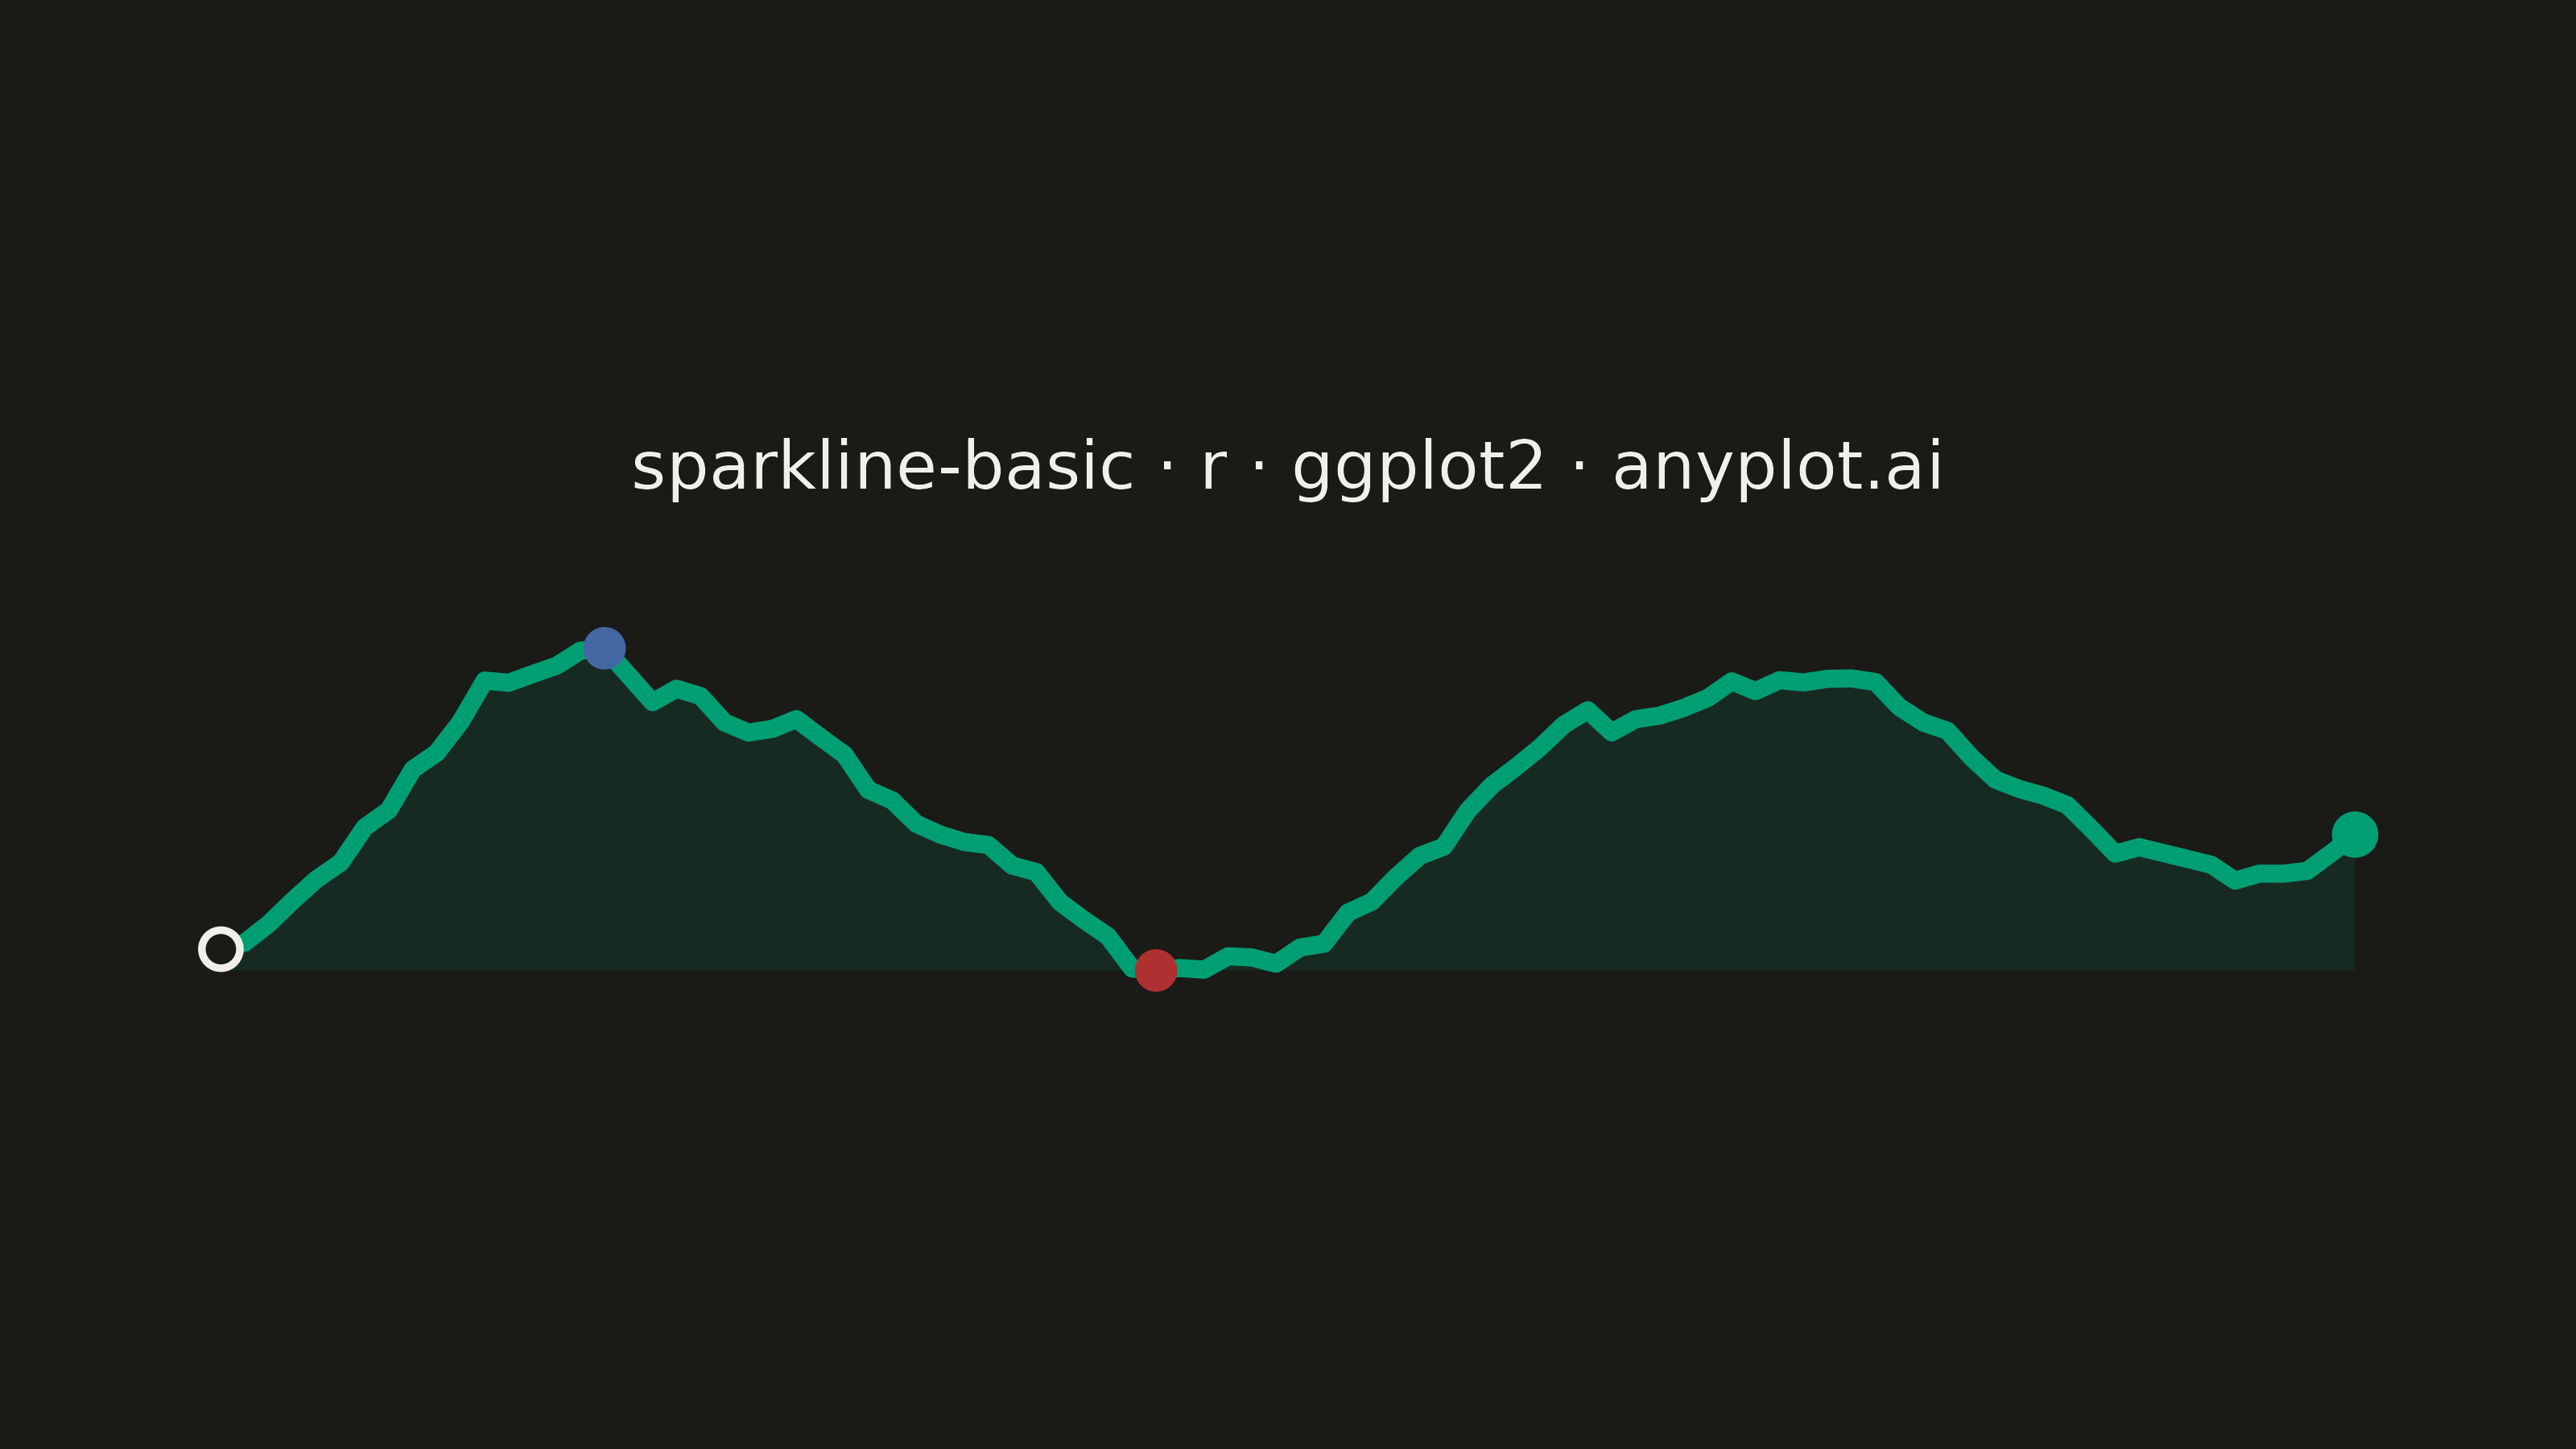
A sparkline is a small, condensed line chart designed to be embedded inline with text or in dashboard cells. It shows trends at a glance without axes, axis labels, or detailed scales - pure data visualization in minimal space. The defining characteristic is extreme minimalism: a single continuous line that conveys the shape of data without any chart chrome.
#' anyplot.ai
#' sparkline-basic: Basic Sparkline
#' Library: ggplot2 3.5.1 | R 4.4.1
#' Quality: 87/100 | Created: 2026-09-09

library(ggplot2)
library(ragg)

set.seed(42)

# --- Theme tokens ------------------------------------------------------------
THEME <- Sys.getenv("ANYPLOT_THEME", "light")
PAGE_BG <- if (THEME == "light") "#FAF8F1" else "#1A1A17"
INK <- if (THEME == "light") "#1A1A17" else "#F0EFE8"

# Imprint palette (see prompts/default-style-guide.md "Categorical Palette")
BRAND <- "#009E73" # position 1 — the trend line, ALWAYS first series
LOW_MARK <- "#AE3030" # position 5 — series minimum
HIGH_MARK <- "#4467A3" # position 3 — series maximum

# --- Data ---------------------------------------------------------------------
# Single stock's closing price over one trading quarter — the sparkline
# convention of embedding a trend inline (financial table cell) without any
# axes, ticks, or gridlines.
n_points <- 90
day <- 1:n_points
closing_price <- 142 + 14 * sin(2 * pi * day / 45 - 1) + cumsum(rnorm(n_points, mean = 0.12, sd = 1.3))

trend <- data.frame(day = day, closing_price = closing_price)
i_min <- which.min(closing_price)
i_max <- which.max(closing_price)
i_first <- 1
i_last <- n_points

# --- Plot -----------------------------------------------------------------
# geom_ribbon fills the area under the line for the classic sparkline look;
# geom_point marks the series extremes, the starting point, and the latest
# value — the only highlights the spec allows before it stops being "basic".
# Narrow side margins let the mark span nearly the full canvas width, and
# aspect.ratio ~0.18 keeps the panel a compact 5-6:1 band while still filling
# a healthy share of the fixed 3200x1800 canvas height.
p <- ggplot(trend, aes(x = day, y = closing_price)) +
  geom_ribbon(aes(ymin = min(closing_price), ymax = closing_price), fill = BRAND, alpha = 0.12) +
  geom_line(color = BRAND, linewidth = 1.9, lineend = "round") +
  geom_point(data = trend[i_first, ], shape = 21, color = INK, fill = PAGE_BG, size = 3.2, stroke = 1.2) +
  geom_point(data = trend[i_min, ], color = LOW_MARK, size = 3.8) +
  geom_point(data = trend[i_max, ], color = HIGH_MARK, size = 3.8) +
  geom_point(data = trend[i_last, ], color = BRAND, size = 4.2) +
  scale_x_continuous(expand = expansion(mult = c(0.02, 0.02))) +
  scale_y_continuous(expand = expansion(mult = c(0.12, 0.12))) +
  labs(title = "sparkline-basic · r · ggplot2 · anyplot.ai") +
  theme_void(base_size = 8) +
  theme(
    aspect.ratio = 0.18, # compact ~5.5:1 band — the sparkline's defining shape
    plot.background = element_rect(fill = PAGE_BG, color = PAGE_BG),
    panel.background = element_rect(fill = PAGE_BG, color = NA),
    plot.title = element_text(color = INK, size = 15, hjust = 0.5, margin = margin(b = 24)),
    plot.margin = margin(t = 30, r = 40, b = 30, l = 40)
  )

# --- Save -------------------------------------------------------------------
ggsave(
  filename = sprintf("plot-%s.png", THEME),
  plot = p,
  device = ragg::agg_png,
  width = 8,
  height = 4.5,
  units = "in",
  dpi = 400
)
Runnable source as JSON, for any HTTP client: https://api.anyplot.ai/specs/sparkline-basic/ggplot2/code. Any spec id and library id listed in llms-full.txt fit the same URL shape; every URL below is complete and callable.
{
  "spec_id": "sparkline-basic",
  "language": "r",
  "library": "ggplot2",
  "page": "https://anyplot.ai/sparkline-basic/r/ggplot2",
  "hub": "https://anyplot.ai/sparkline-basic",
  "code_json": "https://api.anyplot.ai/specs/sparkline-basic/ggplot2/code",
  "spec_json": "https://api.anyplot.ai/specs/sparkline-basic",
  "render_light_png": "https://storage.googleapis.com/anyplot-images/plots/sparkline-basic/r/ggplot2/plot-light.png",
  "render_dark_png": "https://storage.googleapis.com/anyplot-images/plots/sparkline-basic/r/ggplot2/plot-dark.png",
  "quality_score": 87.0,
  "license": "MIT",
  "guide": "https://anyplot.ai/llms.txt"
}
Part of Basic Sparkline on anyplot.ai.