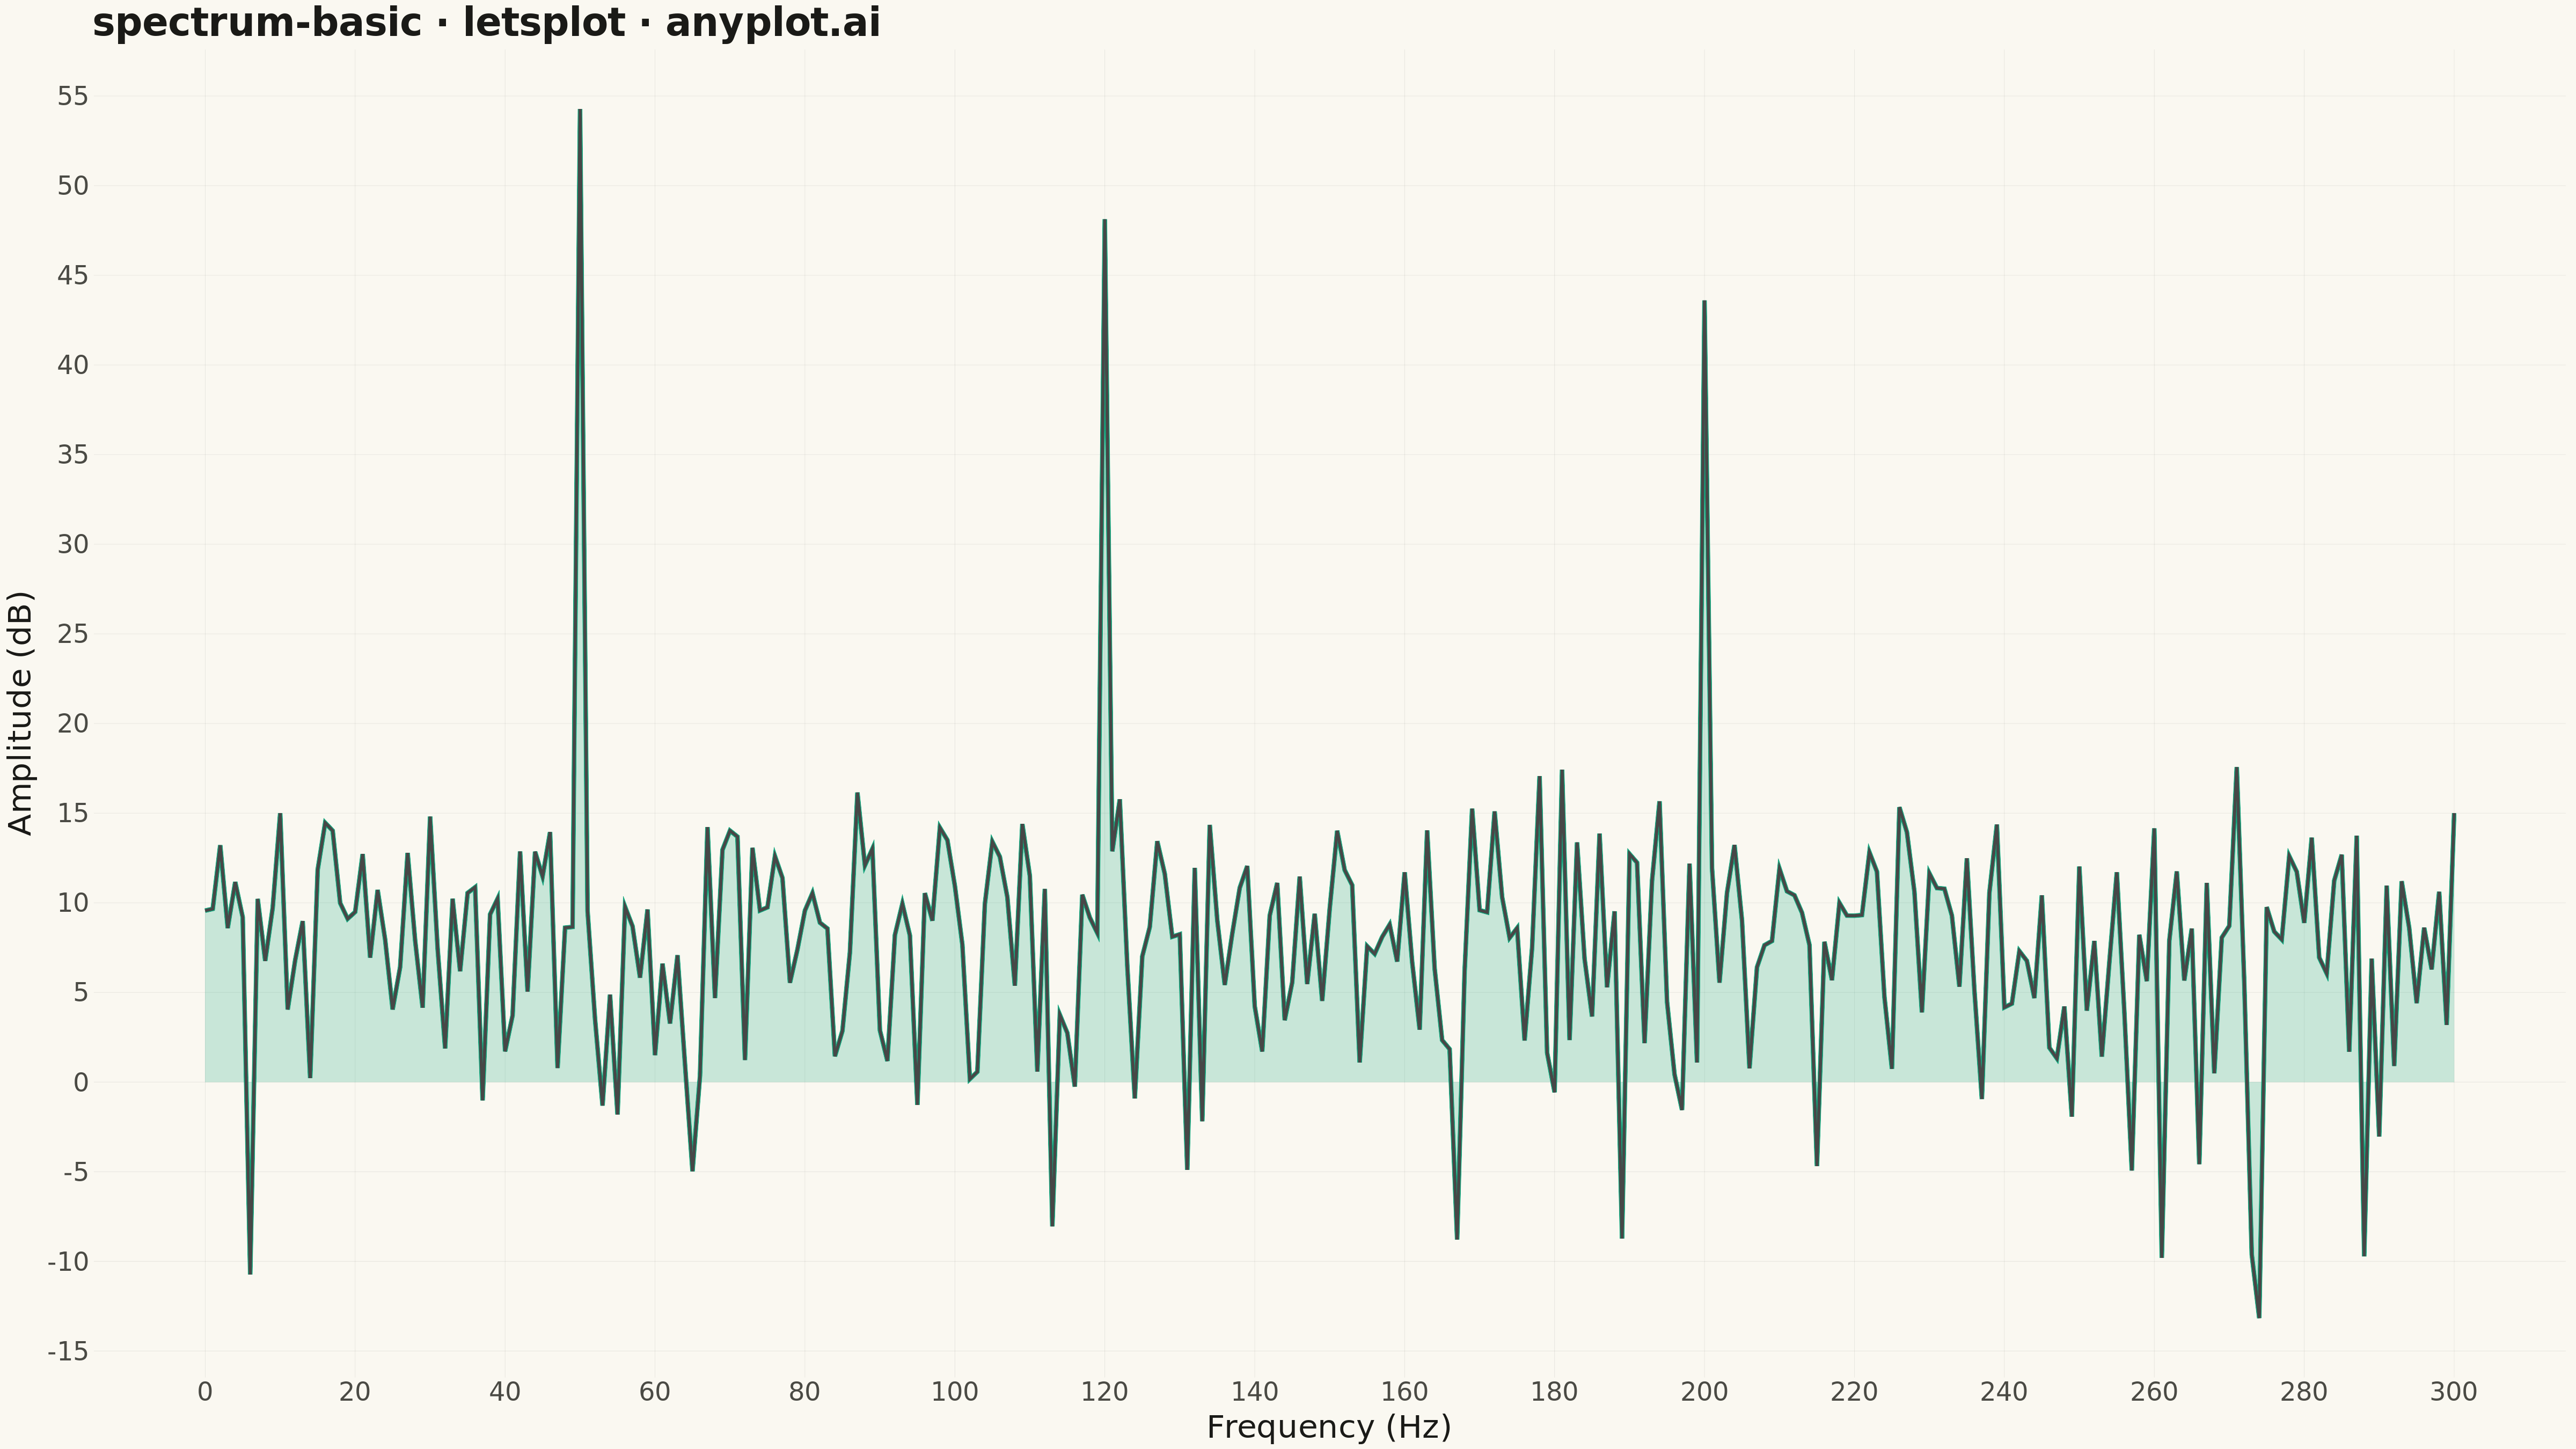
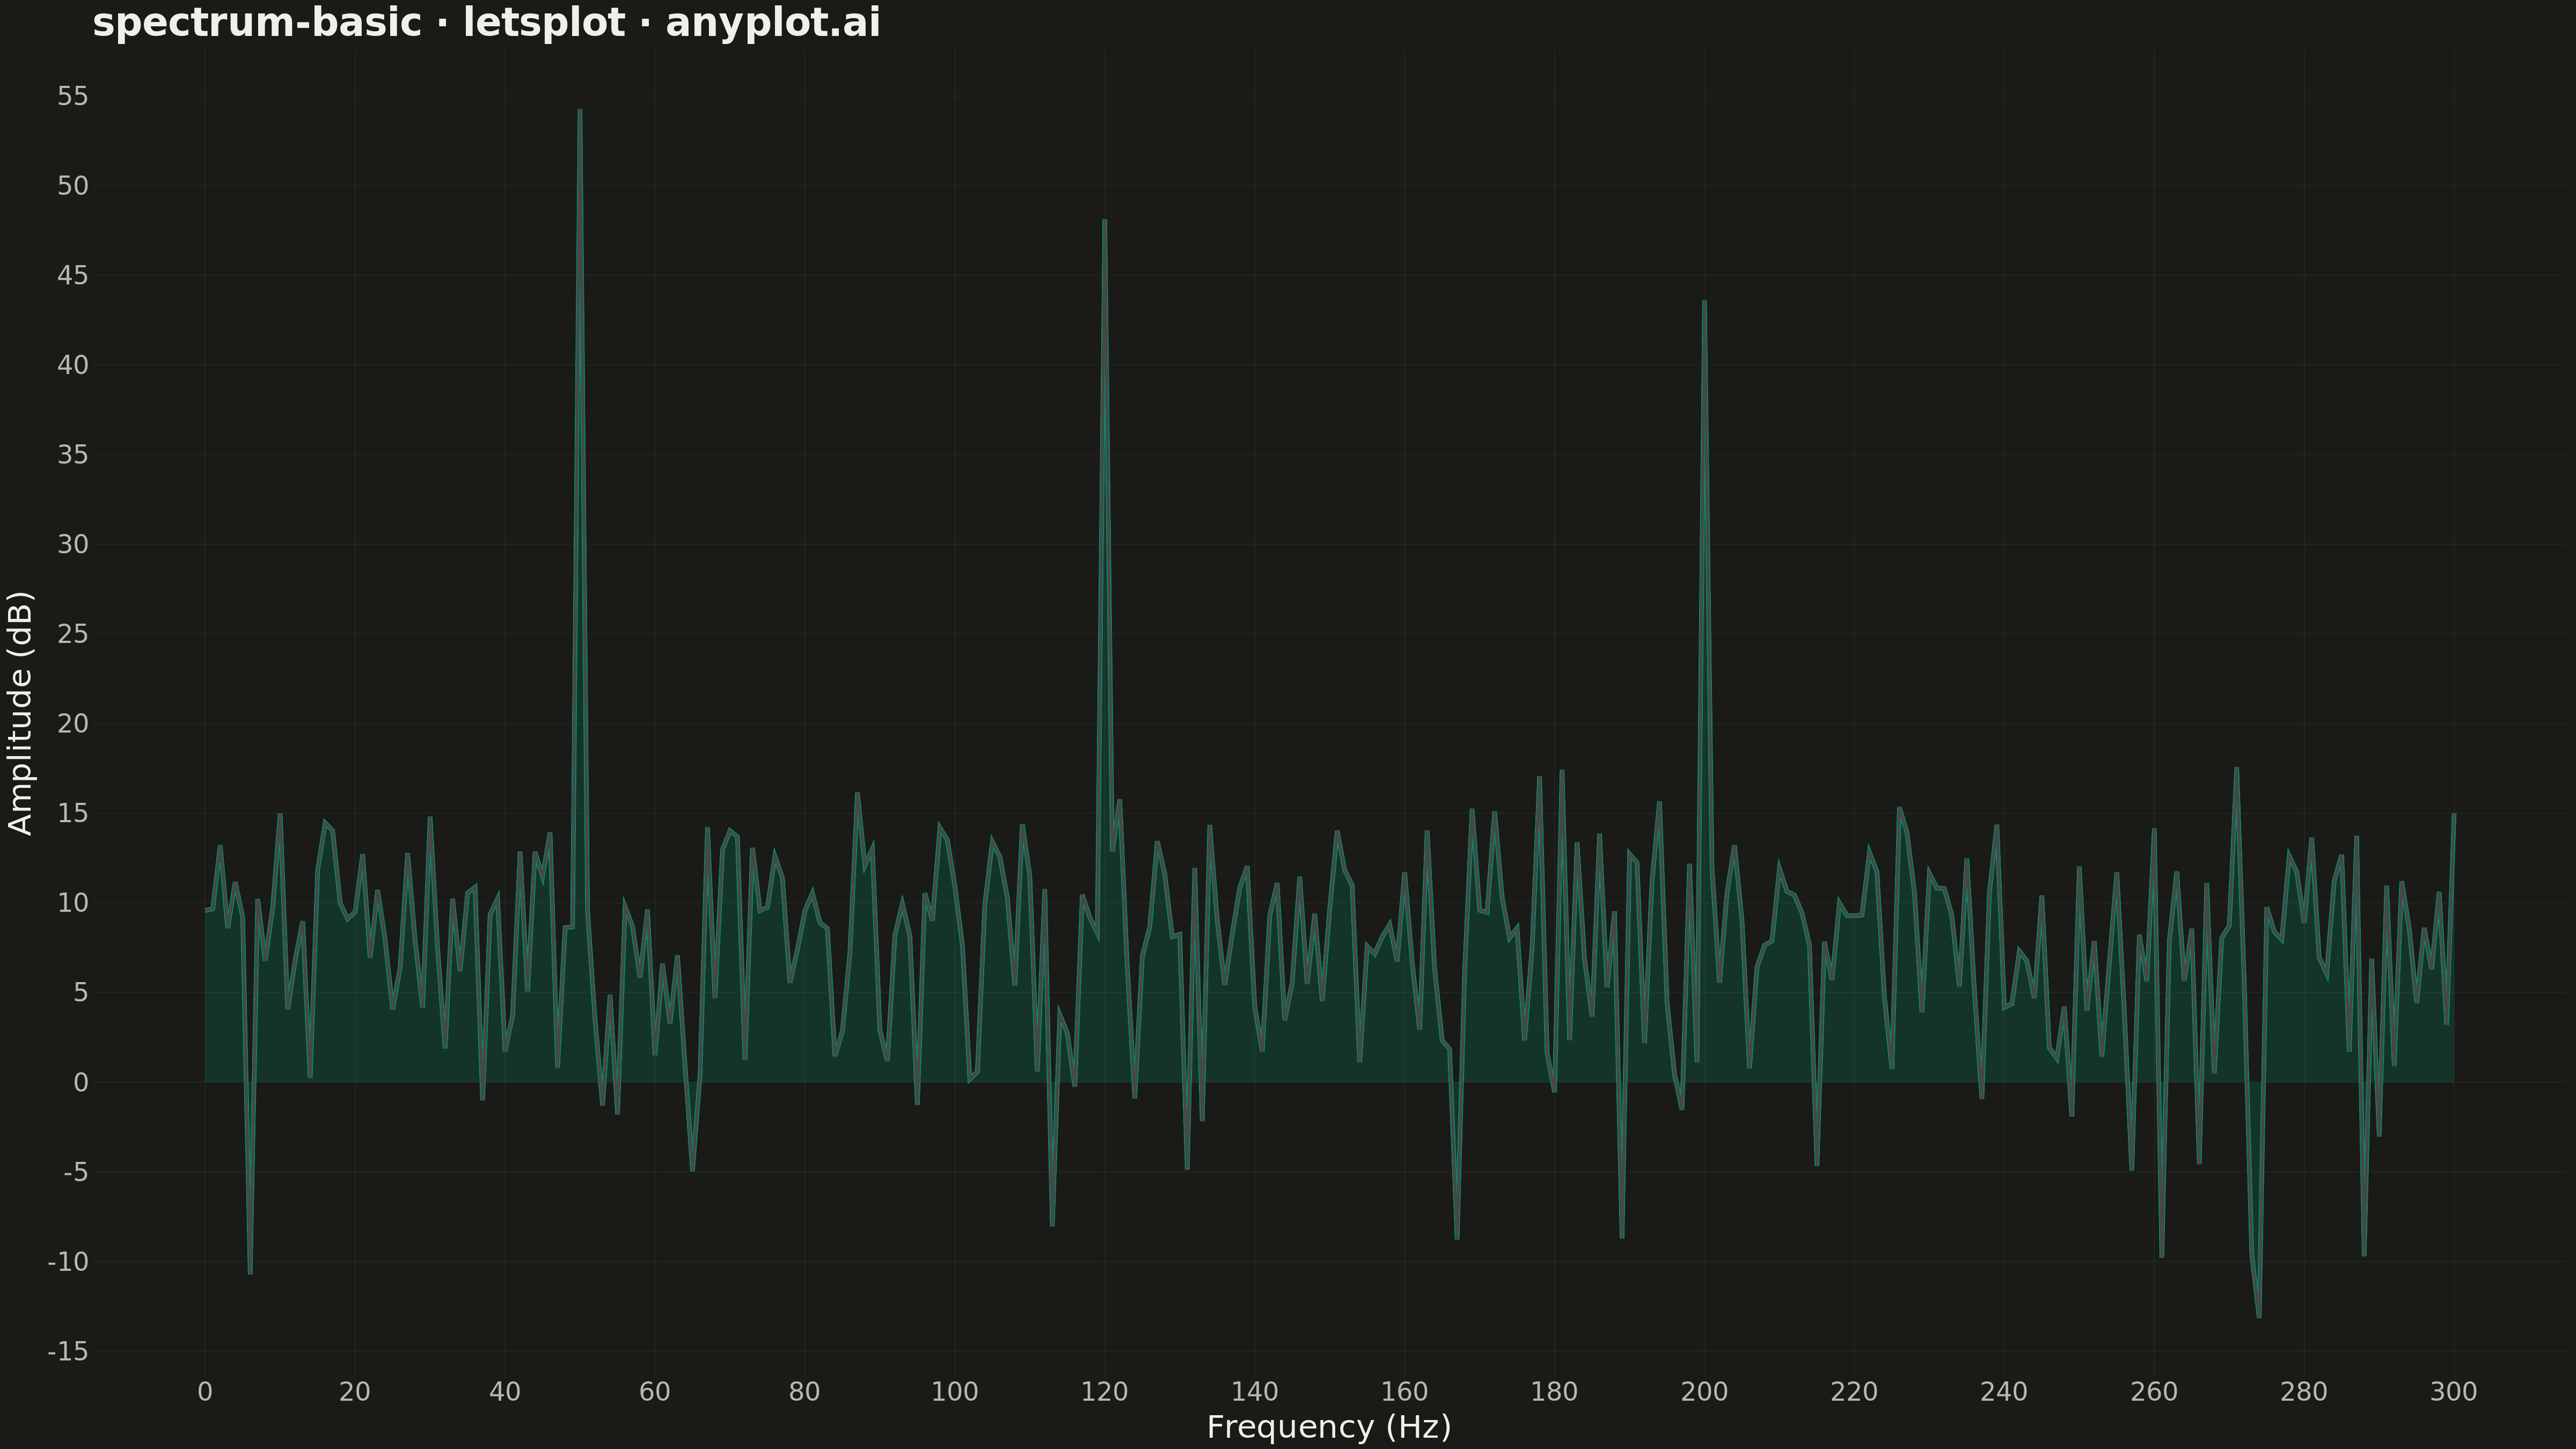
A frequency spectrum plot displays signal amplitude or power across a range of frequencies, showing the frequency domain representation of time-series data. This visualization reveals the frequency components present in a signal, making it essential for identifying dominant frequencies, harmonics, and noise characteristics. It is fundamental in signal processing, audio engineering, and vibration analysis.
Preview render from the lets-plot implementation.