The same plot in 14 other libraries — JavaScript: D3.js, Apache ECharts, Highcharts, MUI X Charts; Python: Altair, Bokeh, lets-plot, Matplotlib, Plotly, plotnine, Pygal, Seaborn; R: ggplot2; Julia: Makie.jl. Compare all 15 side by side: Frequency Spectrum Plot in Python, R, Julia and JavaScript.
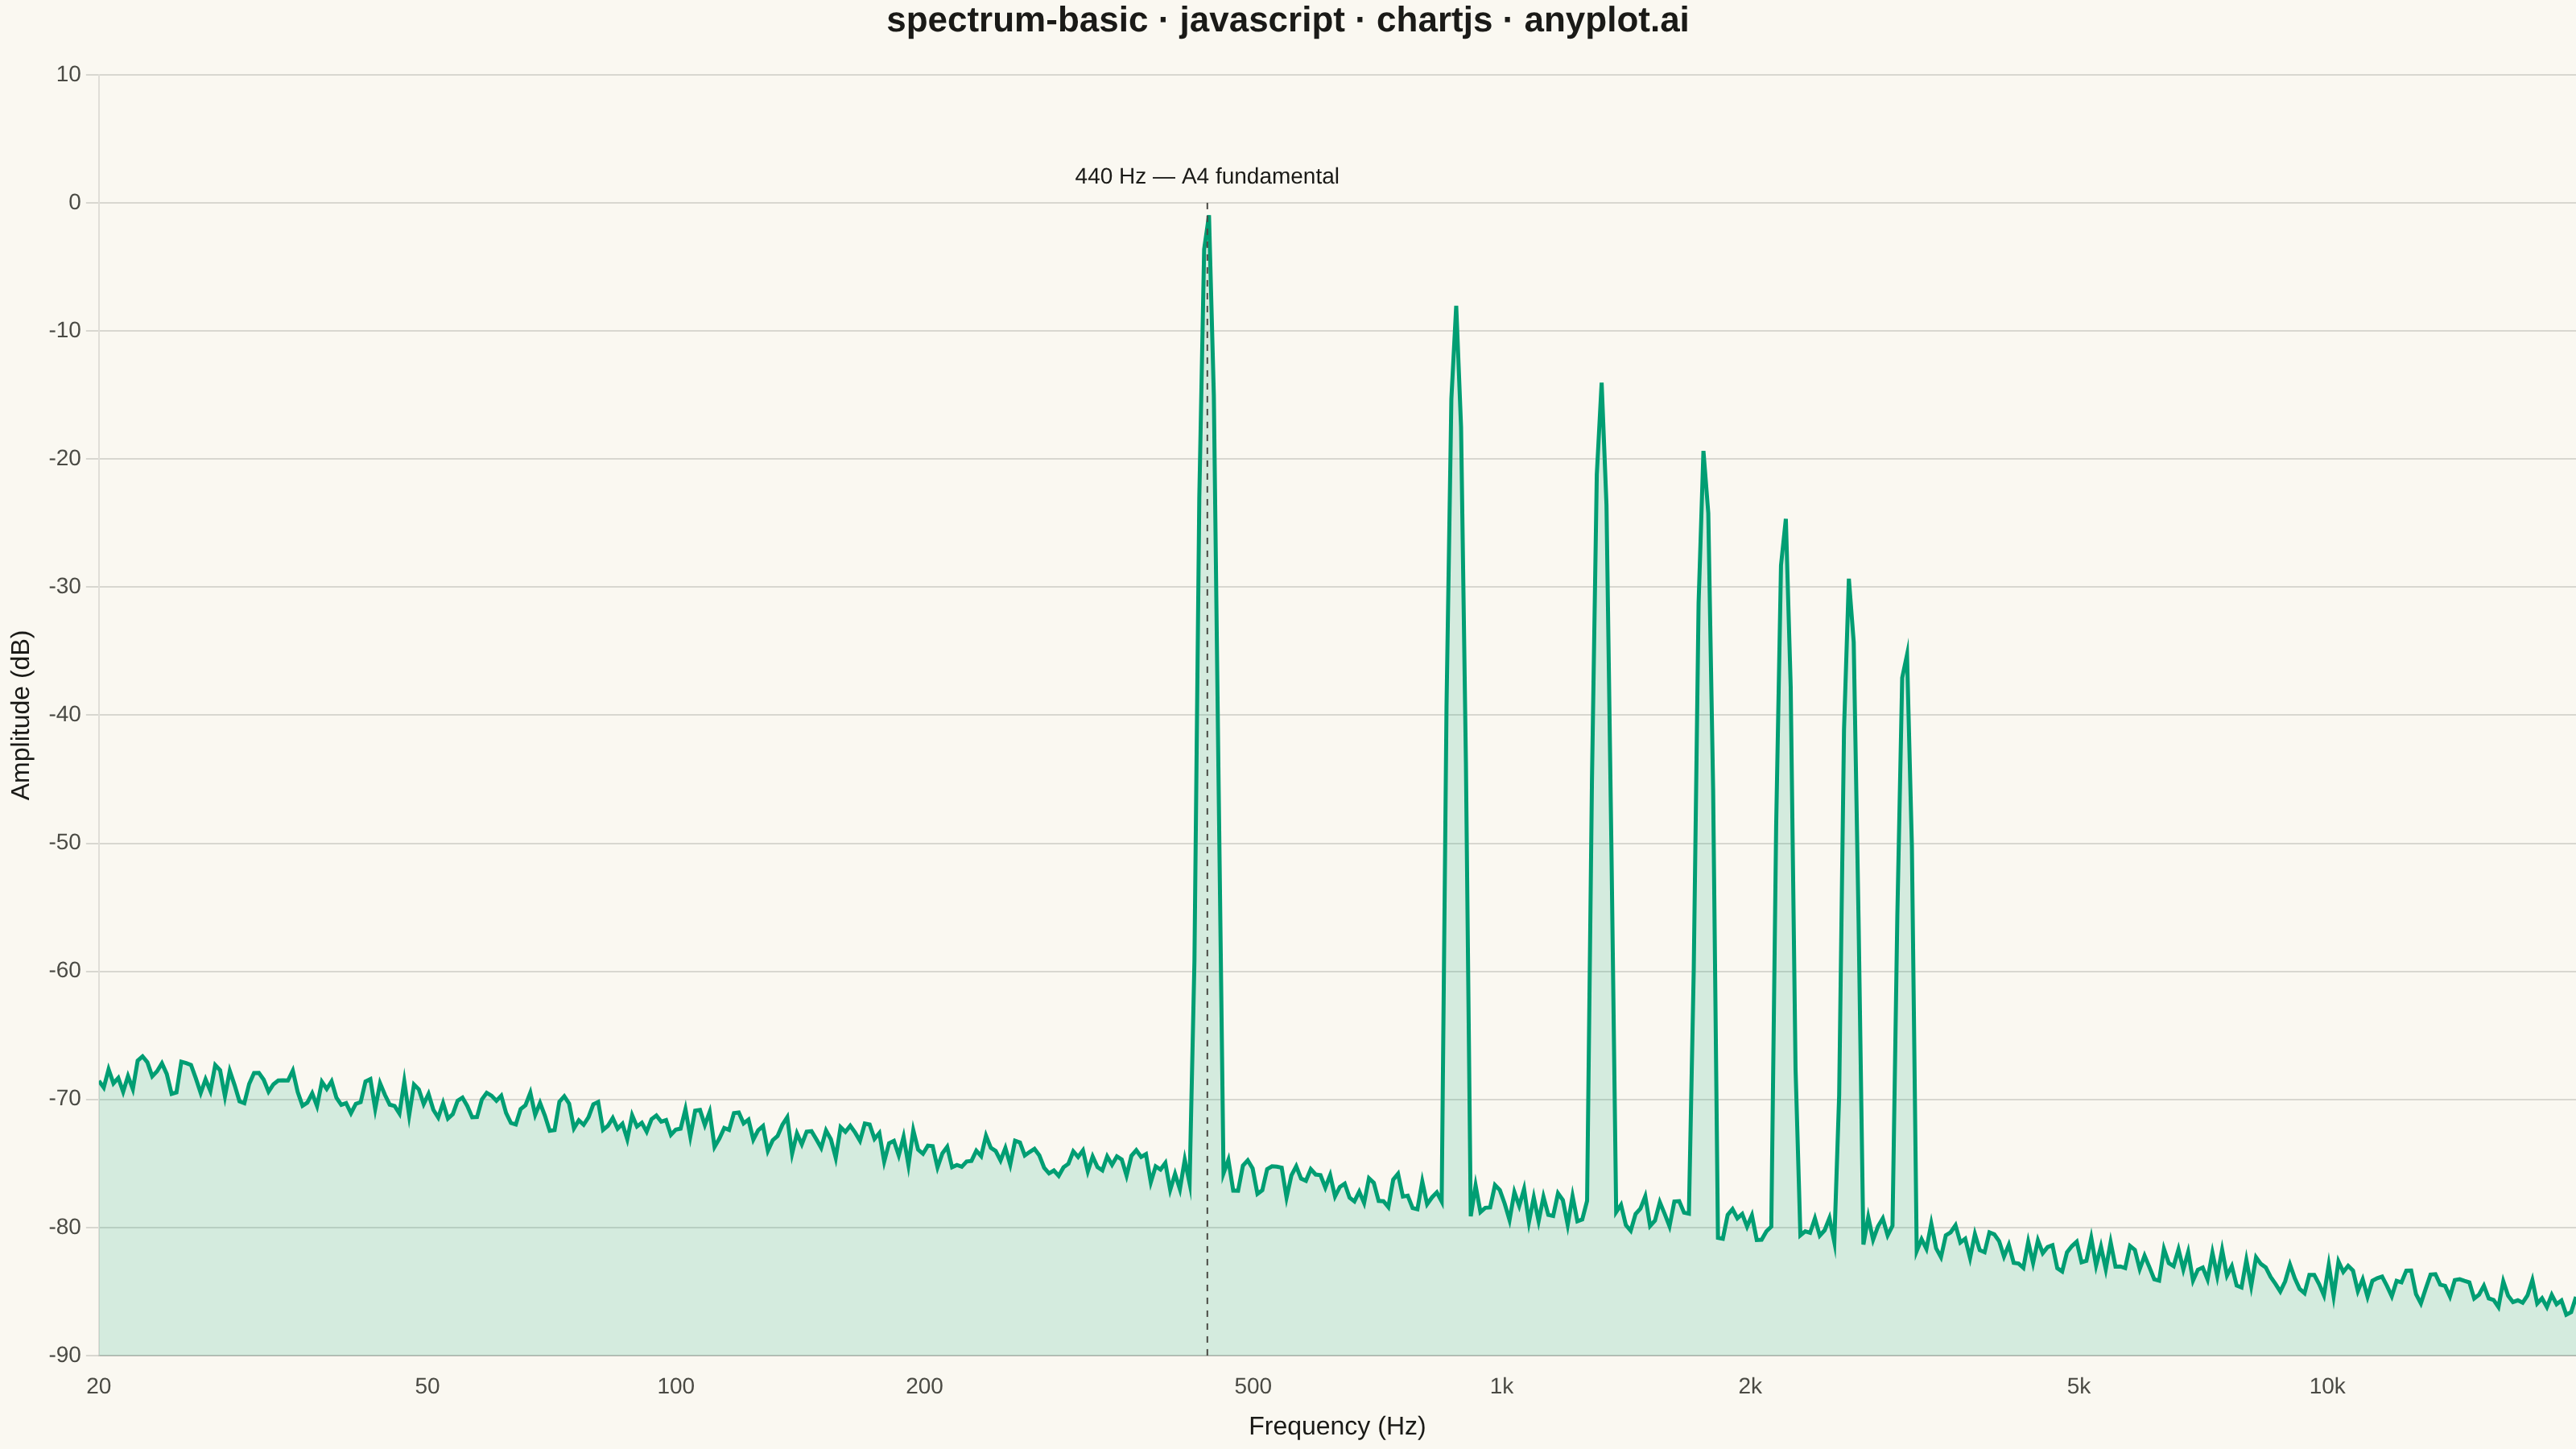
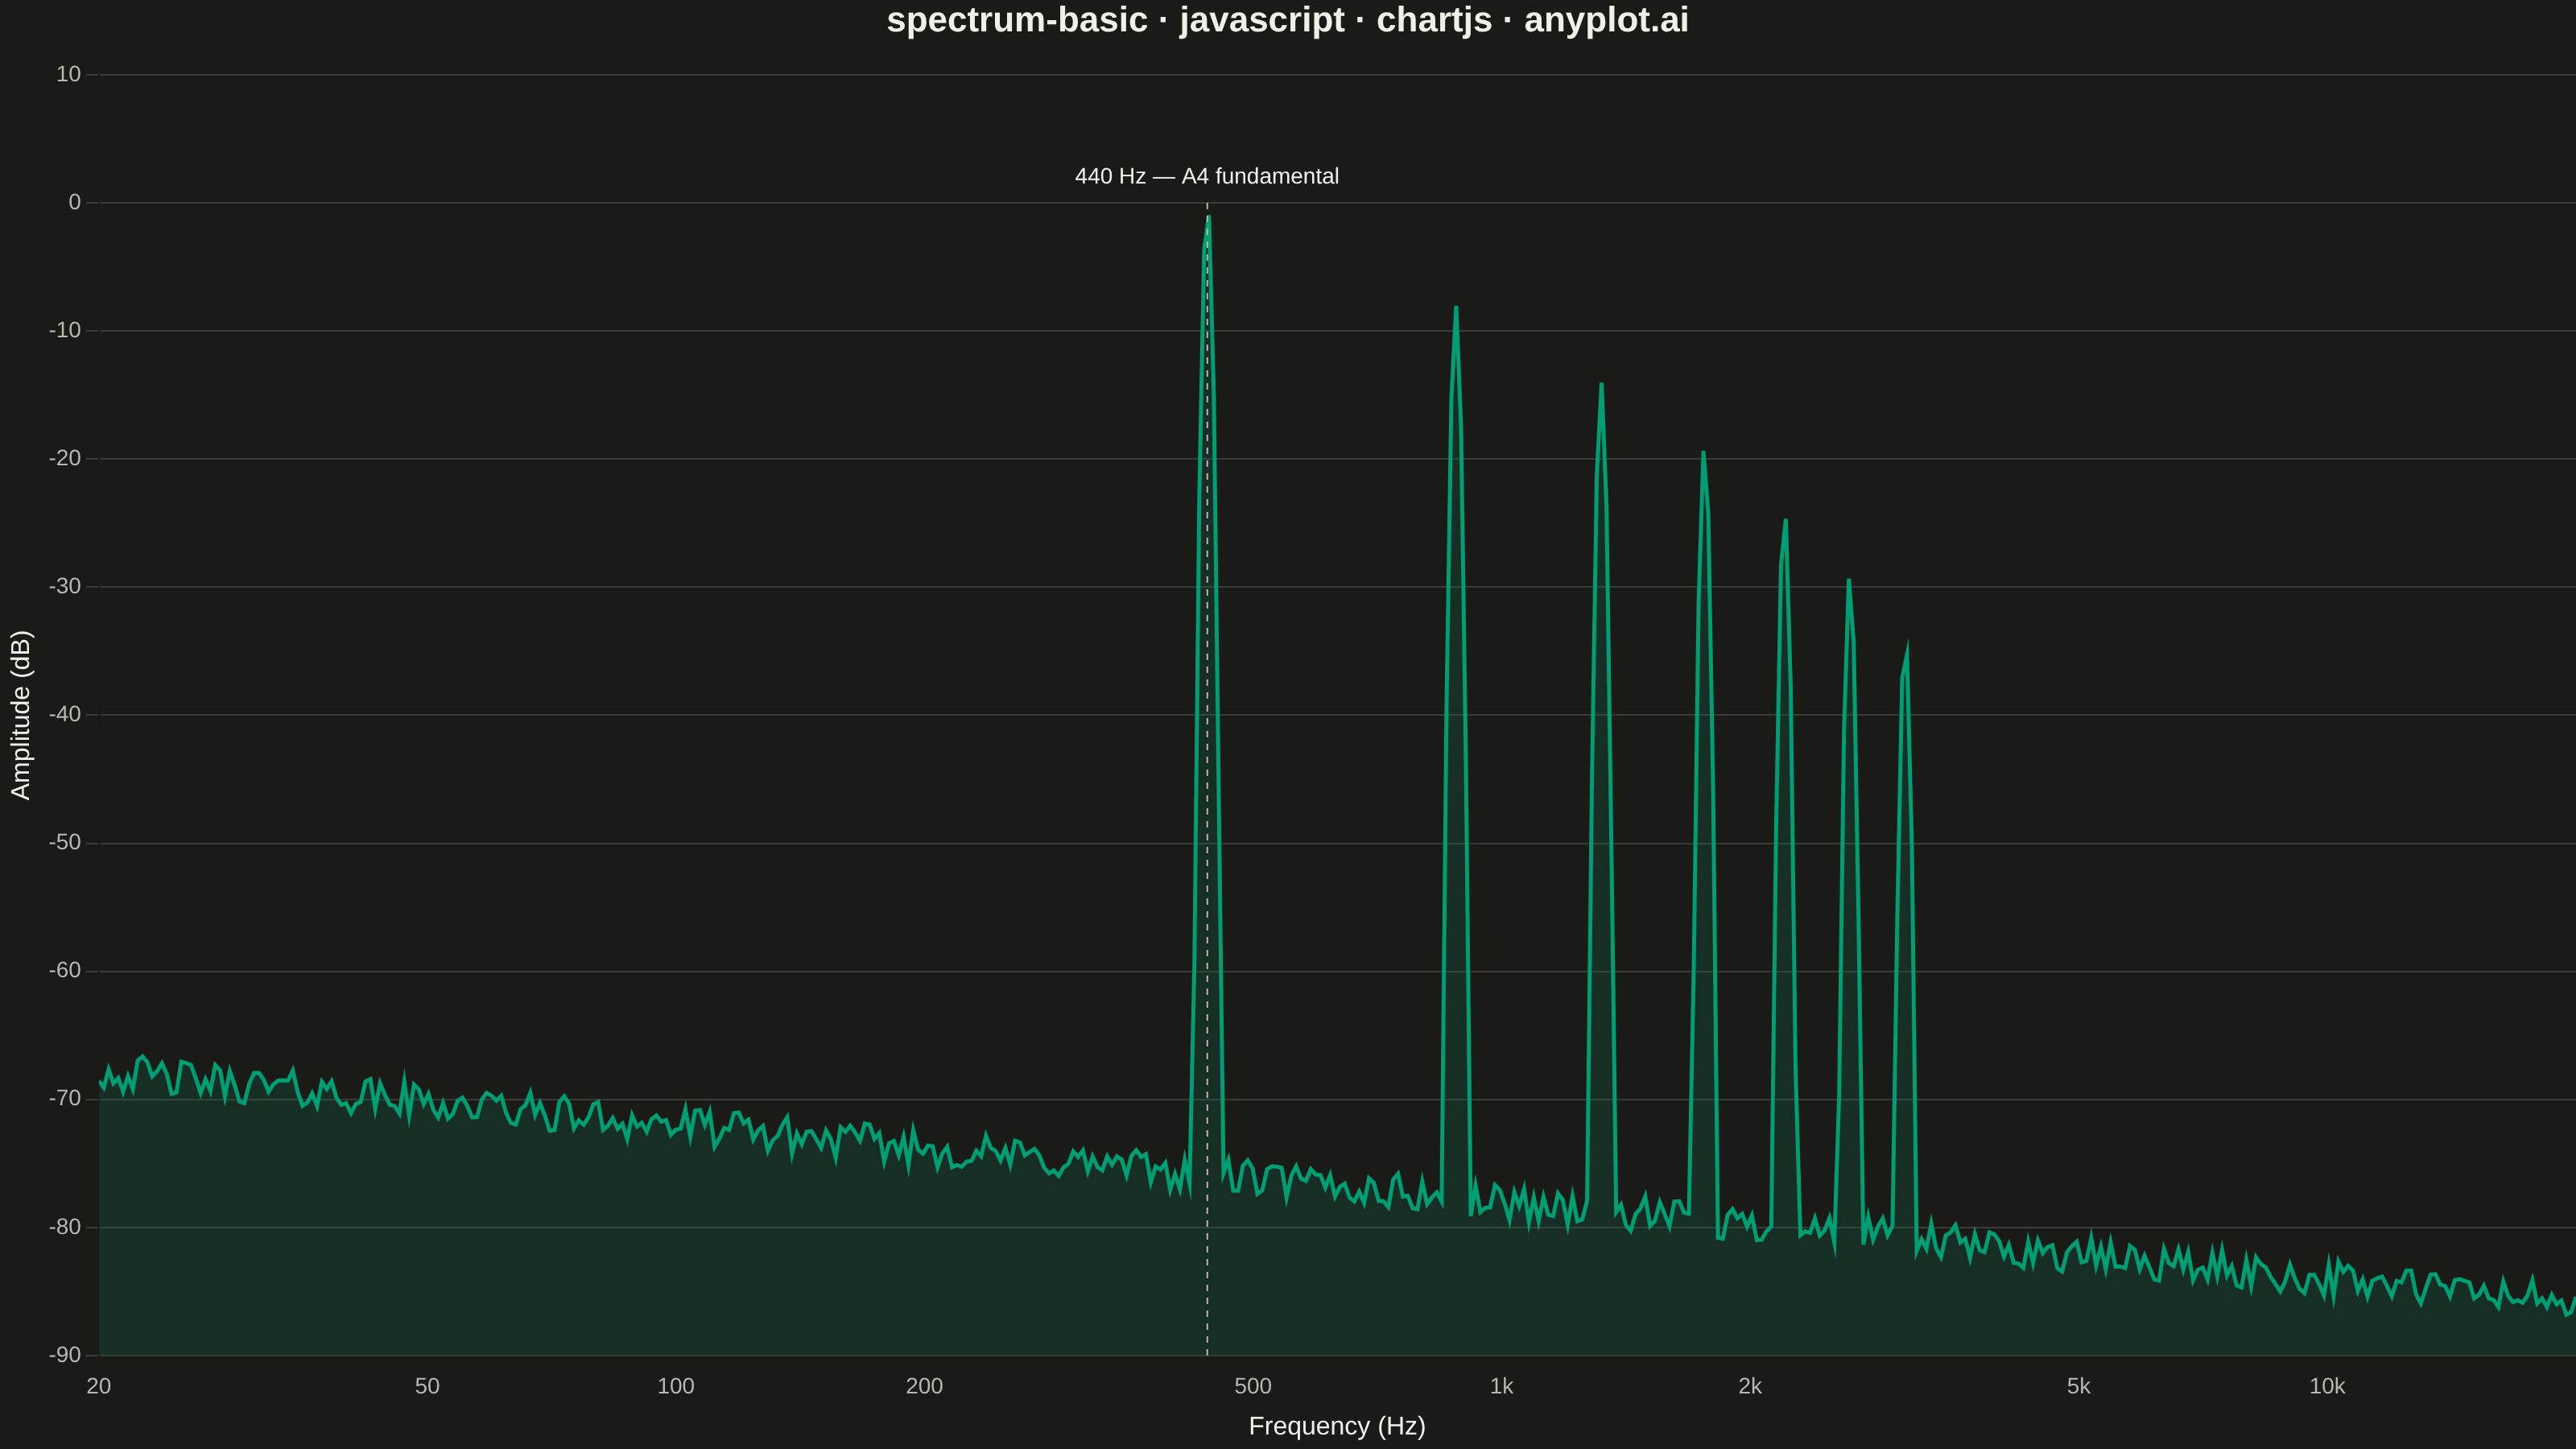
A frequency spectrum plot displays signal amplitude or power across a range of frequencies, showing the frequency domain representation of time-series data. This visualization reveals the frequency components present in a signal, making it essential for identifying dominant frequencies, harmonics, and noise characteristics. It is fundamental in signal processing, audio engineering, and vibration analysis.
// anyplot.ai
// spectrum-basic: Frequency Spectrum Plot
// Library: chartjs 4.4.7 | JavaScript 22.23.2
// Quality: 92/100 | Created: 2026-09-09

const t = window.ANYPLOT_TOKENS;

// --- Data: synthetic FFT spectrum of a plucked-string note (A4 = 440 Hz) ---
// Fixed-seed LCG (browser has no seeded Math.random)
let lcgState = 42;
function rand() {
  lcgState = (lcgState * 1664525 + 1013904223) % 4294967296;
  return lcgState / 4294967296;
}

const F_MIN = 20;
const F_MAX = 20000;
const N_BINS = 512;
const FUNDAMENTAL = 440;
const HARMONICS = [
  { multiple: 1, amplitudeDb: 0 },
  { multiple: 2, amplitudeDb: -8 },
  { multiple: 3, amplitudeDb: -14 },
  { multiple: 4, amplitudeDb: -19 },
  { multiple: 5, amplitudeDb: -24 },
  { multiple: 6, amplitudeDb: -29 },
  { multiple: 7, amplitudeDb: -34 },
].map((h) => ({ frequency: h.multiple * FUNDAMENTAL, amplitudeDb: h.amplitudeDb }));

function noiseFloorDb(frequency) {
  return -72 - 6 * Math.log10(frequency / 100) + (rand() - 0.5) * 3;
}

function harmonicPeakDb(frequency, peak, widthOctaves) {
  const octaves = Math.log2(frequency / peak.frequency);
  const falloffDb = 55 * (octaves / widthOctaves) ** 2;
  return peak.amplitudeDb - falloffDb;
}

const logStep = Math.log10(F_MAX / F_MIN) / (N_BINS - 1);
const spectrum = Array.from({ length: N_BINS }, (_, i) => {
  const frequency = F_MIN * 10 ** (i * logStep);
  const peakContribution = HARMONICS.reduce(
    (acc, h) => Math.max(acc, harmonicPeakDb(frequency, h, 0.05)),
    -Infinity,
  );
  const amplitude = Math.max(noiseFloorDb(frequency), peakContribution);
  return { x: frequency, y: amplitude };
});

// --- Mount -------------------------------------------------------------
const canvas = document.createElement("canvas");
document.getElementById("container").appendChild(canvas);

// --- Distinctive feature: custom plugin calling out the fundamental ----
const Y_MIN = -90;
const annotateFundamental = {
  id: "annotateFundamental",
  afterDatasetsDraw(chart) {
    const { ctx, scales } = chart;
    const xPixel = scales.x.getPixelForValue(FUNDAMENTAL);
    const yPixel = scales.y.getPixelForValue(HARMONICS[0].amplitudeDb);
    const bottomPixel = scales.y.getPixelForValue(Y_MIN);

    ctx.save();
    ctx.strokeStyle = t.inkSoft;
    ctx.setLineDash([4, 4]);
    ctx.beginPath();
    ctx.moveTo(xPixel, yPixel);
    ctx.lineTo(xPixel, bottomPixel);
    ctx.stroke();

    ctx.setLineDash([]);
    ctx.fillStyle = t.ink;
    ctx.font = "14px sans-serif";
    ctx.textAlign = "center";
    ctx.fillText("440 Hz — A4 fundamental", xPixel, yPixel - 12);
    ctx.restore();
  },
};

// --- Chart ---------------------------------------------------------------
new Chart(canvas, {
  type: "line",
  plugins: [annotateFundamental],
  data: {
    datasets: [
      {
        label: "Amplitude",
        data: spectrum,
        borderColor: t.palette[0],
        backgroundColor: t.palette[0] + "26",
        borderWidth: 2.5,
        pointRadius: 0,
        fill: "start",
        tension: 0,
      },
    ],
  },
  options: {
    responsive: true,
    maintainAspectRatio: false,
    animation: false,
    plugins: {
      title: {
        display: true,
        text: "spectrum-basic · javascript · chartjs · anyplot.ai",
        color: t.ink,
        font: { size: 22 },
        padding: { bottom: 20 },
      },
      legend: { display: false },
    },
    scales: {
      x: {
        type: "logarithmic",
        min: F_MIN,
        max: F_MAX,
        ticks: {
          color: t.inkSoft,
          font: { size: 14 },
          callback: (value) => {
            const digits = Math.log10(value);
            if (!Number.isInteger(digits) && value !== 20 && value !== 50 && value !== 200 && value !== 500 && value !== 2000 && value !== 5000) {
              return null;
            }
            return value >= 1000 ? `${value / 1000}k` : `${value}`;
          },
        },
        grid: { display: false },
        title: { display: true, text: "Frequency (Hz)", color: t.ink, font: { size: 16 } },
      },
      y: {
        min: Y_MIN,
        suggestedMax: 8,
        ticks: { color: t.inkSoft, font: { size: 14 } },
        grid: { color: t.grid },
        title: { display: true, text: "Amplitude (dB)", color: t.ink, font: { size: 16 } },
      },
    },
  },
});
Runnable source as JSON, for any HTTP client: https://api.anyplot.ai/specs/spectrum-basic/chartjs/code. Any spec id and library id listed in llms-full.txt fit the same URL shape; every URL below is complete and callable.
{
  "spec_id": "spectrum-basic",
  "language": "javascript",
  "library": "chartjs",
  "page": "https://anyplot.ai/spectrum-basic/javascript/chartjs",
  "hub": "https://anyplot.ai/spectrum-basic",
  "code_json": "https://api.anyplot.ai/specs/spectrum-basic/chartjs/code",
  "spec_json": "https://api.anyplot.ai/specs/spectrum-basic",
  "render_light_png": "https://storage.googleapis.com/anyplot-images/plots/spectrum-basic/javascript/chartjs/plot-light.png",
  "render_dark_png": "https://storage.googleapis.com/anyplot-images/plots/spectrum-basic/javascript/chartjs/plot-dark.png",
  "interactive_light_html": "https://storage.googleapis.com/anyplot-images/plots/spectrum-basic/javascript/chartjs/plot-light.html",
  "interactive_dark_html": "https://storage.googleapis.com/anyplot-images/plots/spectrum-basic/javascript/chartjs/plot-dark.html",
  "quality_score": 92.0,
  "license": "MIT",
  "guide": "https://anyplot.ai/llms.txt"
}
Part of Frequency Spectrum Plot on anyplot.ai.