The same plot in 14 other libraries — JavaScript: Chart.js, D3.js, Apache ECharts, Highcharts; Python: Altair, Bokeh, lets-plot, Matplotlib, Plotly, plotnine, Pygal, Seaborn; R: ggplot2; Julia: Makie.jl. Compare all 15 side by side: Frequency Spectrum Plot in Python, R, Julia and JavaScript.
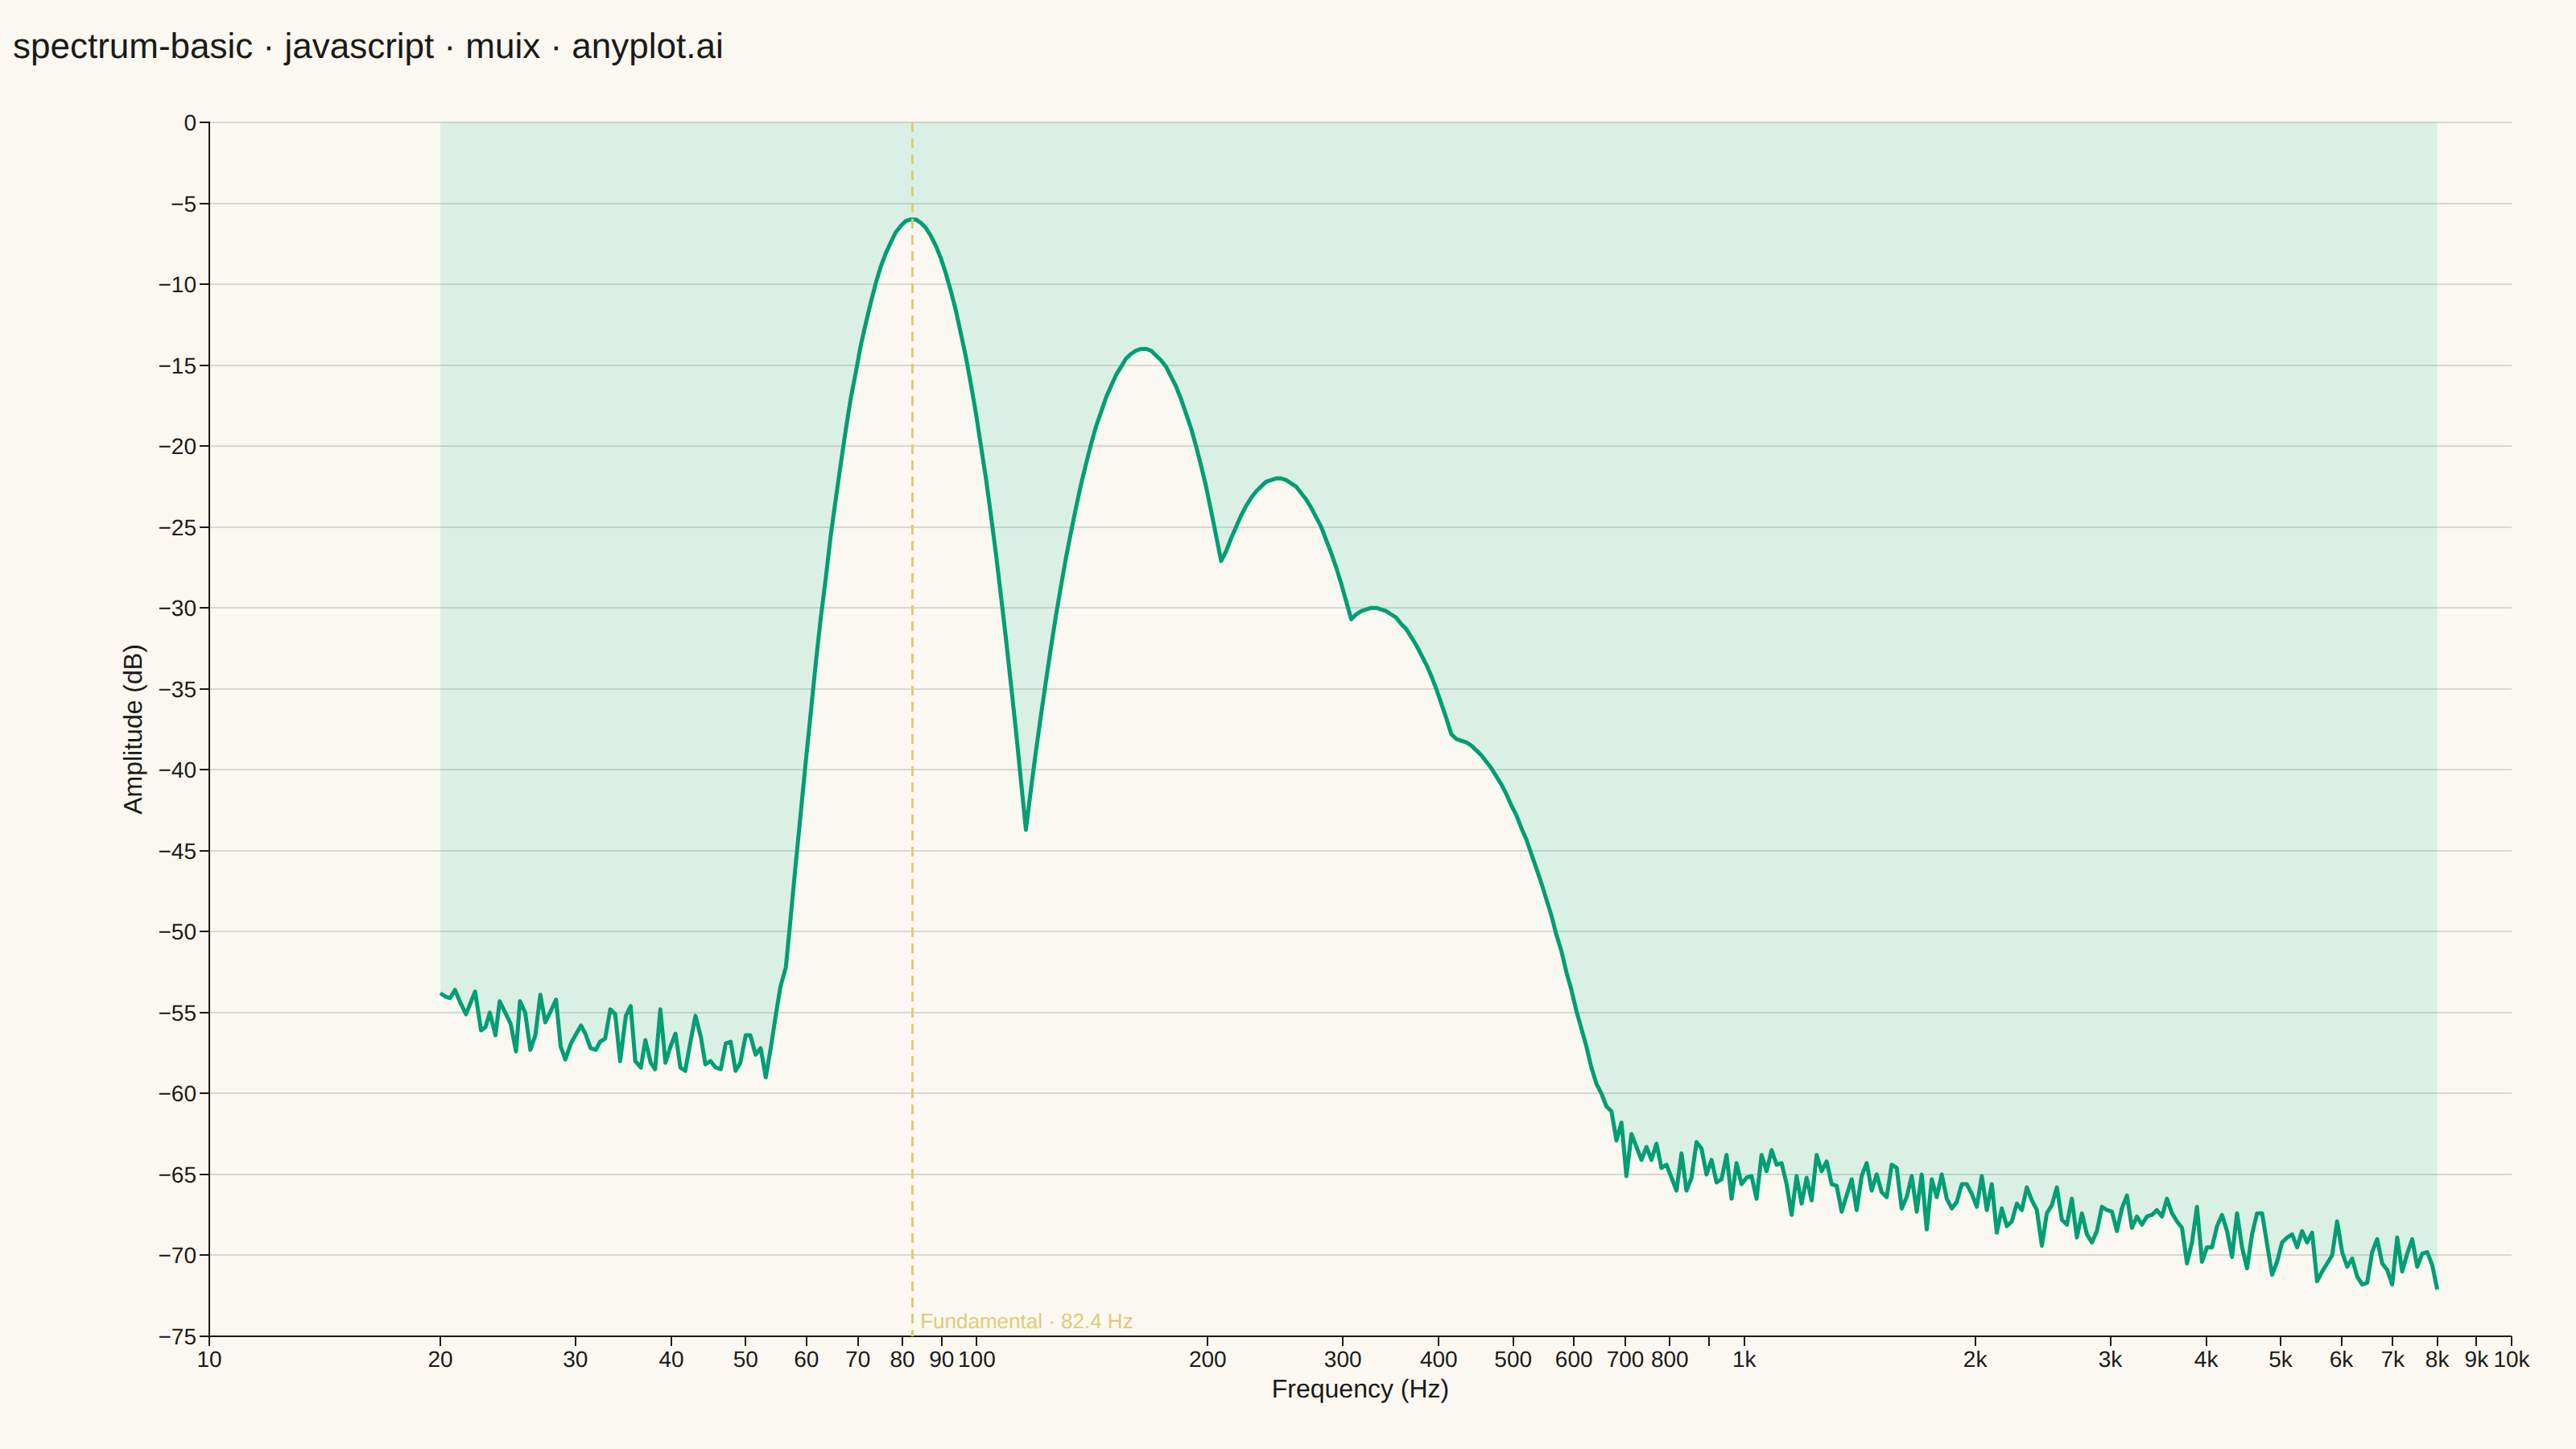
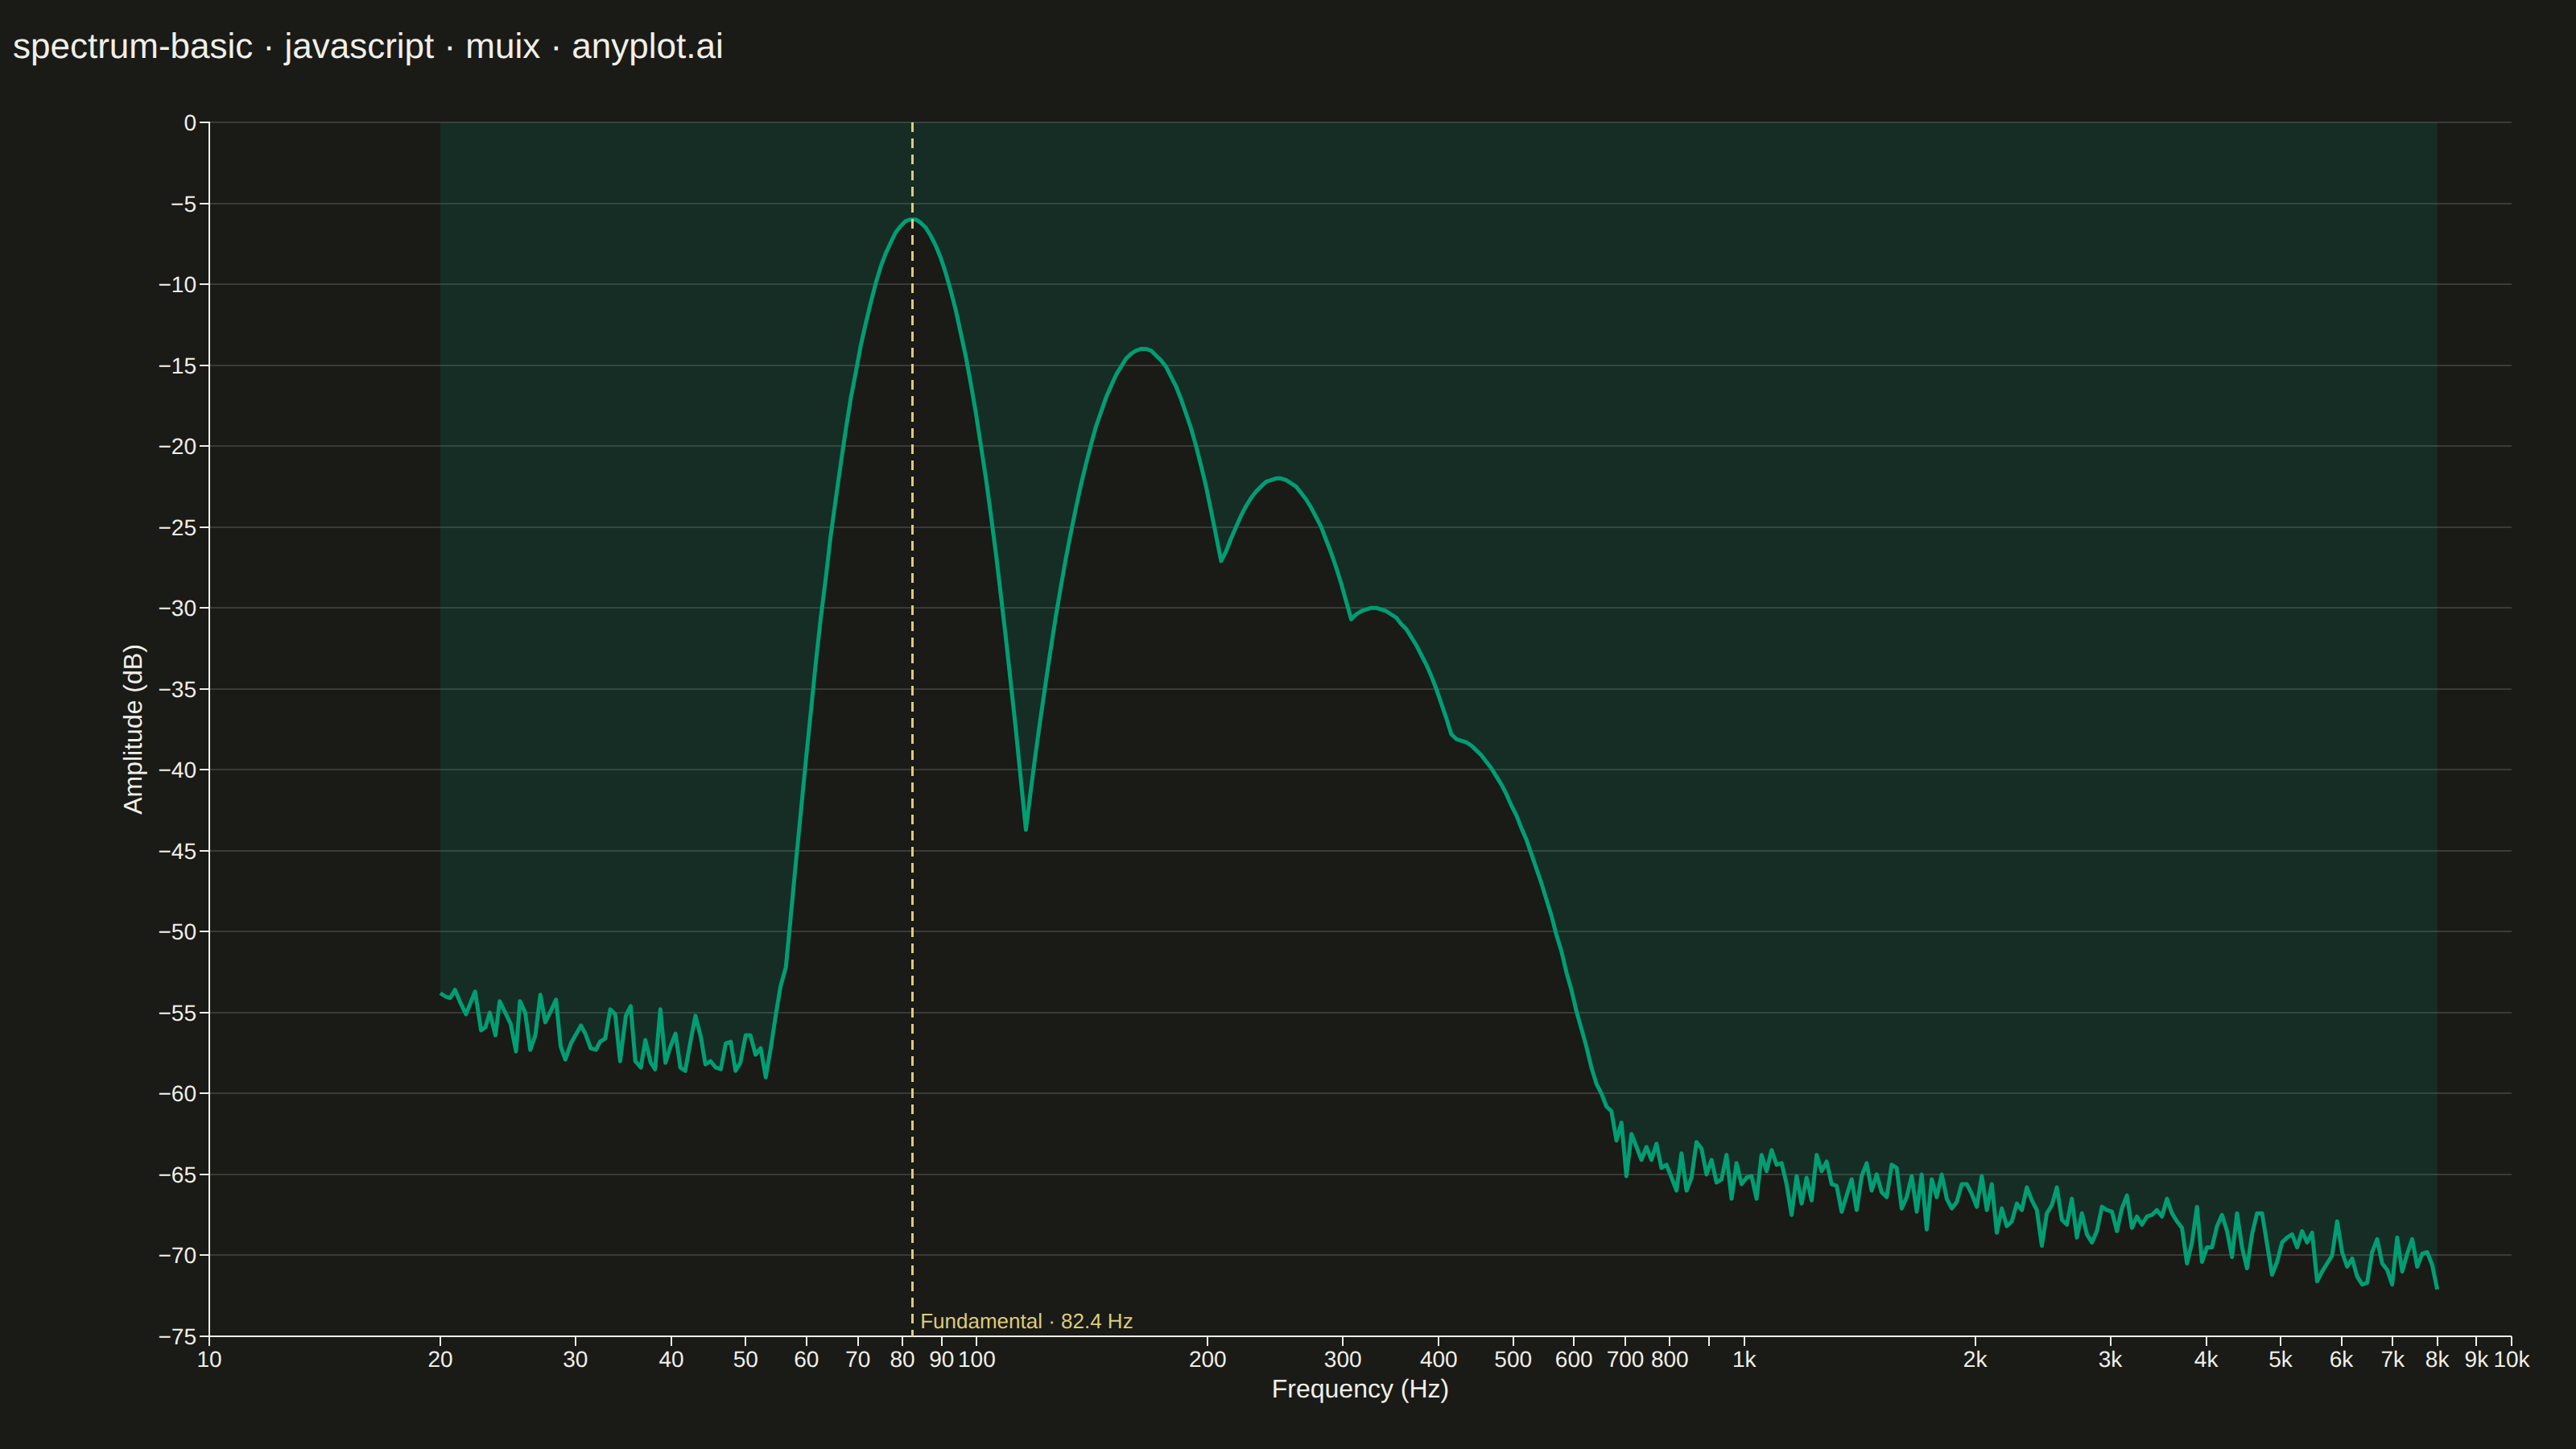
A frequency spectrum plot displays signal amplitude or power across a range of frequencies, showing the frequency domain representation of time-series data. This visualization reveals the frequency components present in a signal, making it essential for identifying dominant frequencies, harmonics, and noise characteristics. It is fundamental in signal processing, audio engineering, and vibration analysis.
// anyplot.ai
// spectrum-basic: Frequency Spectrum Plot
// Library: muix 7.29.1 | JavaScript 22.23.2
// Quality: 91/100 | Created: 2026-09-09
import { LineChart } from "@mui/x-charts/LineChart";
import { ChartsReferenceLine } from "@mui/x-charts/ChartsReferenceLine";
import { Typography } from "@mui/material";

const t = window.ANYPLOT_TOKENS;

// --- Data (in-memory, deterministic) ---------------------------------------
// Synthetic FFT magnitude spectrum of a plucked low-E guitar string (82.4 Hz)
// and its first four harmonics, riding on a gently sloping noise floor.
let seed = 42;
function lcg() {
  seed = (Math.imul(seed, 1103515245) + 12345) | 0;
  return (seed >>> 0) / 4294967296;
}

const FUNDAMENTAL_HZ = 82.4;
const HARMONICS = [1, 2, 3, 4, 5].map((n) => ({
  freq: FUNDAMENTAL_HZ * n,
  amplitudeDb: -6 - (n - 1) * 8,
  widthDecades: 0.04 + n * 0.008,
}));

const POINTS = 400;
const MIN_FREQ = 20;
const MAX_FREQ = 8000;
const logMin = Math.log10(MIN_FREQ);
const logMax = Math.log10(MAX_FREQ);

const frequency = [];
const amplitude = [];
for (let i = 0; i < POINTS; i++) {
  const f = Math.pow(10, logMin + (logMax - logMin) * (i / (POINTS - 1)));
  frequency.push(Math.round(f * 10) / 10);

  // Pink-noise-like floor: drops with frequency, plus small fixed jitter
  const noiseFloorDb = -55 - 6 * Math.log10(f / MIN_FREQ) + (lcg() - 0.5) * 4;

  // Each harmonic contributes a narrow Gaussian bump in log-frequency space
  let peakDb = -100;
  for (const h of HARMONICS) {
    const distance = (Math.log10(f) - Math.log10(h.freq)) / h.widthDecades;
    peakDb = Math.max(peakDb, h.amplitudeDb - 4 * distance * distance);
  }

  // Combine floor and harmonics in the power domain, then back to dB
  const powerSum = Math.pow(10, noiseFloorDb / 10) + Math.pow(10, peakDb / 10);
  amplitude.push(Math.round(10 * Math.log10(powerSum) * 10) / 10);
}

// --- Chart (default-exported component — the harness mounts it) -------------
export default function Chart() {
  const { width, height } = window.ANYPLOT_SIZE;
  const titleHeight = 56;

  return (
    <div style={{ width, height, display: "flex", flexDirection: "column" }}>
      <Typography
        color="text.primary"
        sx={{
          fontSize: 22,
          fontWeight: 500,
          height: titleHeight,
          boxSizing: "border-box",
          display: "flex",
          alignItems: "center",
          pl: 1,
        }}
      >
        spectrum-basic · javascript · muix · anyplot.ai
      </Typography>
      <LineChart
        width={width}
        height={height - titleHeight}
        skipAnimation
        series={[
          {
            data: amplitude,
            label: "Amplitude",
            color: t.palette[0],
            showMark: false,
            curve: "linear",
            area: true,
          },
        ]}
        sx={{
          "& .MuiLineElement-root": { strokeWidth: 2.5 },
          "& .MuiAreaElement-root": { fillOpacity: 0.12 },
        }}
        xAxis={[
          {
            data: frequency,
            scaleType: "log",
            label: "Frequency (Hz)",
            valueFormatter: (v) => (v >= 1000 ? `${Math.round(v / 100) / 10}k` : `${Math.round(v)}`),
            labelStyle: { fontSize: 16 },
            tickLabelStyle: { fontSize: 14 },
          },
        ]}
        yAxis={[
          {
            label: "Amplitude (dB)",
            labelStyle: { fontSize: 16 },
            tickLabelStyle: { fontSize: 14 },
            tickFontSize: 26,
          },
        ]}
        grid={{ horizontal: true }}
        margin={{ left: 130, right: 40, top: 20, bottom: 70 }}
        slotProps={{ legend: { hidden: true } }}
      >
        <ChartsReferenceLine
          x={FUNDAMENTAL_HZ}
          label={`Fundamental · ${FUNDAMENTAL_HZ} Hz`}
          labelAlign="end"
          lineStyle={{ stroke: t.amber, strokeDasharray: "6 4", strokeWidth: 1.5 }}
          labelStyle={{ fill: t.amber, fontSize: 13 }}
        />
      </LineChart>
    </div>
  );
}
Runnable source as JSON, for any HTTP client: https://api.anyplot.ai/specs/spectrum-basic/muix/code. Any spec id and library id listed in llms-full.txt fit the same URL shape; every URL below is complete and callable.
{
  "spec_id": "spectrum-basic",
  "language": "javascript",
  "library": "muix",
  "page": "https://anyplot.ai/spectrum-basic/javascript/muix",
  "hub": "https://anyplot.ai/spectrum-basic",
  "code_json": "https://api.anyplot.ai/specs/spectrum-basic/muix/code",
  "spec_json": "https://api.anyplot.ai/specs/spectrum-basic",
  "render_light_png": "https://storage.googleapis.com/anyplot-images/plots/spectrum-basic/javascript/muix/plot-light.png",
  "render_dark_png": "https://storage.googleapis.com/anyplot-images/plots/spectrum-basic/javascript/muix/plot-dark.png",
  "interactive_light_html": "https://storage.googleapis.com/anyplot-images/plots/spectrum-basic/javascript/muix/plot-light.html",
  "interactive_dark_html": "https://storage.googleapis.com/anyplot-images/plots/spectrum-basic/javascript/muix/plot-dark.html",
  "quality_score": 91.0,
  "license": "MIT",
  "guide": "https://anyplot.ai/llms.txt"
}
Part of Frequency Spectrum Plot on anyplot.ai.