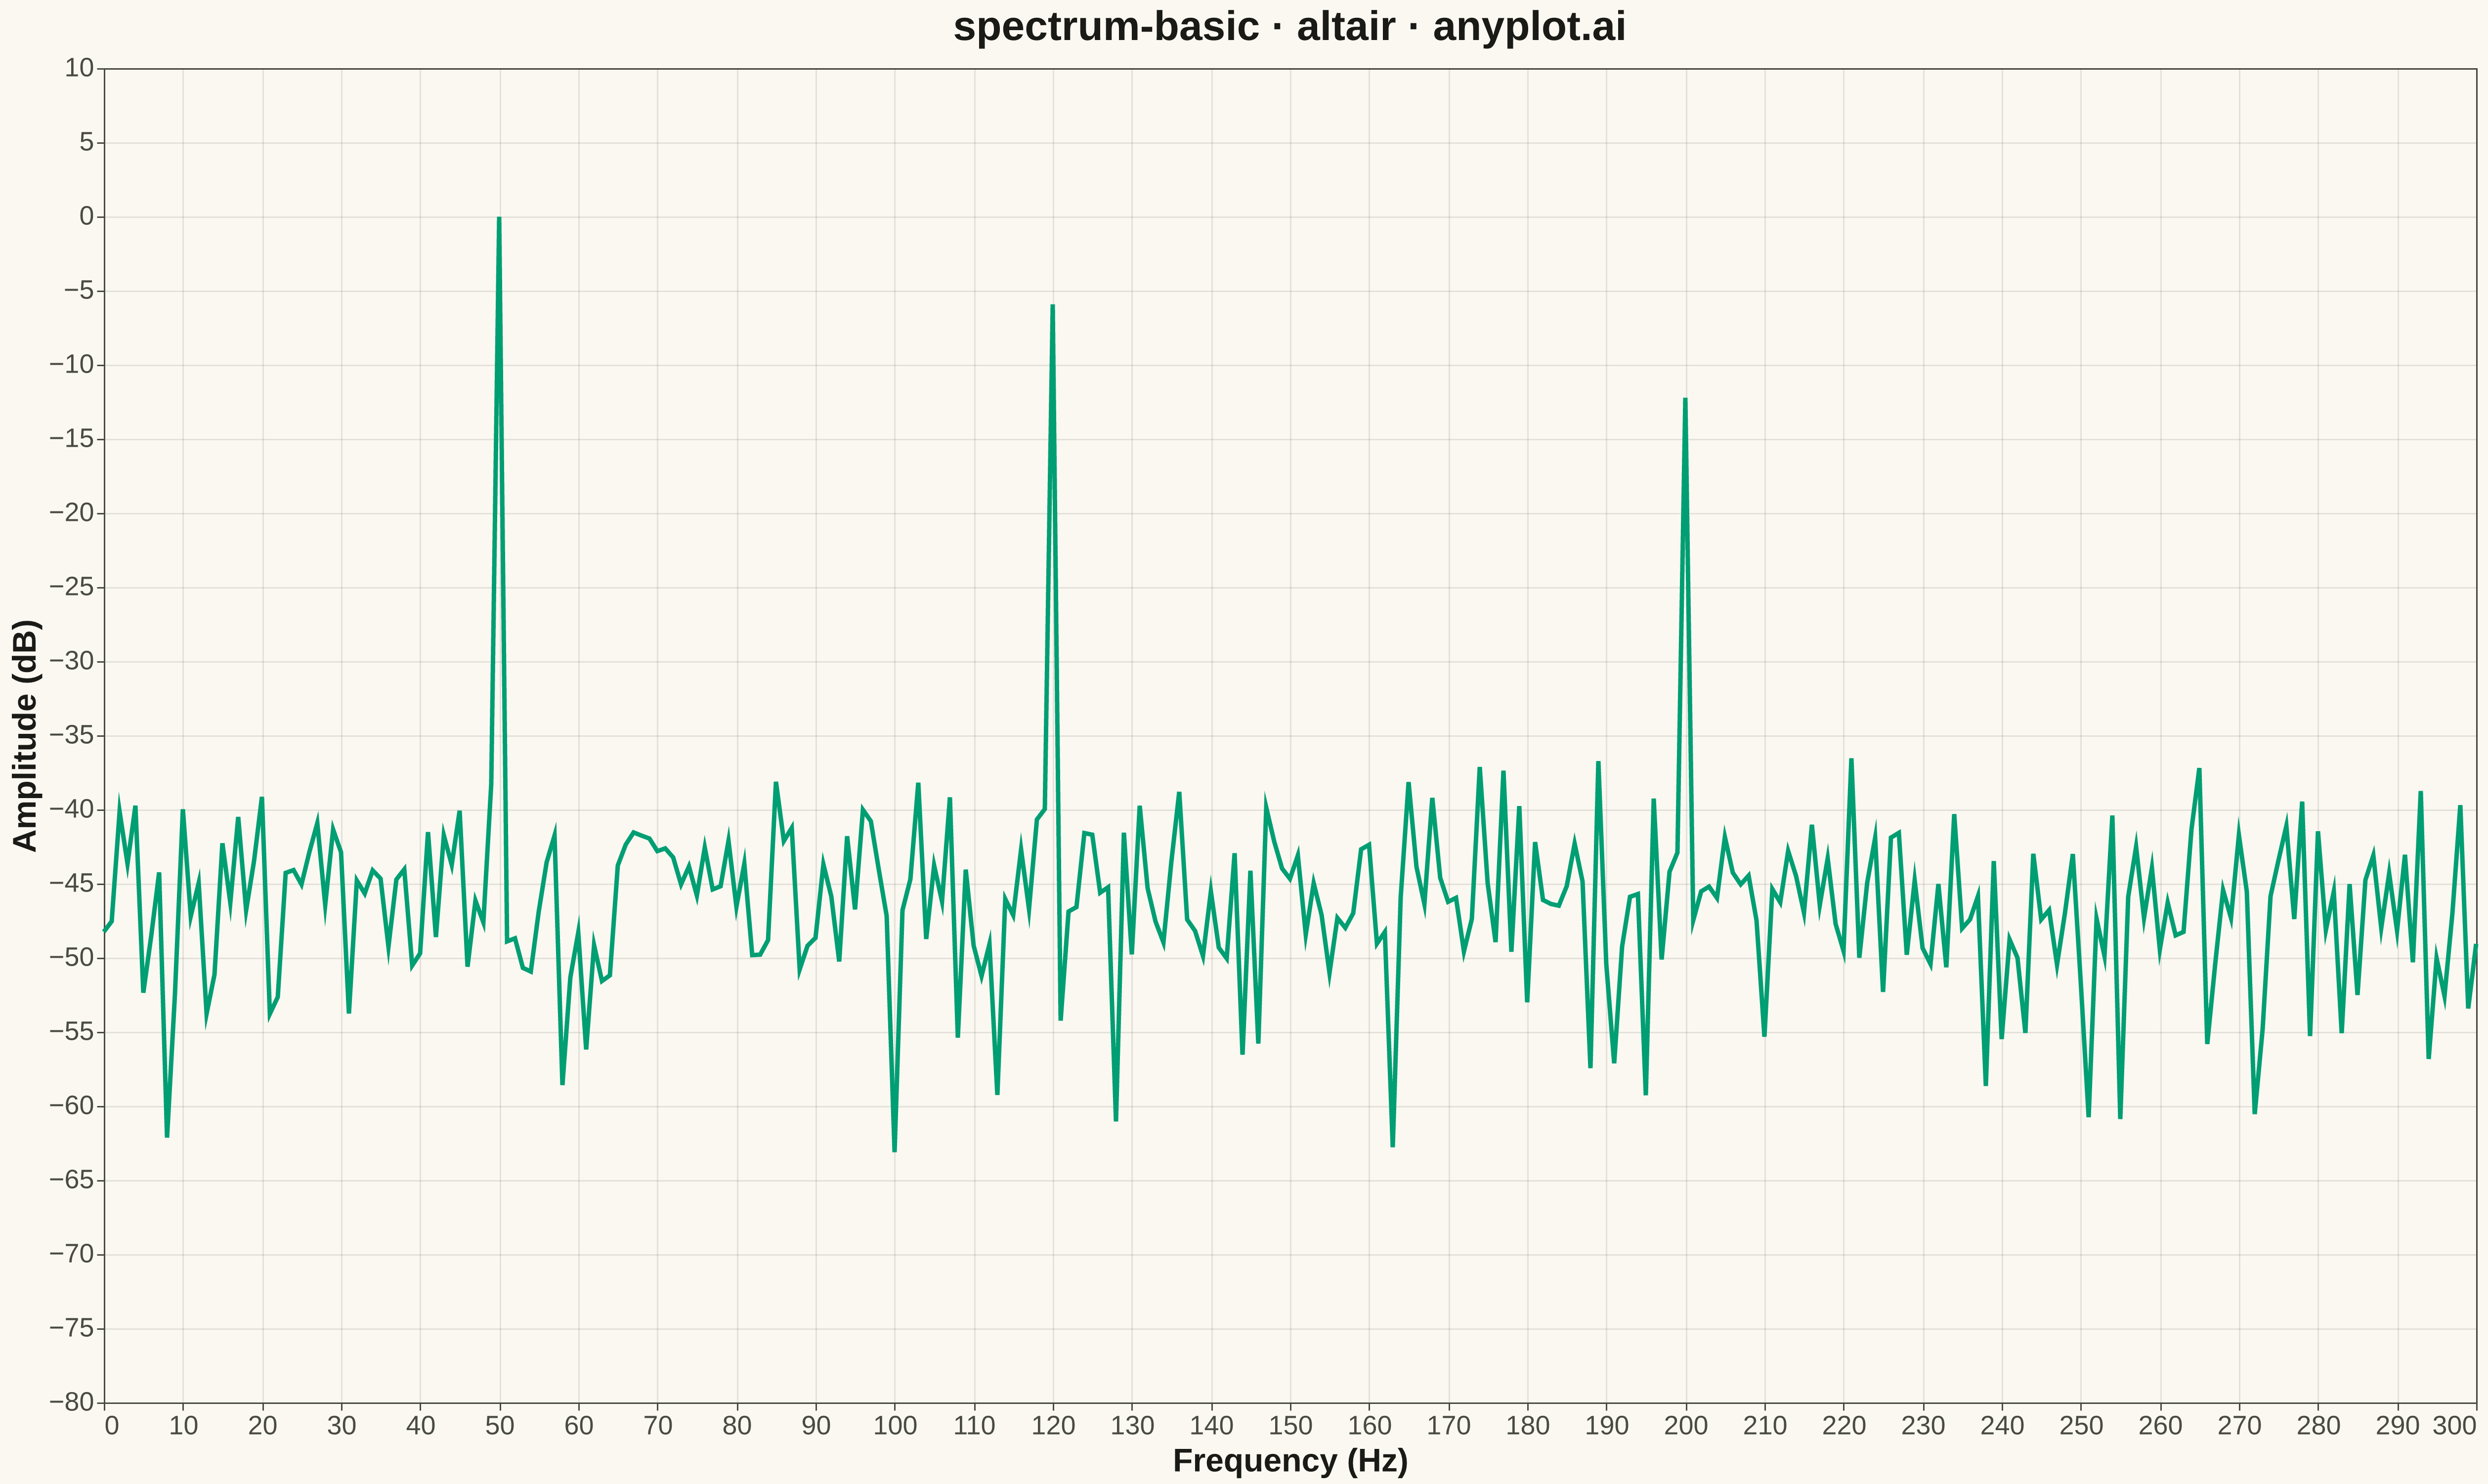
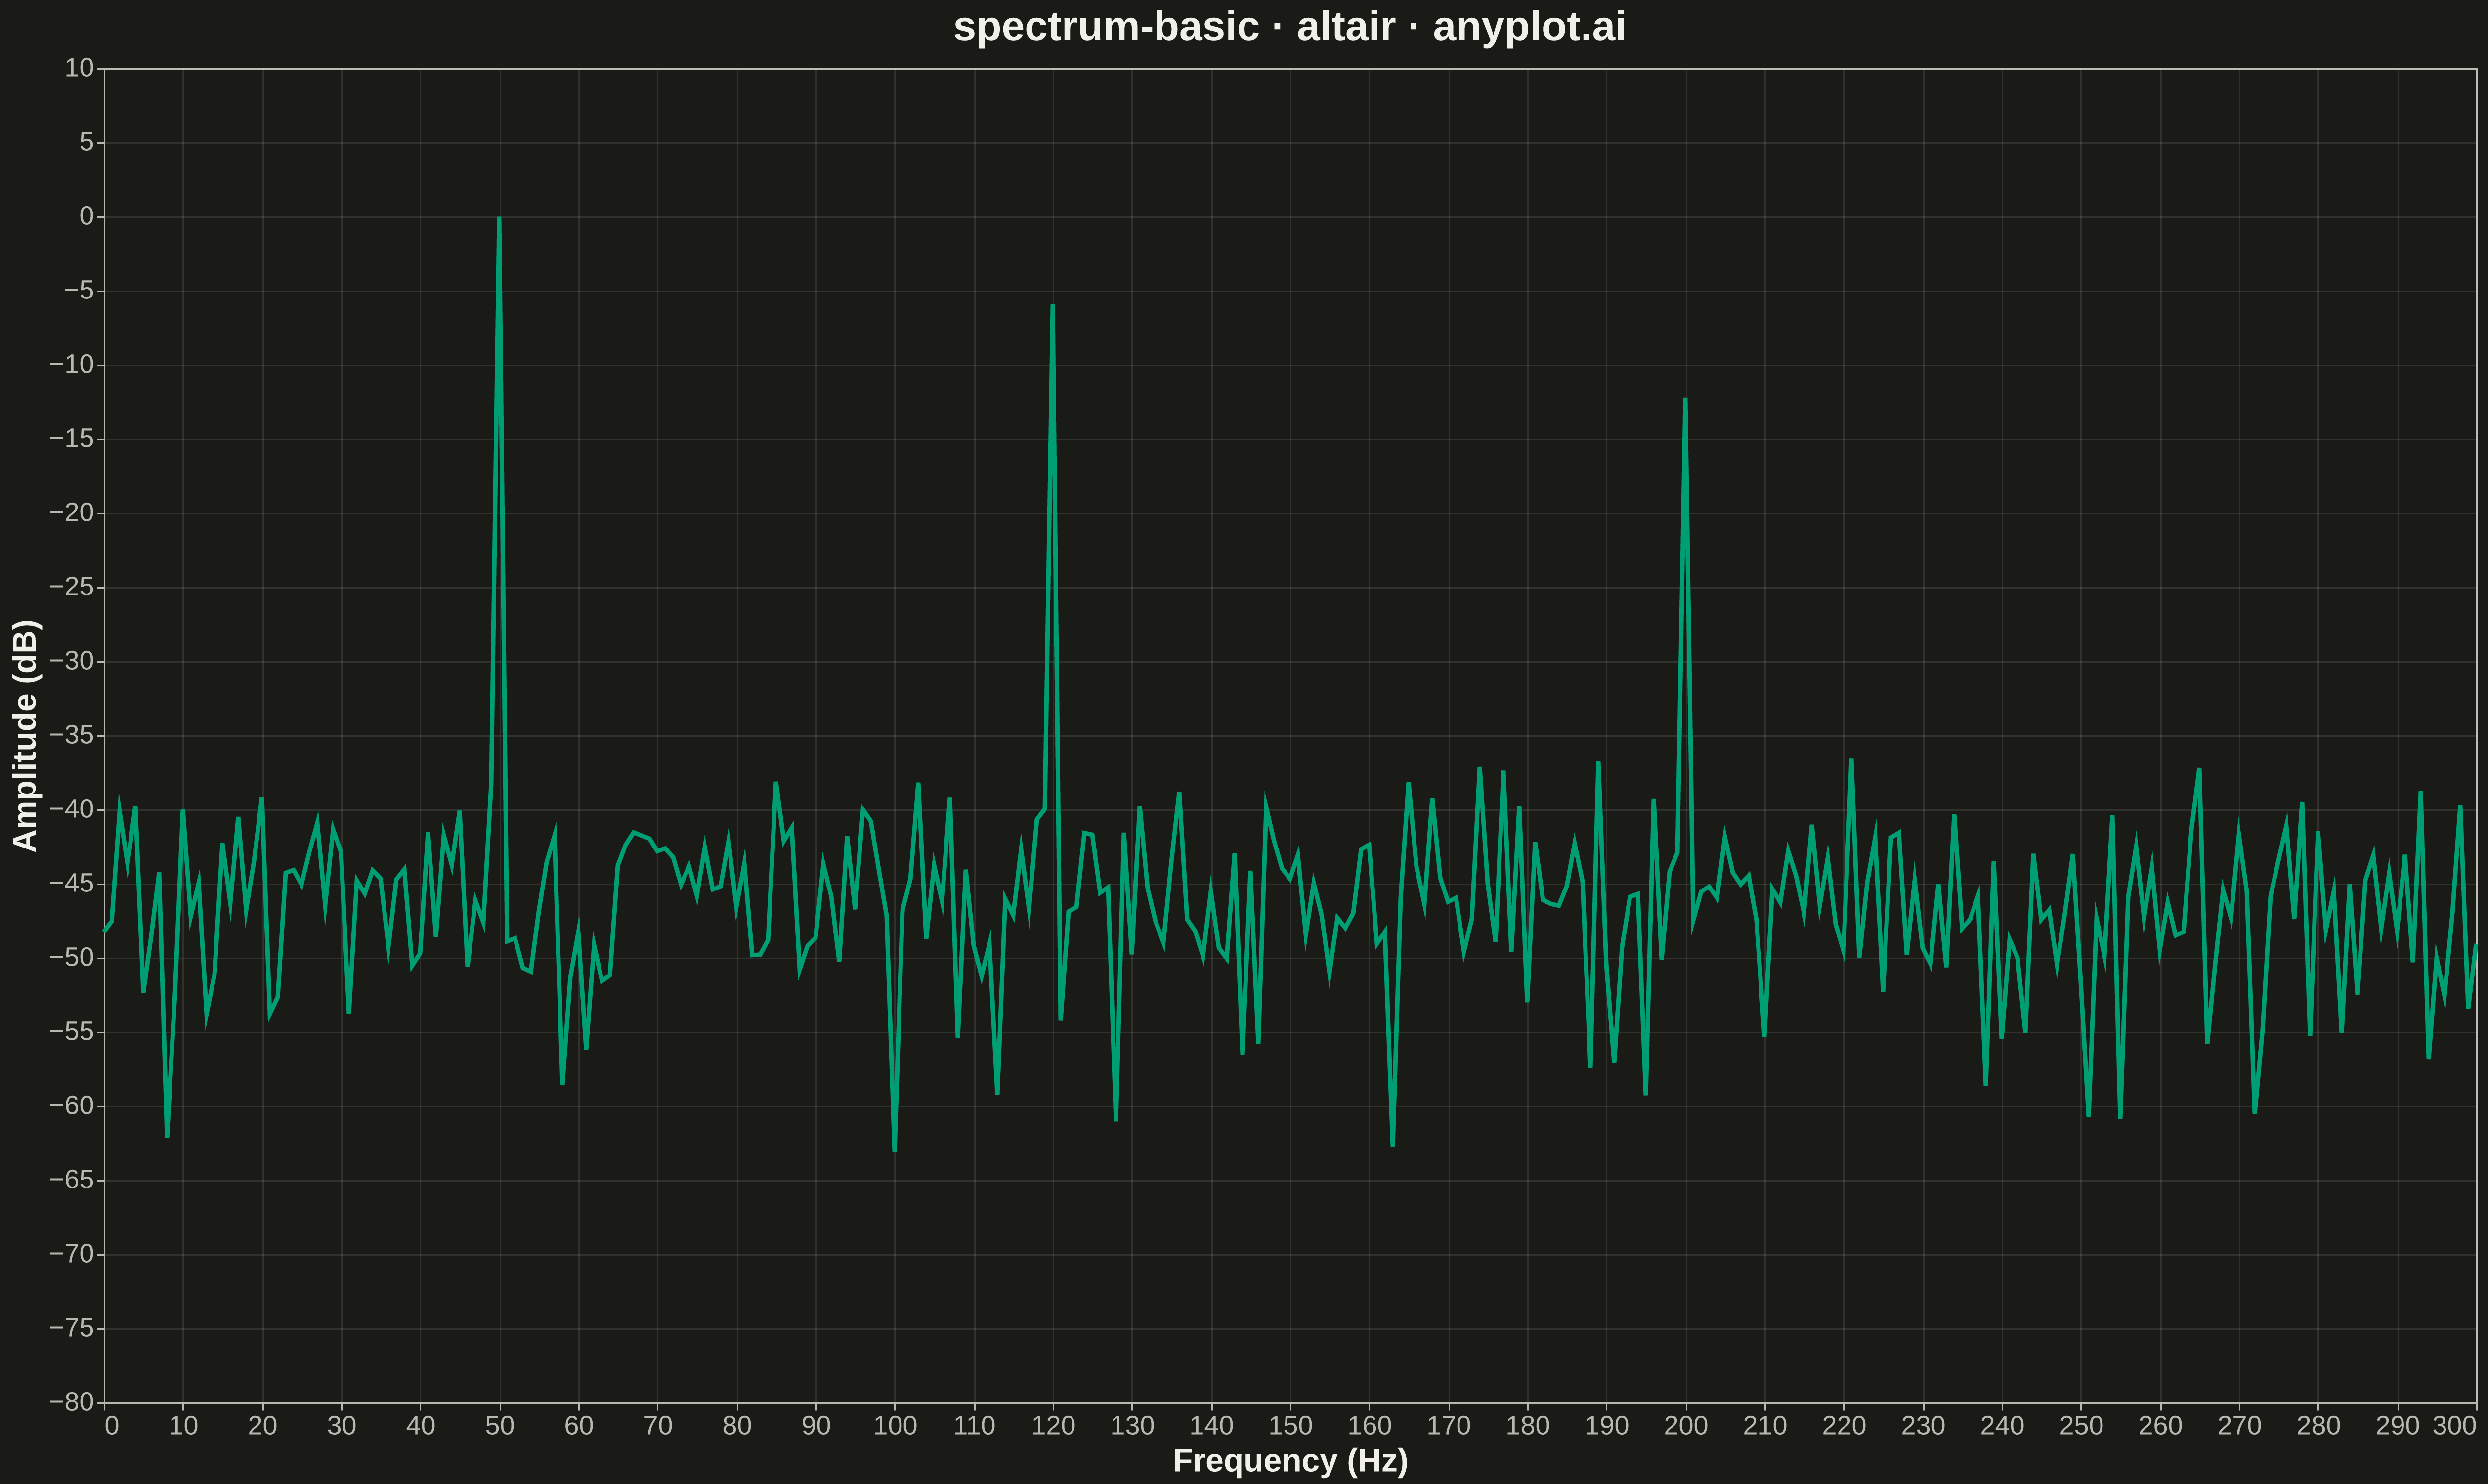
A frequency spectrum plot displays signal amplitude or power across a range of frequencies, showing the frequency domain representation of time-series data. This visualization reveals the frequency components present in a signal, making it essential for identifying dominant frequencies, harmonics, and noise characteristics. It is fundamental in signal processing, audio engineering, and vibration analysis.
""" anyplot.ai
spectrum-basic: Frequency Spectrum Plot
Library: altair 6.1.0 | Python 3.13.13
Quality: 72/100 | Updated: 2026-05-14
"""

import altair as alt
import numpy as np
import pandas as pd


# Data - Synthetic signal with multiple frequency components
np.random.seed(42)

# Sampling parameters
sample_rate = 1000  # Hz
duration = 1.0  # seconds
n_samples = int(sample_rate * duration)

# Create time-domain signal with multiple frequency components
t = np.linspace(0, duration, n_samples, endpoint=False)

# Signal components: 50 Hz (dominant), 120 Hz (harmonic), 200 Hz (weak), plus noise
signal = (
    1.0 * np.sin(2 * np.pi * 50 * t)  # 50 Hz - dominant frequency
    + 0.5 * np.sin(2 * np.pi * 120 * t)  # 120 Hz - secondary component
    + 0.25 * np.sin(2 * np.pi * 200 * t)  # 200 Hz - weak component
    + 0.1 * np.random.randn(n_samples)  # Noise
)

# Compute FFT
fft_result = np.fft.fft(signal)
frequencies = np.fft.fftfreq(n_samples, 1 / sample_rate)

# Take only positive frequencies
positive_mask = frequencies >= 0
frequencies = frequencies[positive_mask]
amplitude = np.abs(fft_result[positive_mask]) * 2 / n_samples  # Normalize

# Convert to dB scale for better visualization
amplitude_db = 20 * np.log10(amplitude + 1e-10)  # Add small value to avoid log(0)

# Create DataFrame
df = pd.DataFrame({"Frequency (Hz)": frequencies, "Amplitude (dB)": amplitude_db})

# Filter to show relevant frequency range (0-300 Hz)
df = df[df["Frequency (Hz)"] <= 300]

# Create chart
chart = (
    alt.Chart(df)
    .mark_line(color="#306998", strokeWidth=2)
    .encode(
        x=alt.X("Frequency (Hz):Q", title="Frequency (Hz)", scale=alt.Scale(domain=[0, 300])),
        y=alt.Y("Amplitude (dB):Q", title="Amplitude (dB)", scale=alt.Scale(domain=[-80, 10])),
        tooltip=[alt.Tooltip("Frequency (Hz):Q", format=".1f"), alt.Tooltip("Amplitude (dB):Q", format=".1f")],
    )
    .properties(
        width=1600, height=900, title=alt.Title("spectrum-basic · altair · pyplots.ai", fontSize=28, anchor="middle")
    )
    .configure_axis(labelFontSize=18, titleFontSize=22, grid=True, gridColor="#cccccc", gridOpacity=0.3)
    .configure_view(strokeWidth=0)
    .configure_title(fontSize=28)
)

# Save as PNG and HTML
chart.save("plot.png", scale_factor=3.0)
chart.save("plot.html")
Runnable source as JSON, for any HTTP client: https://api.anyplot.ai/specs/spectrum-basic/altair/code. Any spec id and library id listed in llms-full.txt fit the same URL shape; every URL below is complete and callable.
{
  "spec_id": "spectrum-basic",
  "language": "python",
  "library": "altair",
  "page": "https://anyplot.ai/spectrum-basic/python/altair",
  "hub": "https://anyplot.ai/spectrum-basic",
  "code_json": "https://api.anyplot.ai/specs/spectrum-basic/altair/code",
  "spec_json": "https://api.anyplot.ai/specs/spectrum-basic",
  "render_light_png": "https://storage.googleapis.com/anyplot-images/plots/spectrum-basic/python/altair/plot-light.png",
  "render_dark_png": "https://storage.googleapis.com/anyplot-images/plots/spectrum-basic/python/altair/plot-dark.png",
  "interactive_light_html": "https://storage.googleapis.com/anyplot-images/plots/spectrum-basic/python/altair/plot-light.html",
  "interactive_dark_html": "https://storage.googleapis.com/anyplot-images/plots/spectrum-basic/python/altair/plot-dark.html",
  "quality_score": 72.0,
  "license": "MIT",
  "guide": "https://anyplot.ai/llms.txt"
}
Part of Frequency Spectrum Plot on anyplot.ai.