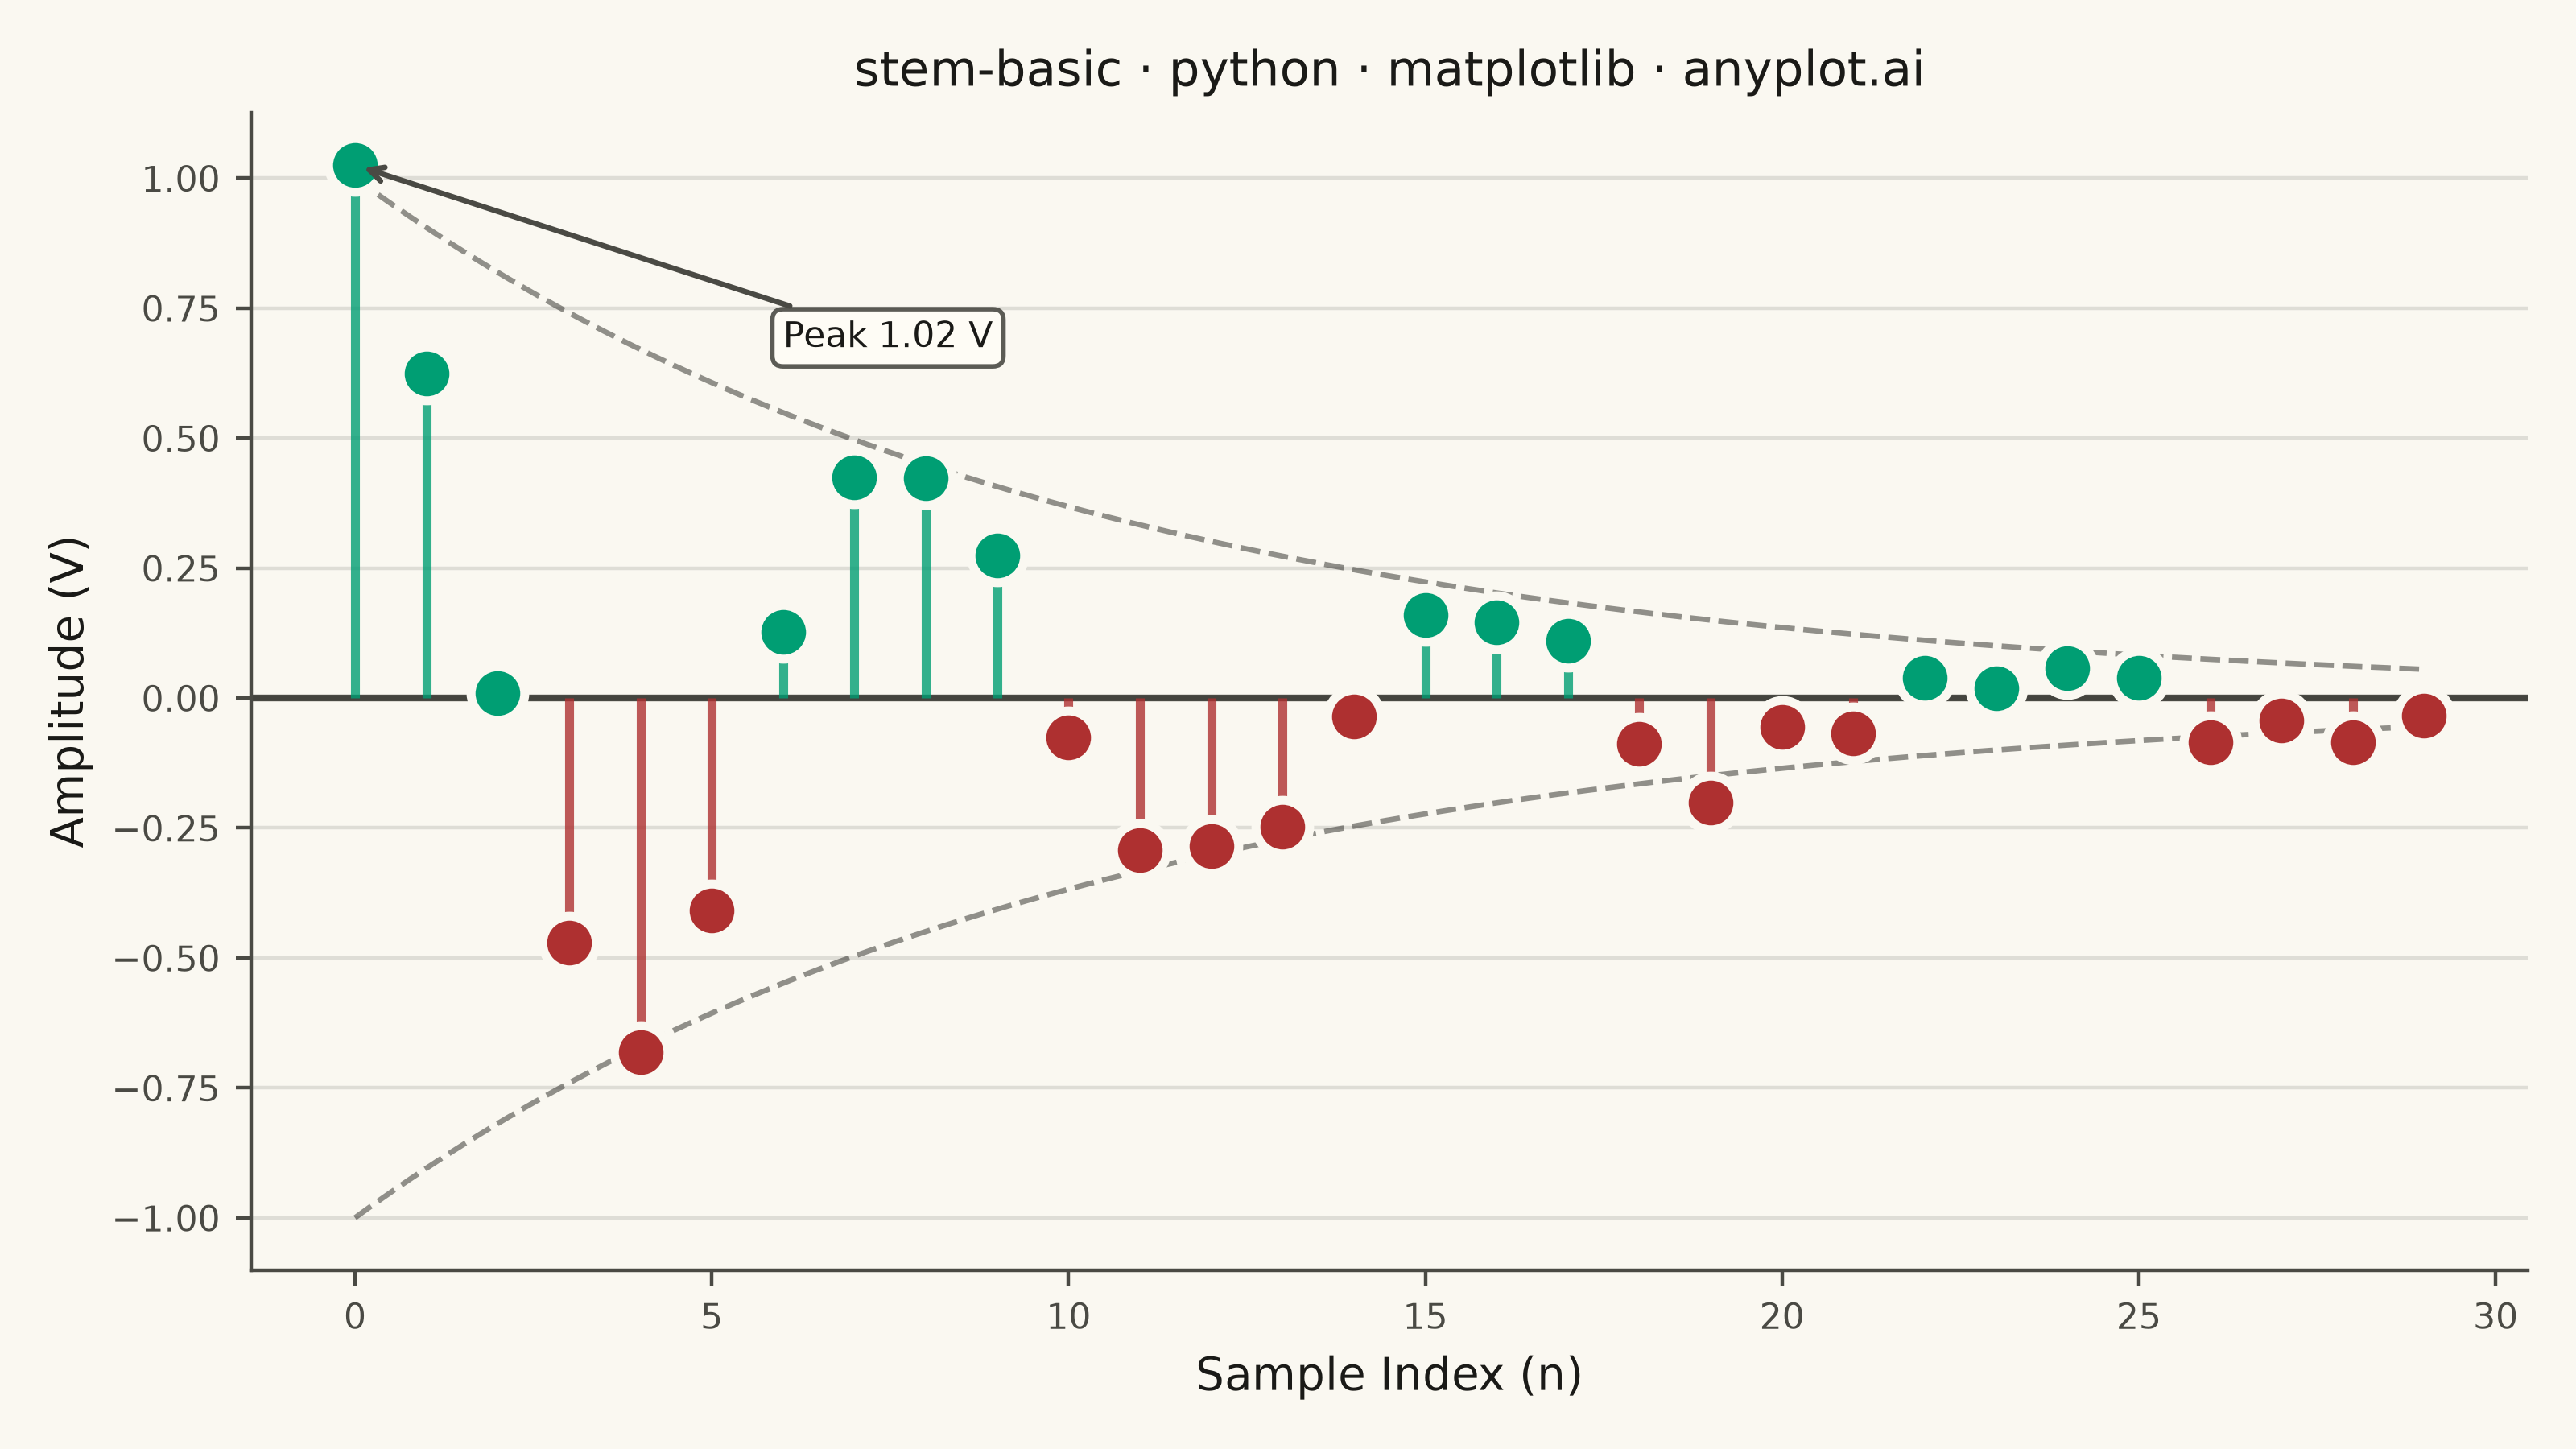
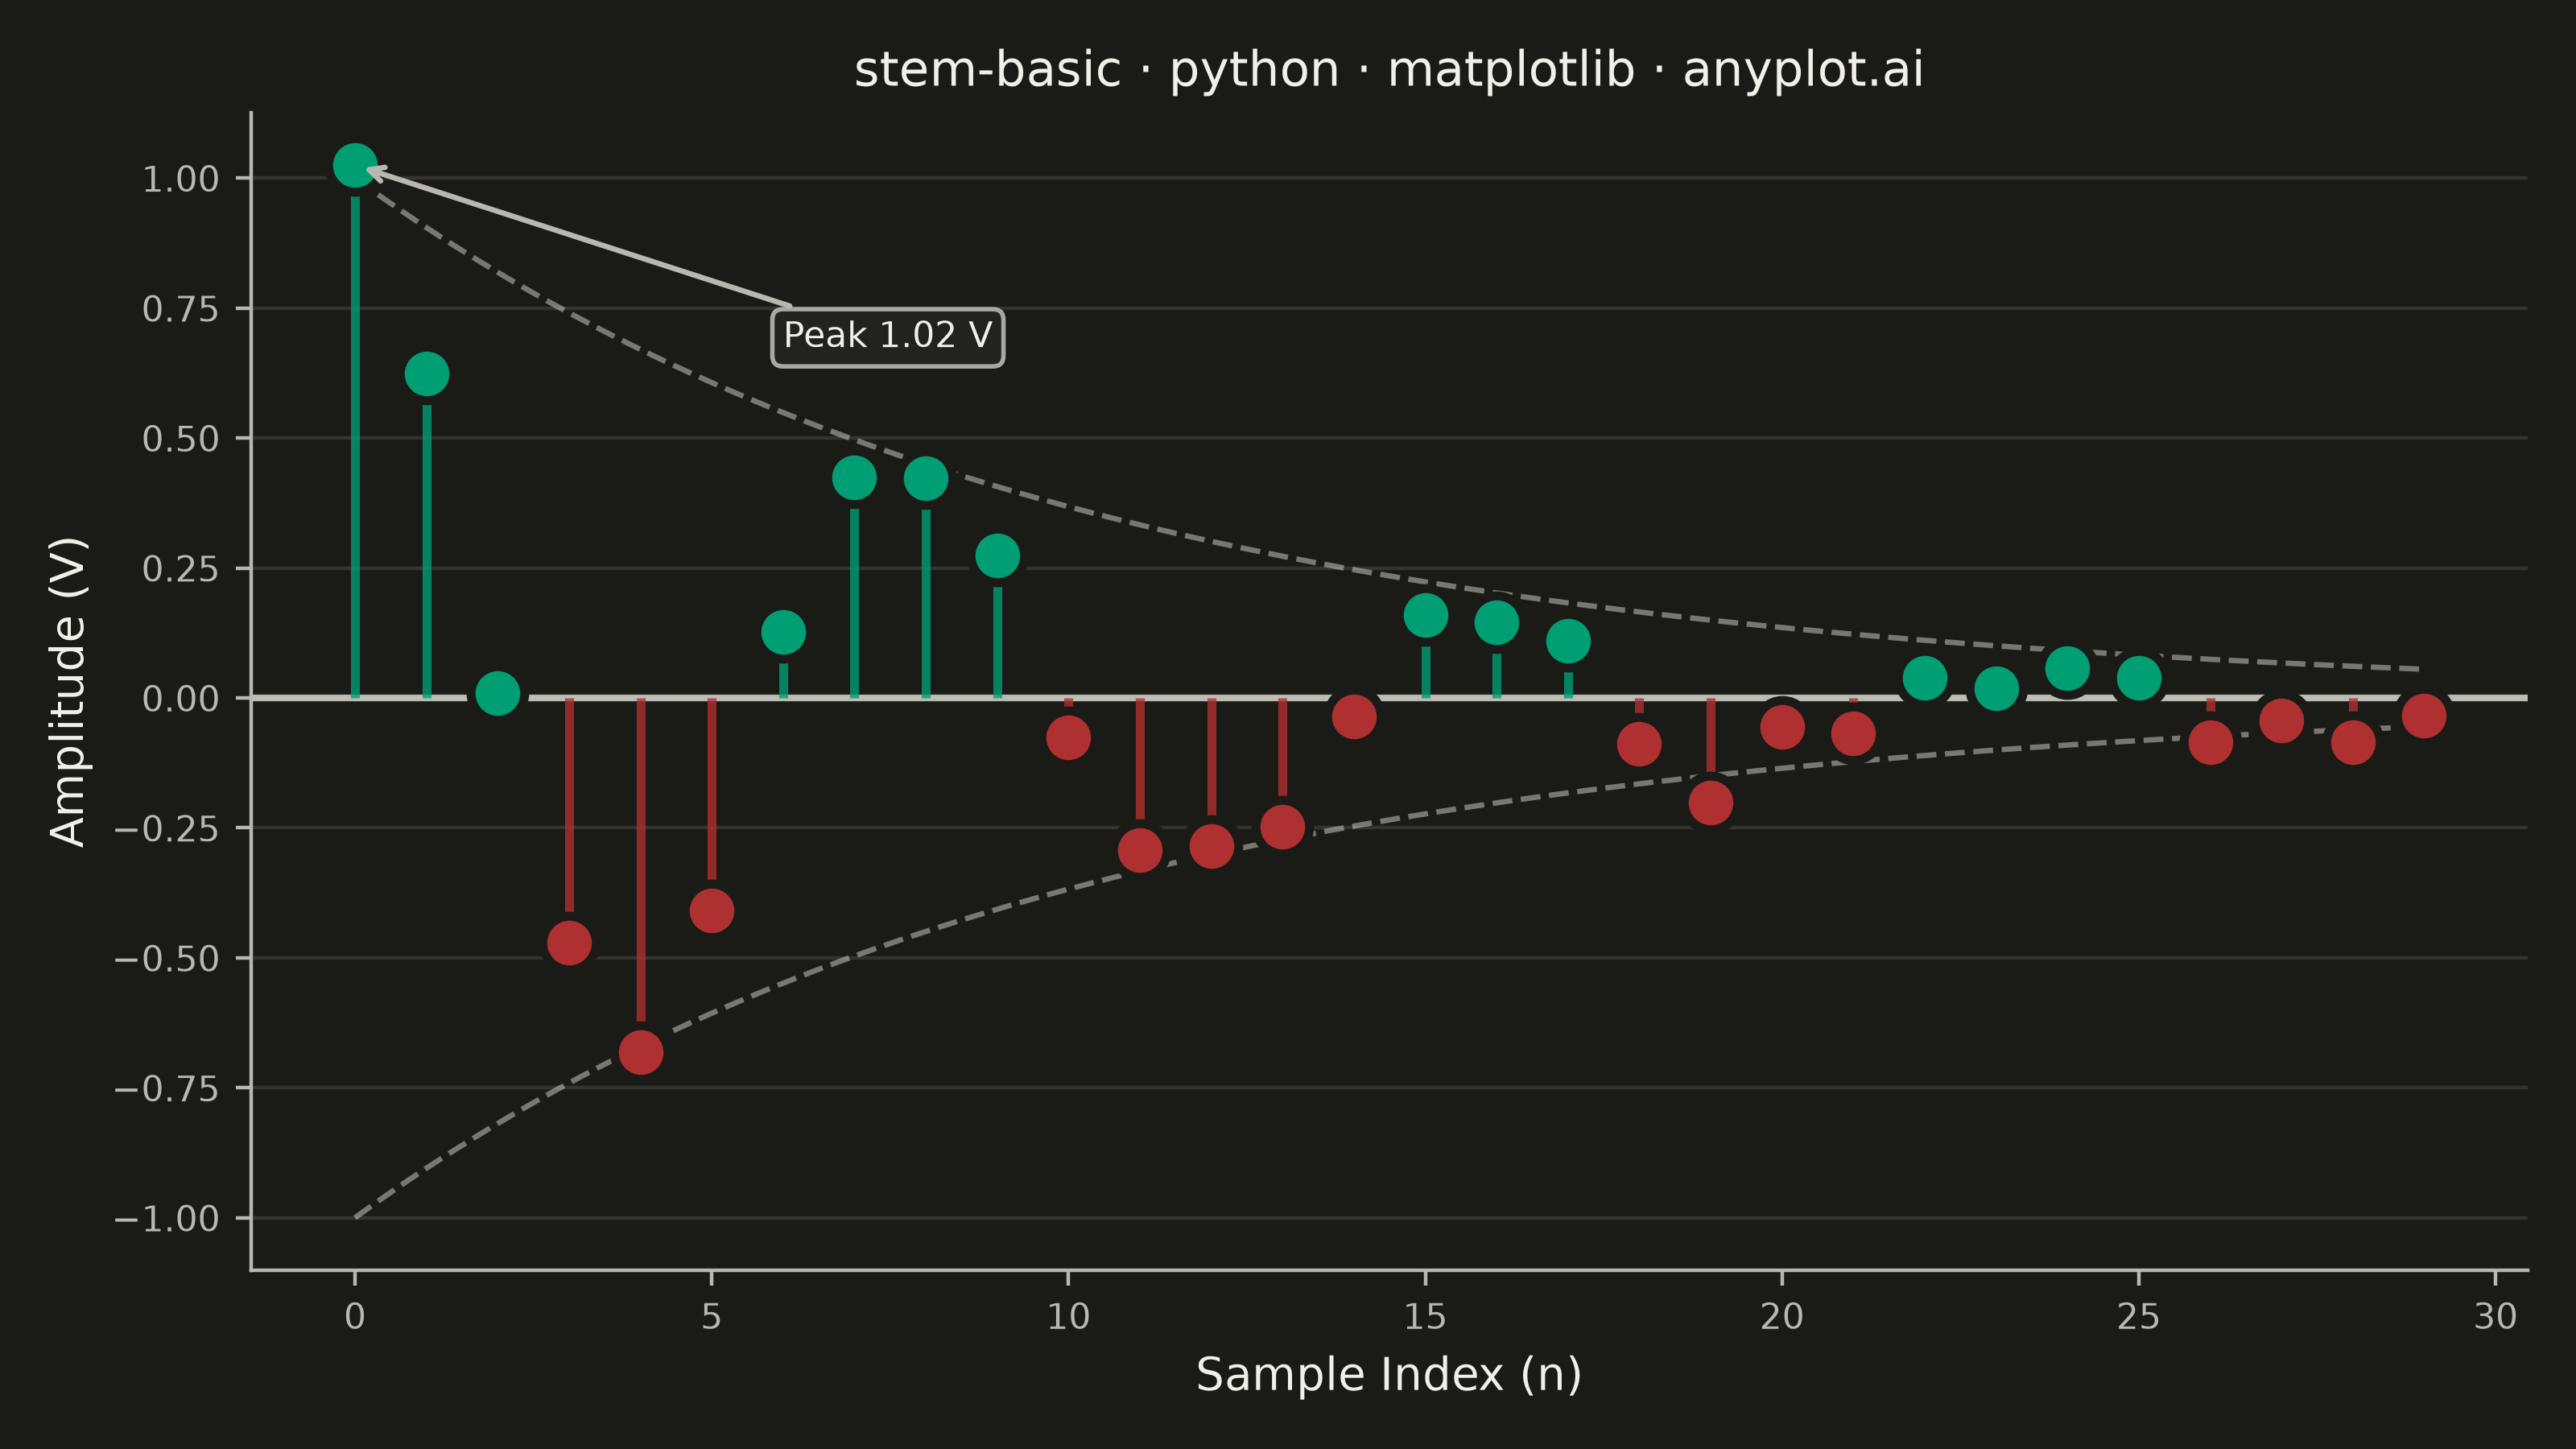
A stem plot displays data points as markers connected to a baseline by vertical lines (stems). Each data point is represented by a marker at the data value with a thin line extending down to a baseline, making it ideal for visualizing discrete or sequential data where individual values matter. This plot type is particularly useful in signal processing and scientific applications where the discrete nature of measurements needs emphasis.
Preview render from the Matplotlib implementation.