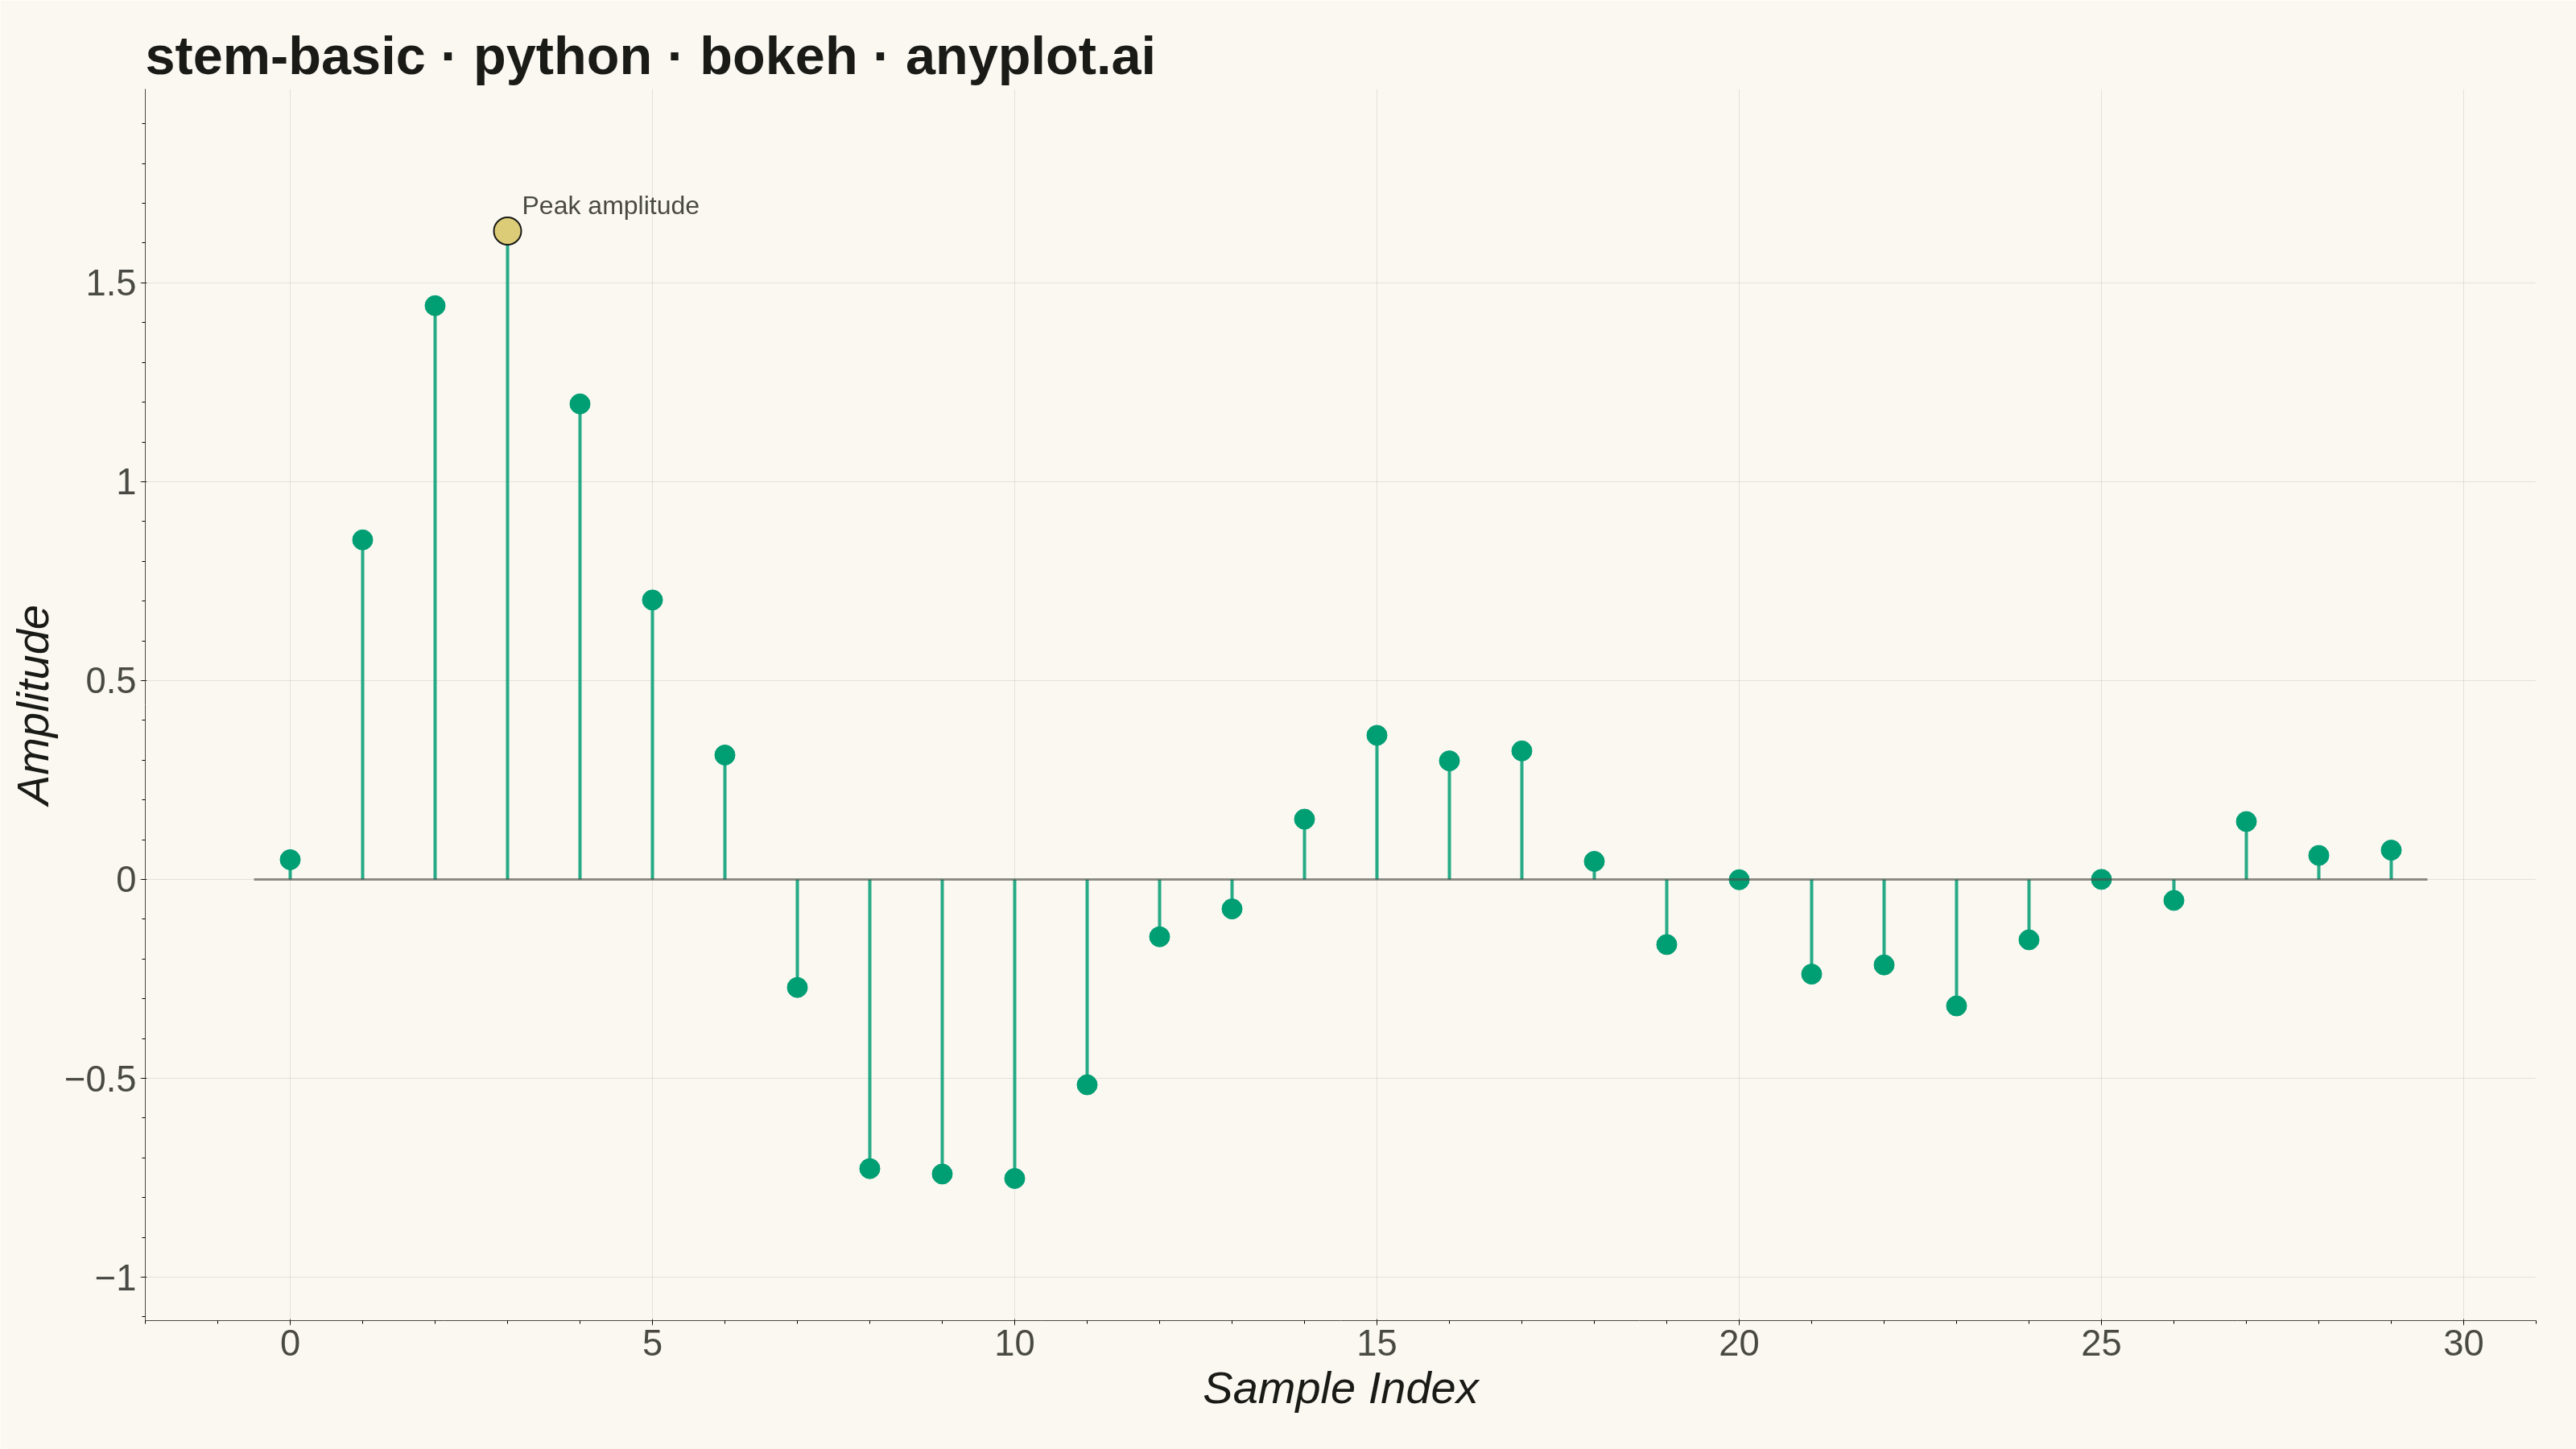
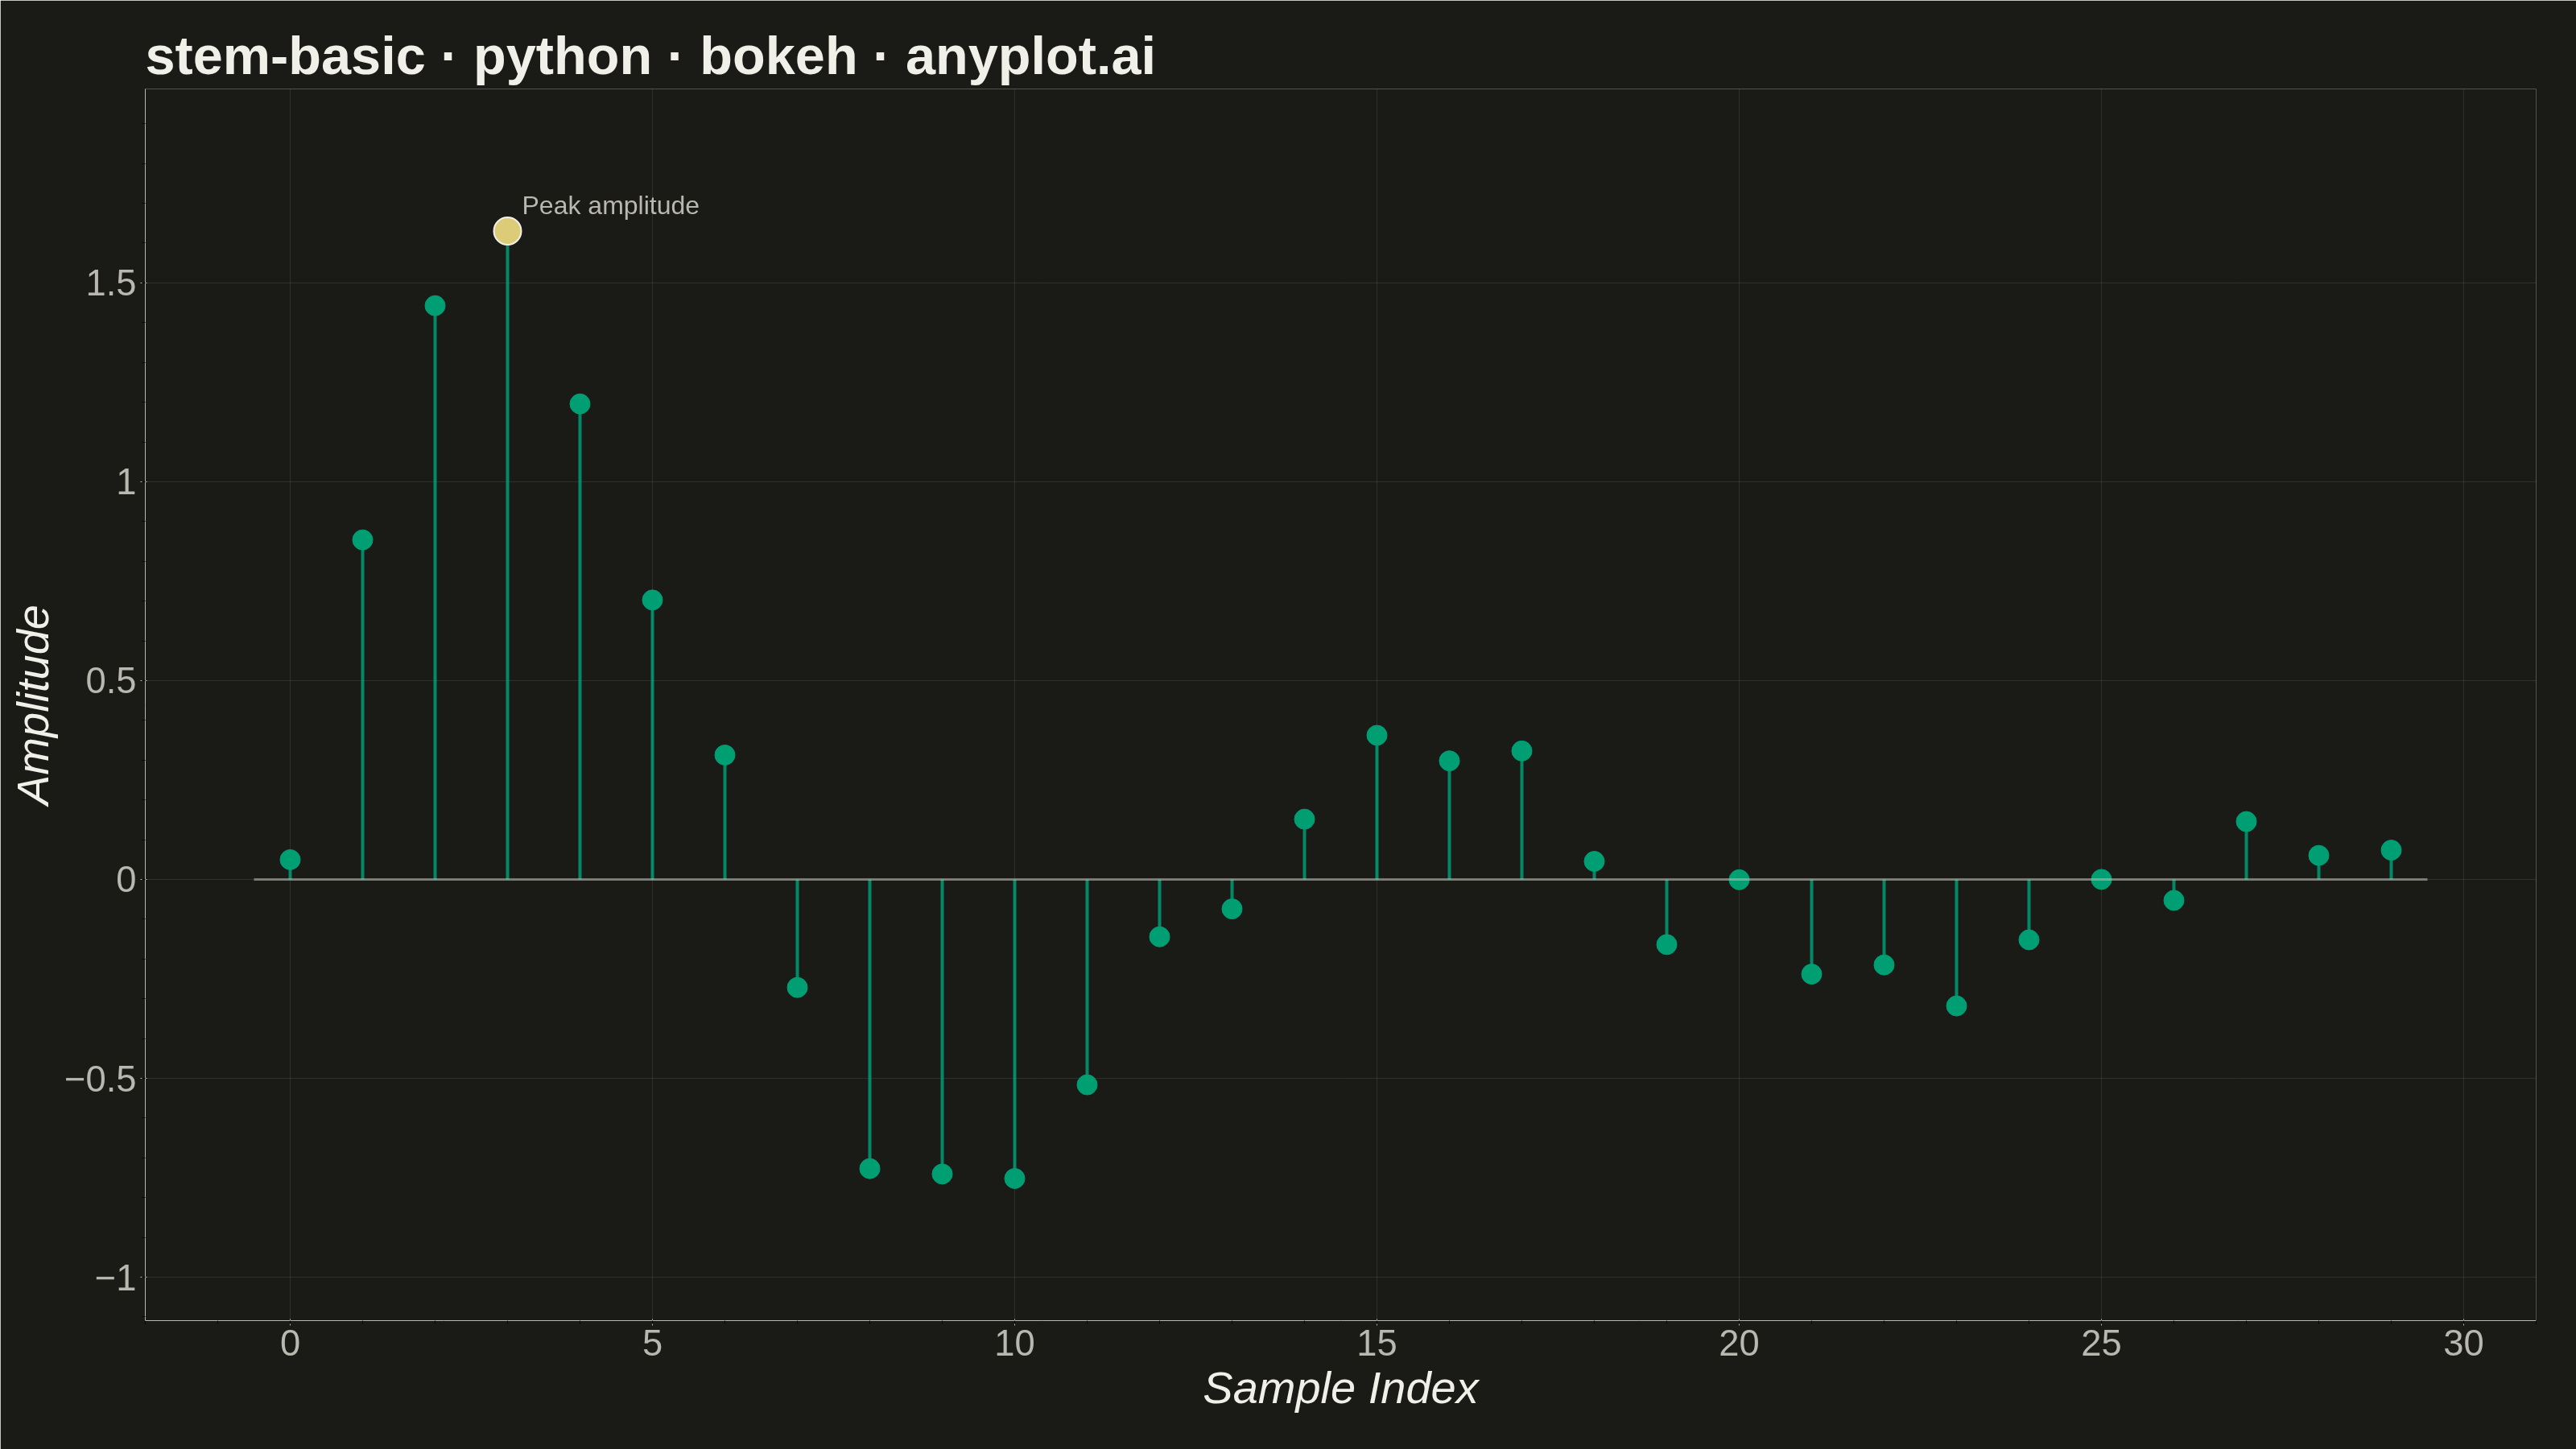
A stem plot displays data points as markers connected to a baseline by vertical lines (stems). Each data point is represented by a marker at the data value with a thin line extending down to a baseline, making it ideal for visualizing discrete or sequential data where individual values matter. This plot type is particularly useful in signal processing and scientific applications where the discrete nature of measurements needs emphasis.
""" anyplot.ai
stem-basic: Basic Stem Plot
Library: bokeh 3.9.2 | Python 3.13.14
Quality: 89/100 | Updated: 2026-07-25
"""

import os
import sys
import time
from pathlib import Path


sys.path = [p for p in sys.path if not p.endswith("/python")]

import numpy as np
from bokeh.io import output_file, save
from bokeh.models import ColumnDataSource, HoverTool, Label, Range1d
from bokeh.plotting import figure
from selenium import webdriver
from selenium.webdriver.chrome.options import Options


# Theme tokens
THEME = os.getenv("ANYPLOT_THEME", "light")
PAGE_BG = "#FAF8F1" if THEME == "light" else "#1A1A17"
INK = "#1A1A17" if THEME == "light" else "#F0EFE8"
INK_SOFT = "#4A4A44" if THEME == "light" else "#B8B7B0"
BRAND = "#009E73"
AMBER = "#DDCC77"

# Data - Discrete signal samples (damped oscillation)
np.random.seed(42)
n_points = 30
x = np.arange(n_points)
y = np.exp(-0.1 * x) * np.sin(0.5 * x) * 2 + np.random.randn(n_points) * 0.1

baseline = 0
peak_idx = int(np.argmax(np.abs(y)))

# Create data sources
source = ColumnDataSource(data={"x": x, "y": y})
stem_source = ColumnDataSource(data={"x0": x, "y0": np.full_like(x, baseline, dtype=float), "x1": x, "y1": y})

# Create figure
W, H = 3200, 1800
p = figure(
    width=W,
    height=H,
    title="stem-basic · python · bokeh · anyplot.ai",
    x_axis_label="Sample Index",
    y_axis_label="Amplitude",
    toolbar_location=None,
    min_border_bottom=160,
    min_border_left=180,
    min_border_top=110,
    min_border_right=50,
)

# Tighten the y-range to the data extent (avoid wasted canvas space)
y_pad = (y.max() - y.min()) * 0.15
p.y_range = Range1d(start=y.min() - y_pad, end=y.max() + y_pad)

# Draw stems (vertical lines from baseline to data points)
p.segment(x0="x0", y0="y0", x1="x1", y1="y1", source=stem_source, line_width=4, color=BRAND, alpha=0.85)

# Draw markers at data points
marker_renderer = p.scatter(x="x", y="y", source=source, size=25, color=BRAND, alpha=1.0)

# Hover tooltip on markers, showcasing bokeh's interactivity in the HTML output
p.add_tools(HoverTool(renderers=[marker_renderer], tooltips=[("Sample", "@x"), ("Amplitude", "@y{0.00}")]))

# Highlight the peak-amplitude sample as a focal point
p.scatter(x=[x[peak_idx]], y=[y[peak_idx]], size=34, color=AMBER, line_color=INK, line_width=2, level="overlay")
peak_label = Label(
    x=x[peak_idx],
    y=y[peak_idx],
    x_offset=18,
    y_offset=14,
    text="Peak amplitude",
    text_font_size="24pt",
    text_color=INK_SOFT,
)
p.add_layout(peak_label)

# Draw baseline
p.line(x=[x.min() - 0.5, x.max() + 0.5], y=[baseline, baseline], line_width=3, color=INK_SOFT, alpha=0.6)

# Sizing
p.title.text_font_size = "50pt"
p.xaxis.axis_label_text_font_size = "42pt"
p.yaxis.axis_label_text_font_size = "42pt"
p.xaxis.major_label_text_font_size = "34pt"
p.yaxis.major_label_text_font_size = "34pt"

# Theme-adaptive chrome
p.background_fill_color = PAGE_BG
p.border_fill_color = PAGE_BG
p.outline_line_color = None

p.title.text_color = INK
p.xaxis.axis_label_text_color = INK
p.yaxis.axis_label_text_color = INK
p.xaxis.major_label_text_color = INK_SOFT
p.yaxis.major_label_text_color = INK_SOFT
p.xaxis.axis_line_color = INK_SOFT
p.yaxis.axis_line_color = INK_SOFT
p.xaxis.major_tick_line_color = INK_SOFT
p.yaxis.major_tick_line_color = INK_SOFT

p.xgrid.grid_line_color = INK
p.ygrid.grid_line_color = INK
p.xgrid.grid_line_alpha = 0.10
p.ygrid.grid_line_alpha = 0.10

# Save outputs: HTML via bokeh, PNG via headless Chrome screenshot.
# bokeh.io.export_png probes /usr/bin/chromedriver first, which can be an
# unusable snap shim in CI — screenshotting the saved HTML with Selenium
# sidesteps that entirely (see prompts/library/bokeh.md).
output_file(f"plot-{THEME}.html")
save(p)

opts = Options()
for arg in (
    "--headless=new",
    "--no-sandbox",
    "--disable-dev-shm-usage",
    "--disable-gpu",
    f"--window-size={W},{H}",
    "--hide-scrollbars",
):
    opts.add_argument(arg)
driver = webdriver.Chrome(options=opts)
driver.set_window_size(W, H)
driver.get(f"file://{Path(f'plot-{THEME}.html').resolve()}")
driver.execute_cdp_cmd(
    "Emulation.setDeviceMetricsOverride", {"width": W, "height": H, "deviceScaleFactor": 1, "mobile": False}
)
time.sleep(3)
driver.save_screenshot(f"plot-{THEME}.png")
driver.quit()
Runnable source as JSON, for any HTTP client: https://api.anyplot.ai/specs/stem-basic/bokeh/code. Any spec id and library id listed in llms-full.txt fit the same URL shape; every URL below is complete and callable.
{
  "spec_id": "stem-basic",
  "language": "python",
  "library": "bokeh",
  "page": "https://anyplot.ai/stem-basic/python/bokeh",
  "hub": "https://anyplot.ai/stem-basic",
  "code_json": "https://api.anyplot.ai/specs/stem-basic/bokeh/code",
  "spec_json": "https://api.anyplot.ai/specs/stem-basic",
  "render_light_png": "https://storage.googleapis.com/anyplot-images/plots/stem-basic/python/bokeh/plot-light.png",
  "render_dark_png": "https://storage.googleapis.com/anyplot-images/plots/stem-basic/python/bokeh/plot-dark.png",
  "interactive_light_html": "https://storage.googleapis.com/anyplot-images/plots/stem-basic/python/bokeh/plot-light.html",
  "interactive_dark_html": "https://storage.googleapis.com/anyplot-images/plots/stem-basic/python/bokeh/plot-dark.html",
  "quality_score": 89.0,
  "license": "MIT",
  "guide": "https://anyplot.ai/llms.txt"
}
Part of Basic Stem Plot on anyplot.ai.