The same plot in 14 other libraries — Python: Altair, Bokeh, lets-plot, Matplotlib, Plotly, plotnine, Pygal, Seaborn; R: ggplot2; JavaScript: Chart.js, D3.js, Apache ECharts, Highcharts, MUI X Charts. Compare all 15 side by side: Basic Stem Plot in Python, R, Julia and JavaScript.
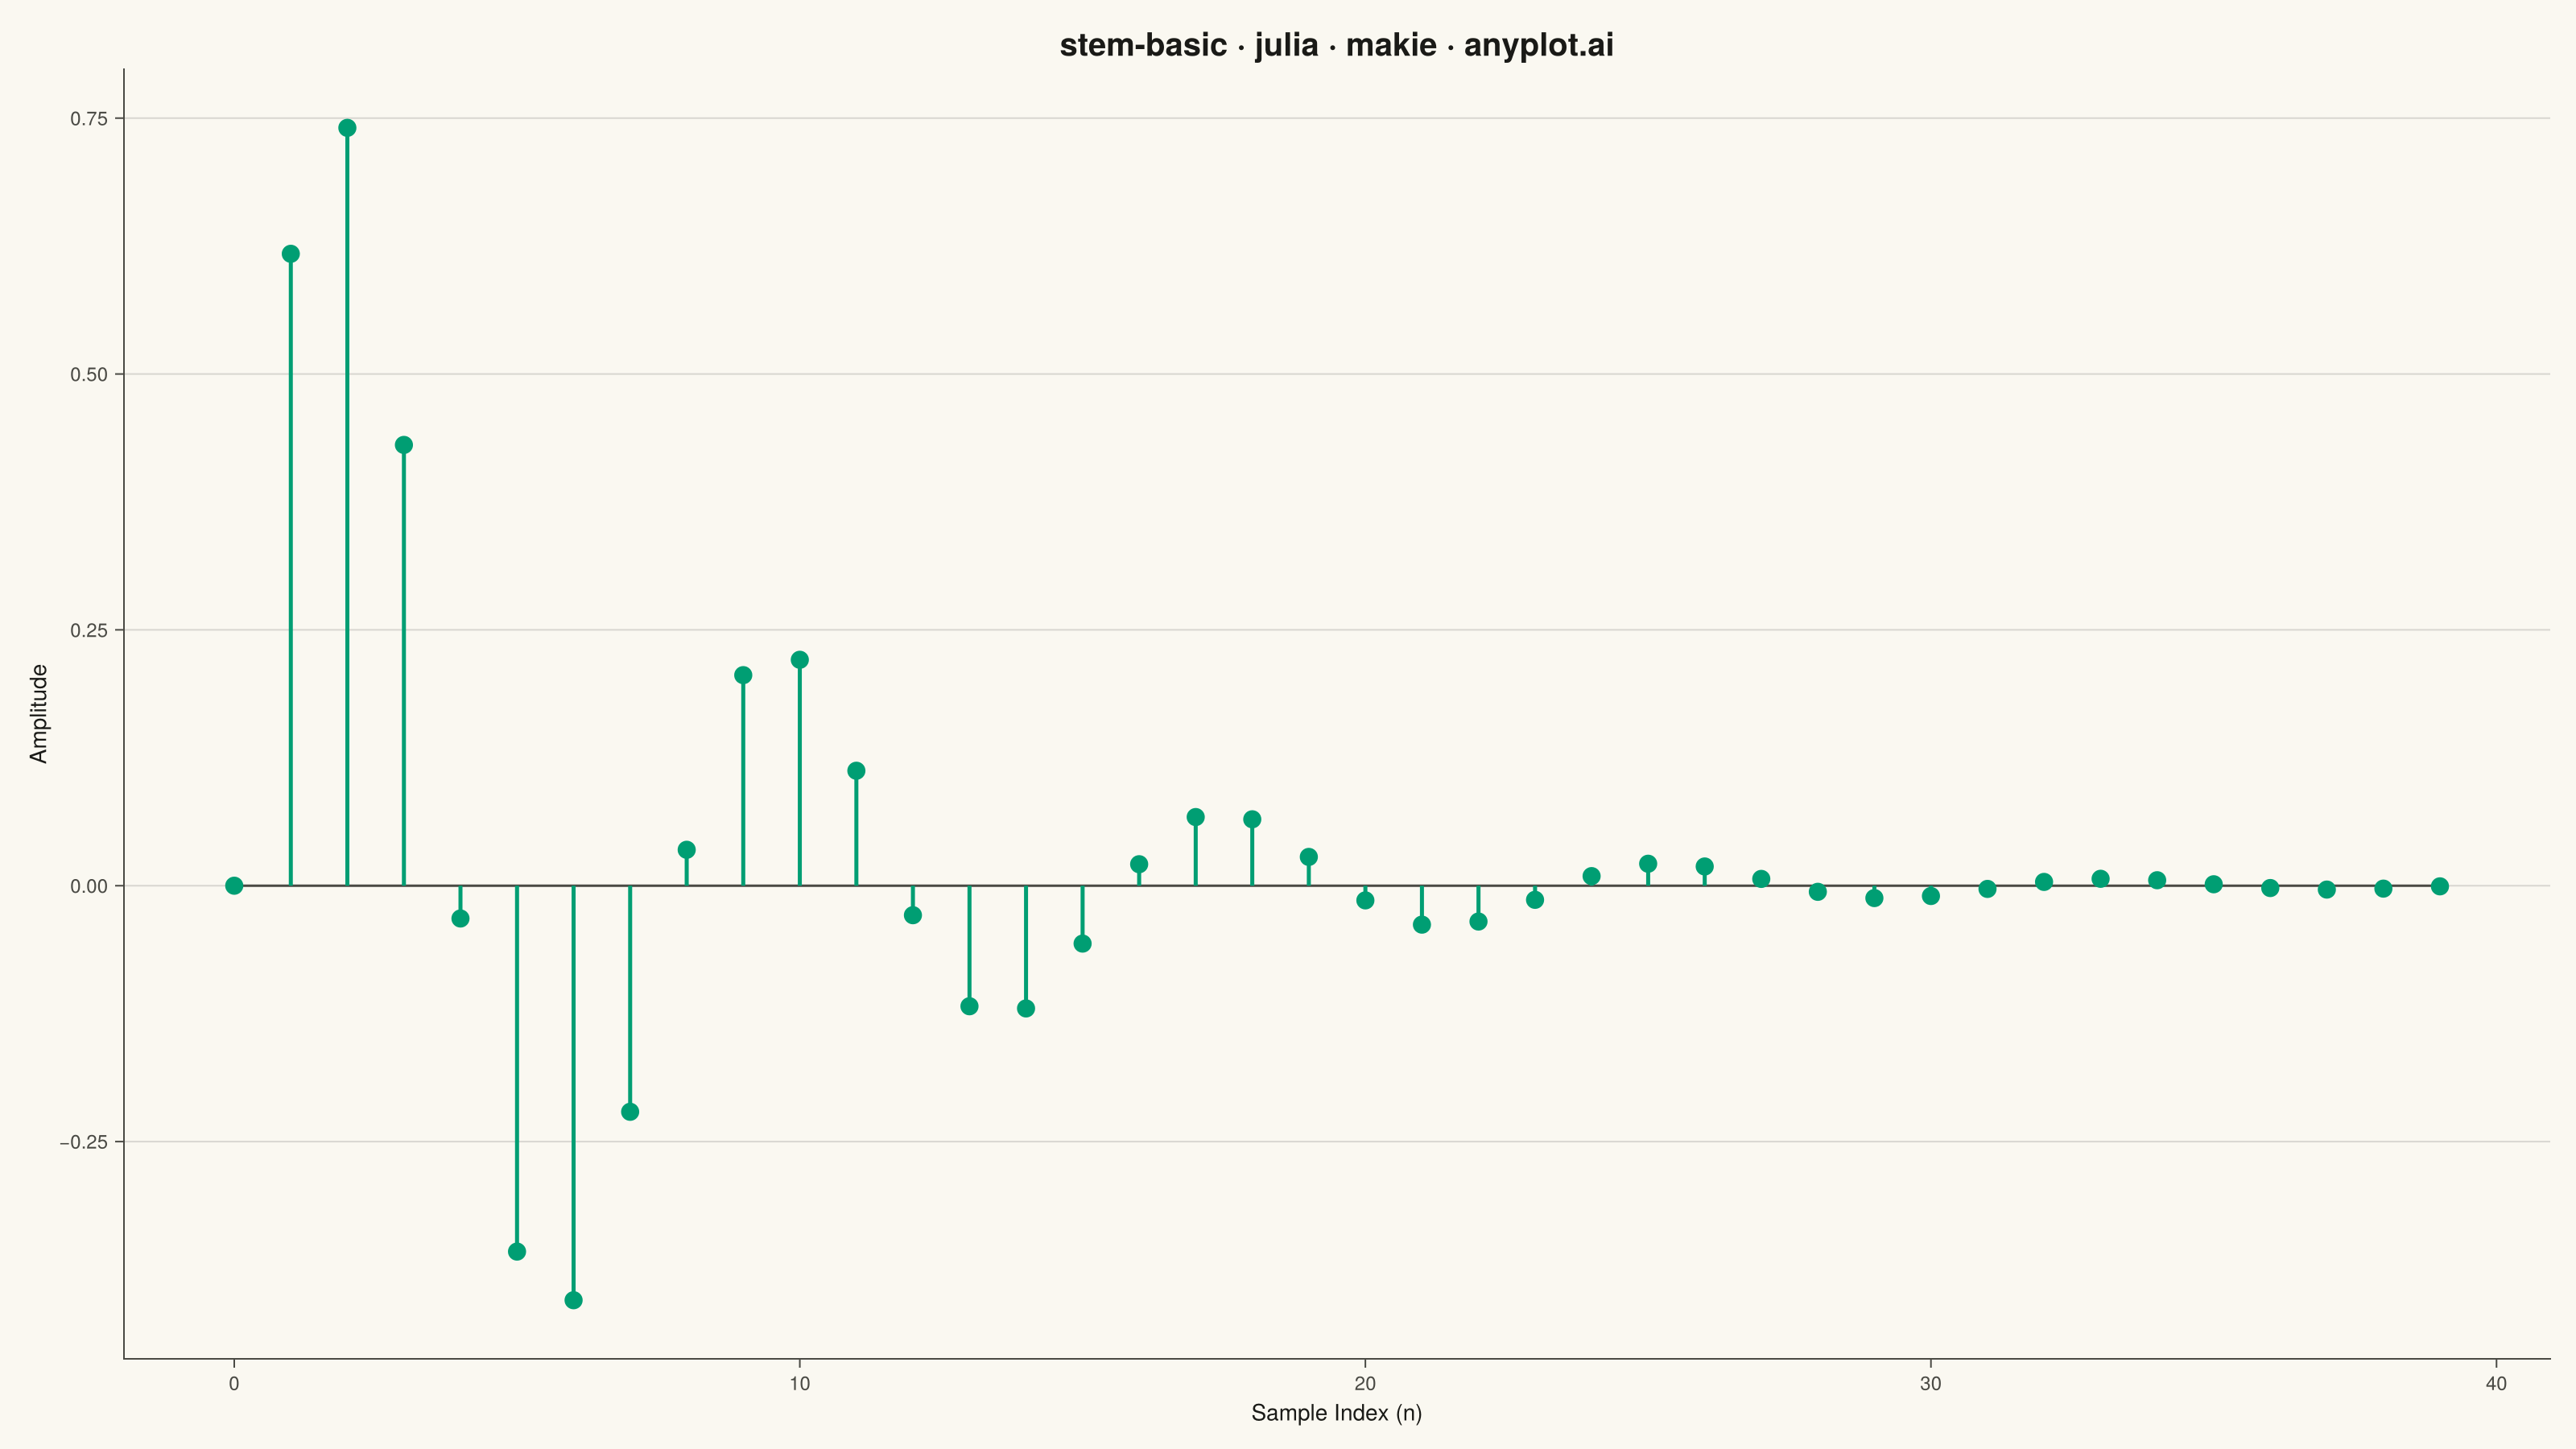
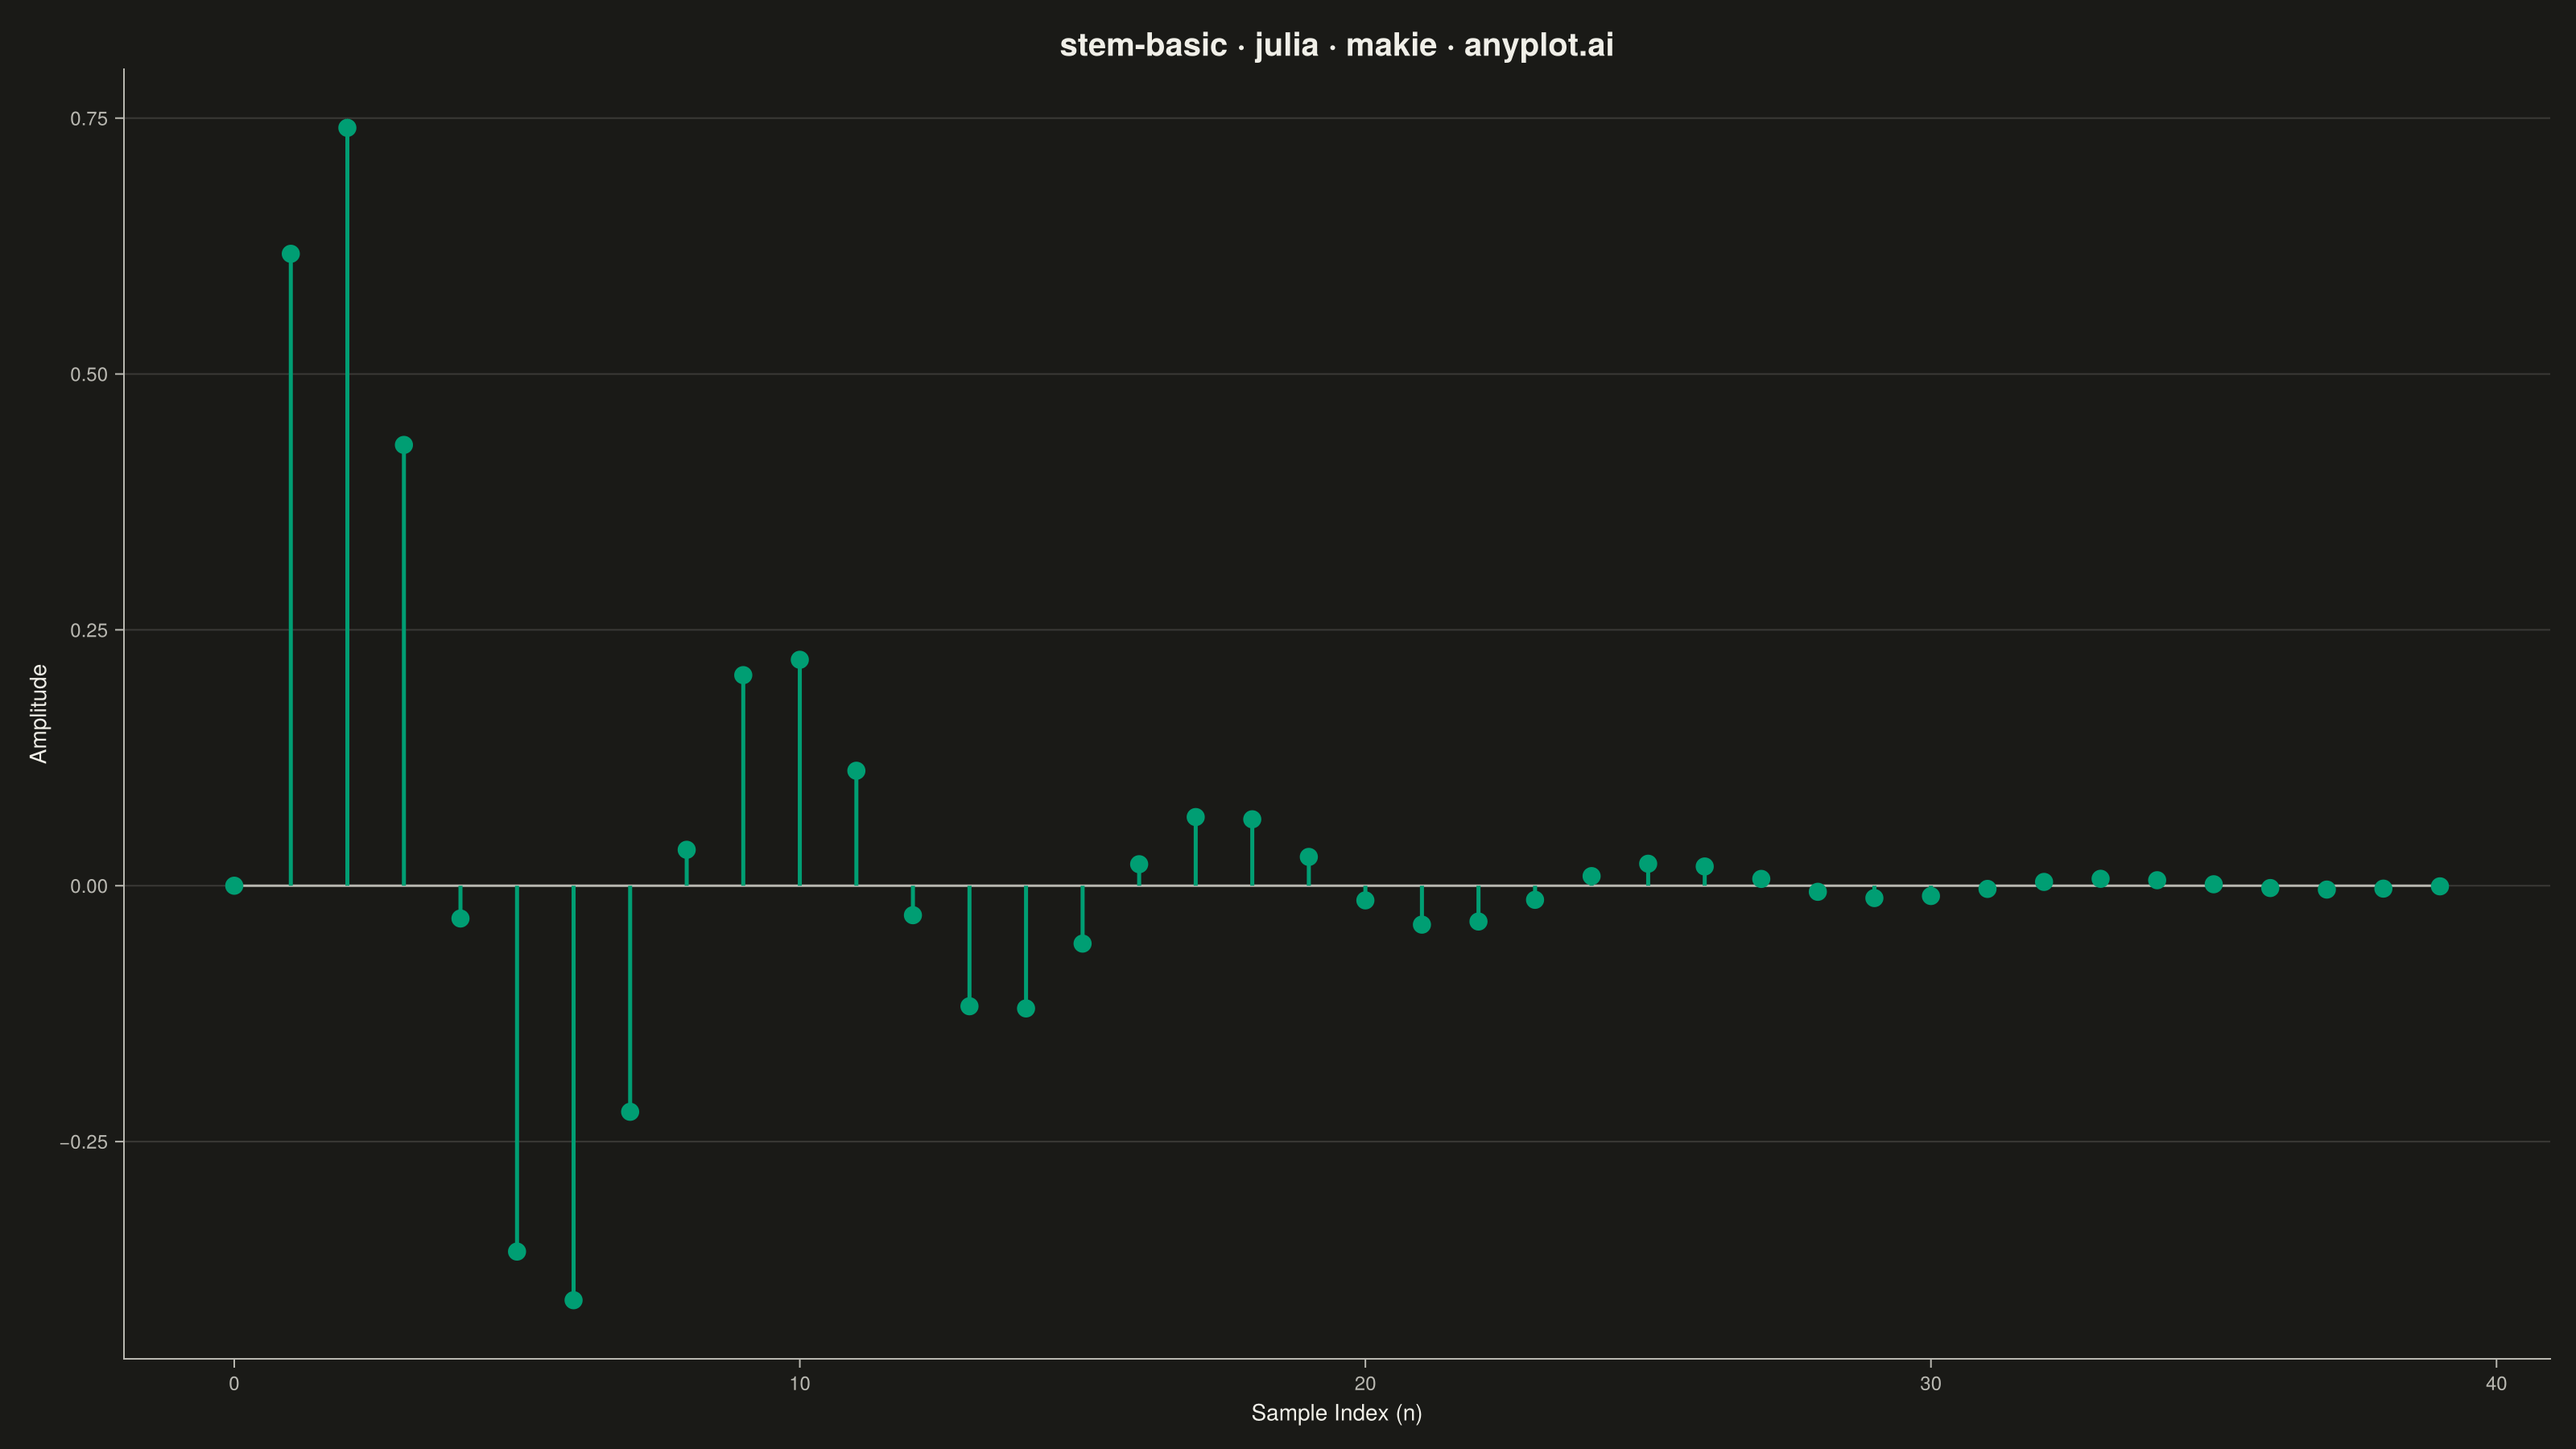
A stem plot displays data points as markers connected to a baseline by vertical lines (stems). Each data point is represented by a marker at the data value with a thin line extending down to a baseline, making it ideal for visualizing discrete or sequential data where individual values matter. This plot type is particularly useful in signal processing and scientific applications where the discrete nature of measurements needs emphasis.
# anyplot.ai
# stem-basic: Basic Stem Plot
# Library: makie 0.21.9 | Julia 1.11.9
# Quality: 87/100 | Created: 2026-07-25

using CairoMakie
using Colors

# Theme tokens (see prompts/default-style-guide.md "Background" + "Theme-adaptive Chrome")
const THEME    = get(ENV, "ANYPLOT_THEME", "light")
const PAGE_BG  = THEME == "light" ? colorant"#FAF8F1" : colorant"#1A1A17"
const INK      = THEME == "light" ? colorant"#1A1A17" : colorant"#F0EFE8"
const INK_SOFT = THEME == "light" ? colorant"#4A4A44" : colorant"#B8B7B0"
const BRAND    = colorant"#009E73"  # Imprint palette position 1 — ALWAYS first series

# Data — impulse response of a damped second-order system (classic DSP stem example)
# Faster decay + a trimmed sample count keep every stem visually meaningful
# (no long near-zero tail eating half the canvas)
n = 0:29
decay = exp.(-0.18 .* n)
amplitude = decay .* sin.(0.8 .* n)
peak_idx = argmax(abs.(amplitude))

# Plot
fig = Figure(
    resolution      = (1600, 900),
    fontsize        = 14,
    backgroundcolor = PAGE_BG,
)

ax = Axis(
    fig[1, 1];
    title              = "stem-basic · julia · makie · anyplot.ai",
    titlesize          = 22,
    titlefont          = :bold,
    titlecolor         = INK,
    xlabel             = "Sample Index (n)",
    ylabel             = "Amplitude",
    xlabelsize         = 14,
    ylabelsize         = 14,
    xlabelcolor        = INK,
    ylabelcolor        = INK,
    xticklabelsize     = 12,
    yticklabelsize     = 12,
    xticklabelcolor    = INK_SOFT,
    yticklabelcolor    = INK_SOFT,
    xtickcolor         = INK_SOFT,
    ytickcolor         = INK_SOFT,
    backgroundcolor    = PAGE_BG,
    topspinevisible    = false,
    rightspinevisible  = false,
    leftspinecolor     = INK_SOFT,
    bottomspinecolor   = INK_SOFT,
    ygridcolor         = RGBAf(INK.r, INK.g, INK.b, 0.12),
    xgridvisible       = false,
)

# Decay envelope — theme-neutral reference curves (Imprint "neutral" anchor) that make
# the damped-oscillation shape explicit and give the plot a deliberate focal structure
lines!(ax, n, decay; color = RGBAf(INK.r, INK.g, INK.b, 0.35), linewidth = 1.5, linestyle = :dash)
lines!(ax, n, -decay; color = RGBAf(INK.r, INK.g, INK.b, 0.35), linewidth = 1.5, linestyle = :dash)

stem!(ax, n, amplitude;
    color       = BRAND,
    stemcolor   = BRAND,
    stemwidth   = 2.5,
    marker      = :circle,
    markersize  = 16,
    strokewidth = 1.5,
    strokecolor = PAGE_BG,
    trunkcolor  = INK_SOFT,
    trunkwidth  = 1.5,
)

# Halo + label on the largest-magnitude stem — a clear, intentional focal point
scatter!(ax, [n[peak_idx]], [amplitude[peak_idx]];
    color       = (BRAND, 0.25),
    markersize  = 34,
    strokewidth = 0,
)
text!(ax, n[peak_idx], amplitude[peak_idx];
    text     = "peak: $(round(amplitude[peak_idx]; digits = 2))",
    align    = (:left, :bottom),
    offset   = (10, 10),
    fontsize = 13,
    color    = INK_SOFT,
)

# Save
save("plot-$(THEME).png", fig; px_per_unit = 2)
Runnable source as JSON, for any HTTP client: https://api.anyplot.ai/specs/stem-basic/makie/code. Any spec id and library id listed in llms-full.txt fit the same URL shape; every URL below is complete and callable.
{
  "spec_id": "stem-basic",
  "language": "julia",
  "library": "makie",
  "page": "https://anyplot.ai/stem-basic/julia/makie",
  "hub": "https://anyplot.ai/stem-basic",
  "code_json": "https://api.anyplot.ai/specs/stem-basic/makie/code",
  "spec_json": "https://api.anyplot.ai/specs/stem-basic",
  "render_light_png": "https://storage.googleapis.com/anyplot-images/plots/stem-basic/julia/makie/plot-light.png",
  "render_dark_png": "https://storage.googleapis.com/anyplot-images/plots/stem-basic/julia/makie/plot-dark.png",
  "quality_score": 87.0,
  "license": "MIT",
  "guide": "https://anyplot.ai/llms.txt"
}
Part of Basic Stem Plot on anyplot.ai.