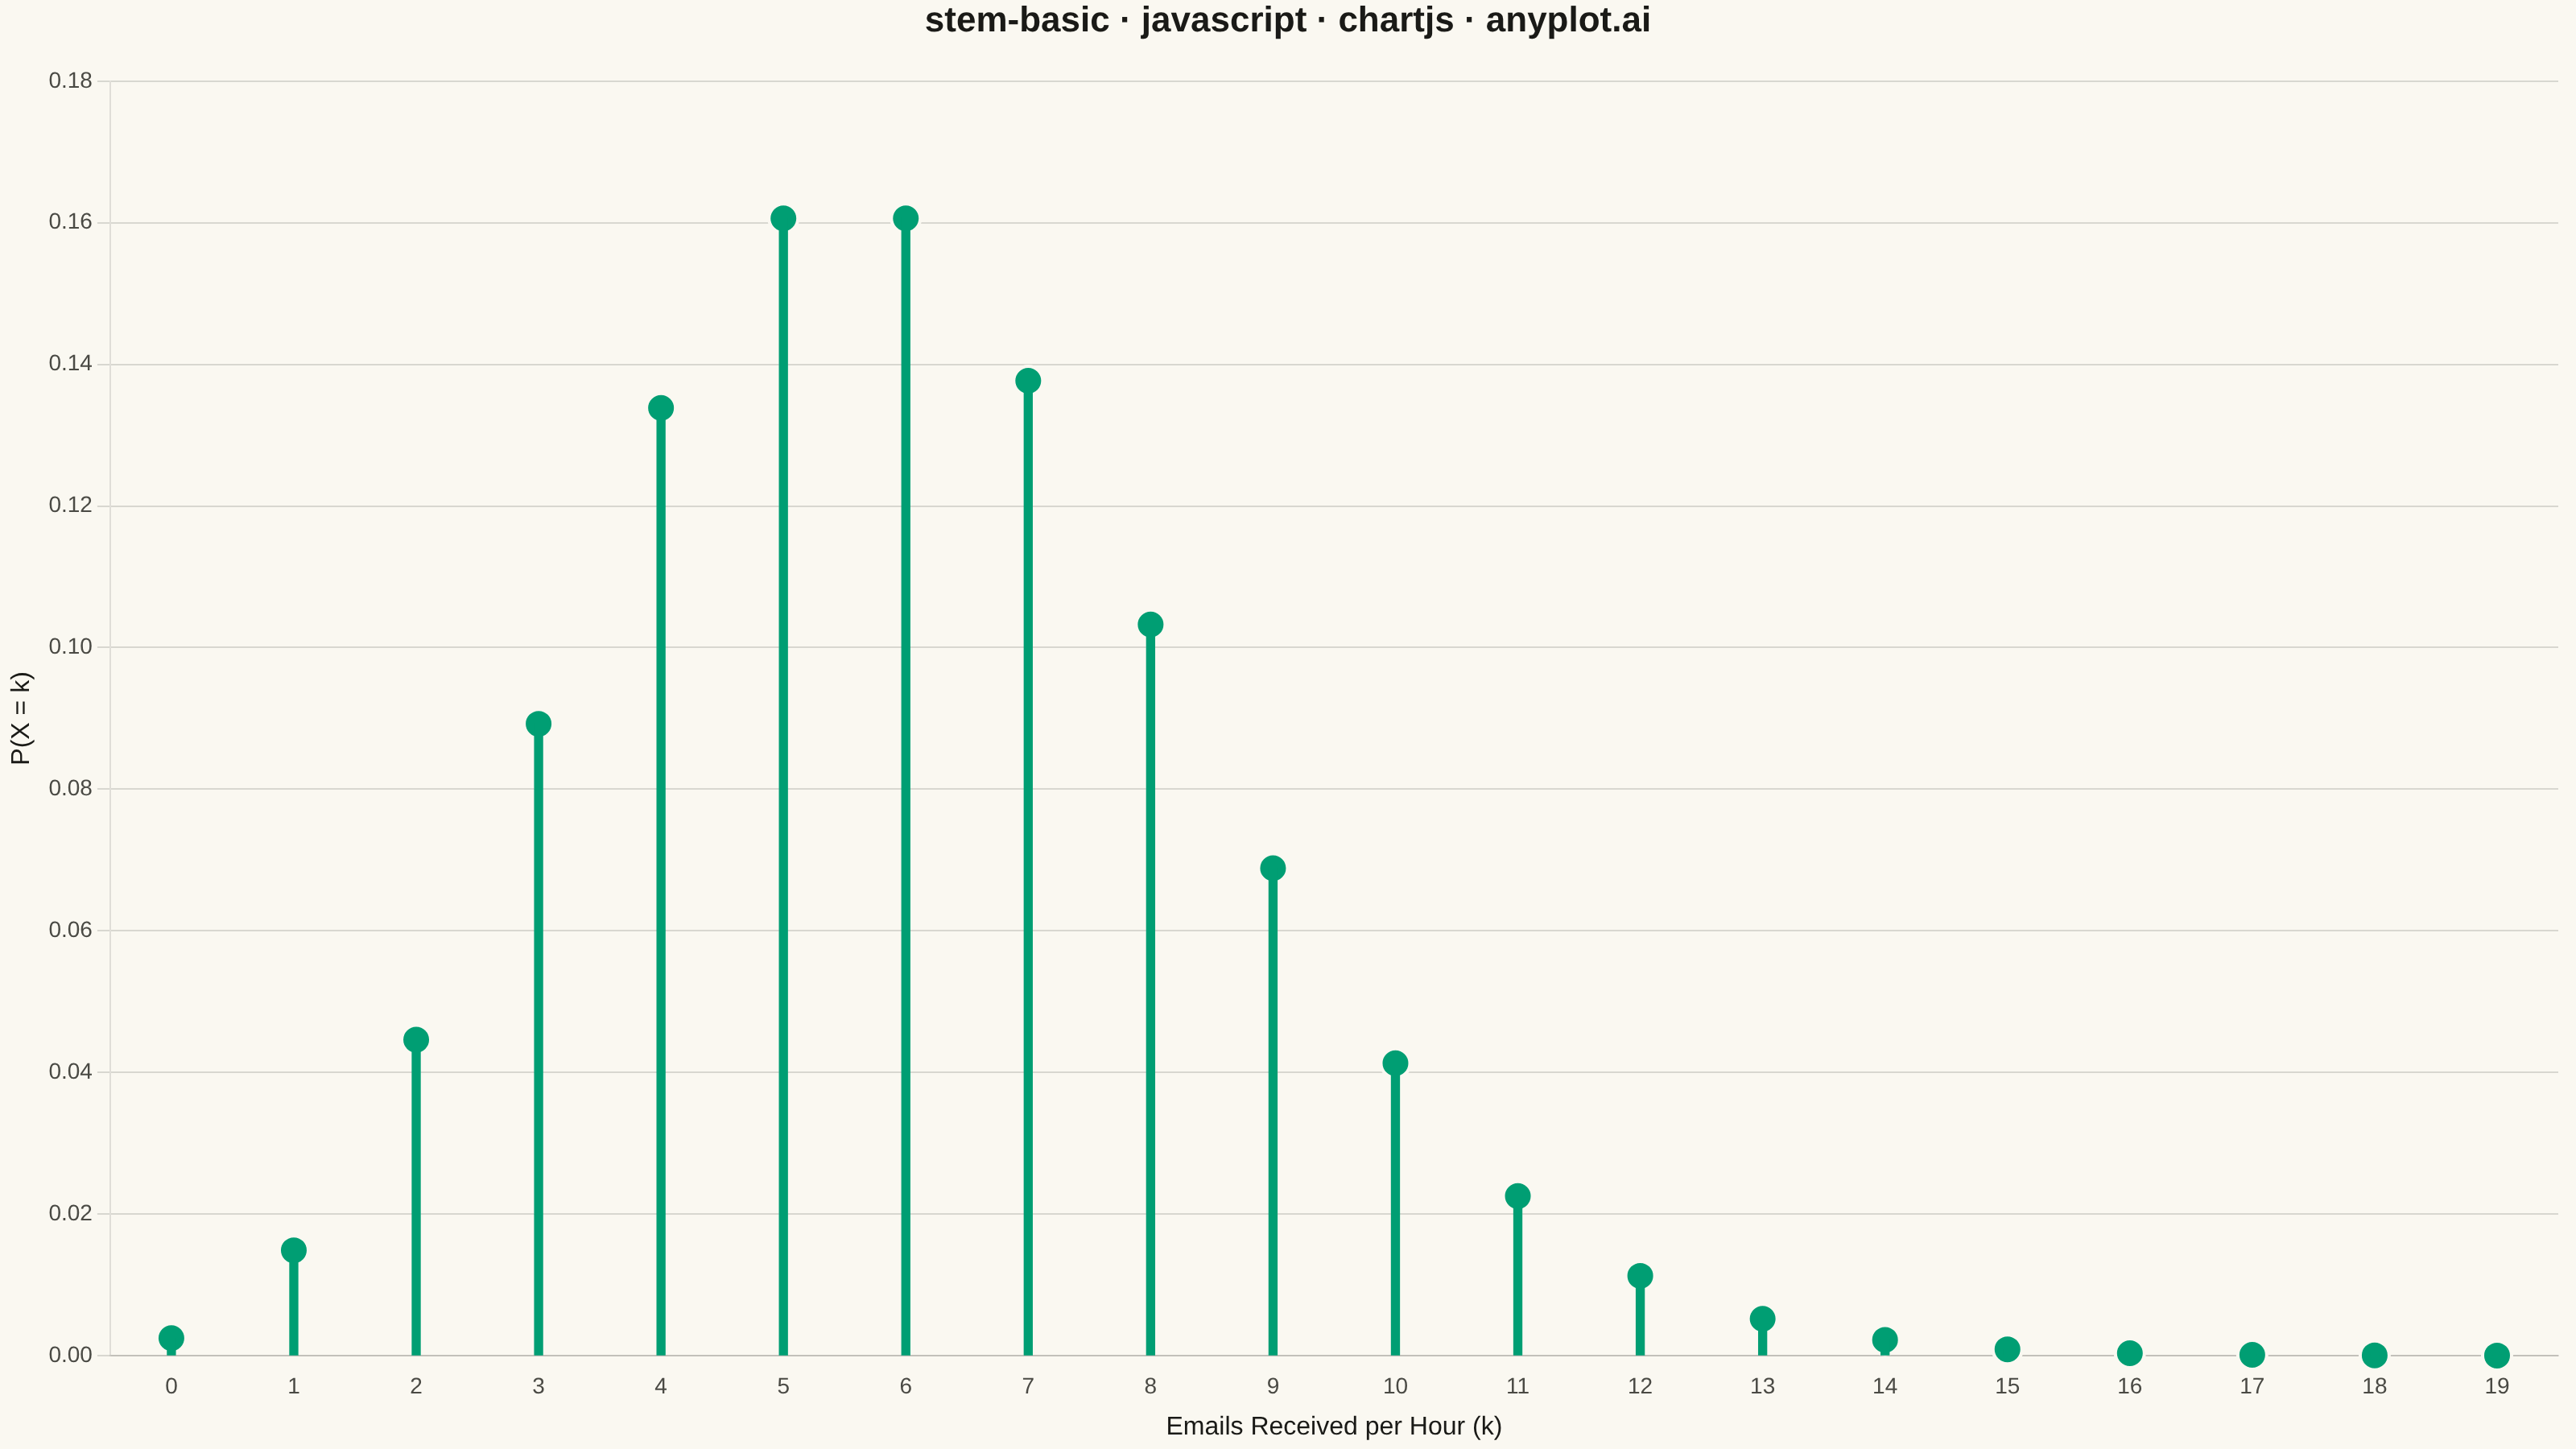
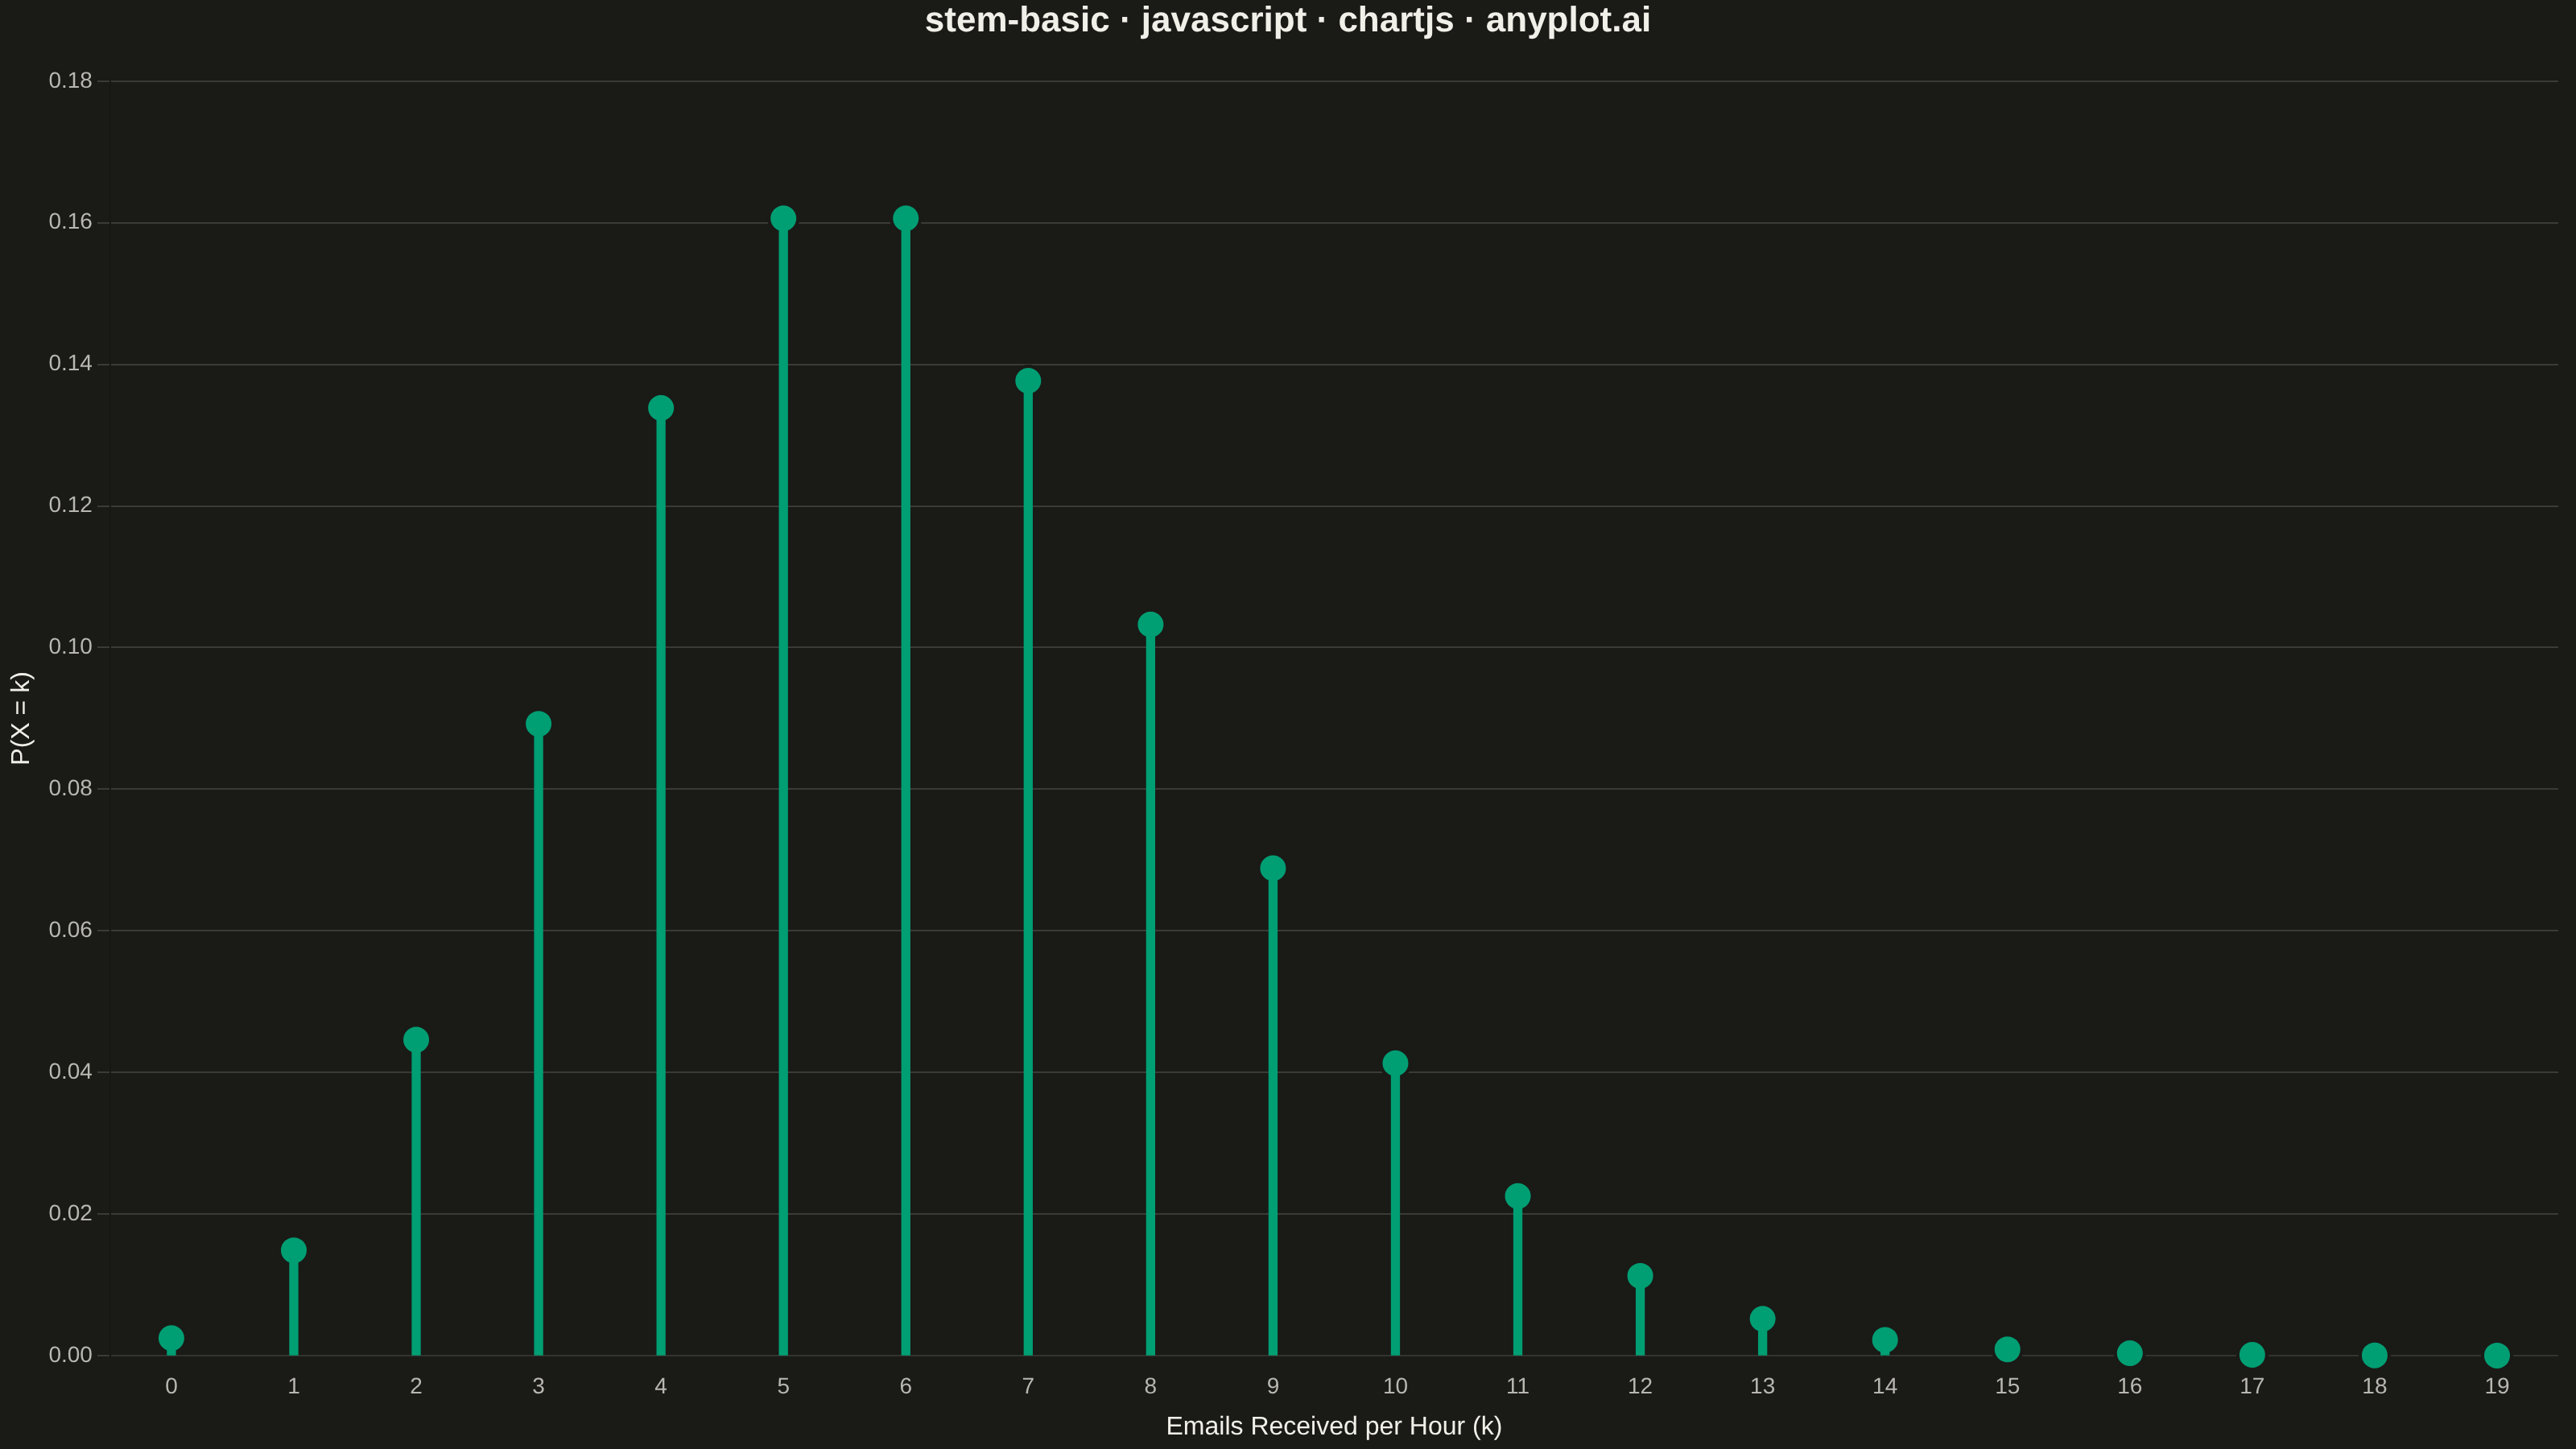
The same plot in 14 other libraries — JavaScript: D3.js, Apache ECharts, Highcharts, MUI X Charts; Python: Altair, Bokeh, lets-plot, Matplotlib, Plotly, plotnine, Pygal, Seaborn; R: ggplot2; Julia: Makie.jl. Compare all 15 side by side: Basic Stem Plot in Python, R, Julia and JavaScript.
A stem plot displays data points as markers connected to a baseline by vertical lines (stems). Each data point is represented by a marker at the data value with a thin line extending down to a baseline, making it ideal for visualizing discrete or sequential data where individual values matter. This plot type is particularly useful in signal processing and scientific applications where the discrete nature of measurements needs emphasis.
// anyplot.ai
// stem-basic: Basic Stem Plot
// Library: chartjs 4.4.7 | JavaScript 22.23.1
// Quality: 86/100 | Created: 2026-07-25

const t = window.ANYPLOT_TOKENS;

// --- Data (in-memory, deterministic) ----------------------------------------
// Poisson probability mass function, lambda = 6 emails/hour, k = 0..19.
const LAMBDA = 6;
const counts = Array.from({ length: 20 }, (_, k) => k);
const probabilities = [];
let p = Math.exp(-LAMBDA);
for (const k of counts) {
  if (k > 0) p = (p * LAMBDA) / k;
  probabilities.push(p);
}
const labels = counts.map((k) => k.toString());

// --- Mount -------------------------------------------------------------------
const canvas = document.createElement("canvas");
document.getElementById("container").appendChild(canvas);

// --- Chart (bar stems + point-only line dataset draws the markers) ----------
new Chart(canvas, {
  data: {
    labels,
    datasets: [
      {
        type: "bar",
        label: "Probability",
        data: probabilities,
        backgroundColor: t.palette[0],
        borderWidth: 0,
        barThickness: 5,
      },
      {
        type: "line",
        label: "Probability",
        data: probabilities,
        showLine: false,
        pointRadius: 9,
        pointBackgroundColor: t.palette[0],
        pointBorderColor: t.pageBg,
        pointBorderWidth: 2,
      },
    ],
  },
  options: {
    responsive: true,
    maintainAspectRatio: false,
    animation: false,
    plugins: {
      title: {
        display: true,
        text: "stem-basic · javascript · chartjs · anyplot.ai",
        color: t.ink,
        font: { size: 22 },
        padding: { bottom: 24 },
      },
      legend: { display: false },
    },
    scales: {
      x: {
        ticks: { color: t.inkSoft, font: { size: 14 } },
        grid: { display: false },
        title: { display: true, text: "Emails Received per Hour (k)", color: t.ink, font: { size: 16 } },
      },
      y: {
        beginAtZero: true,
        ticks: {
          color: t.inkSoft,
          font: { size: 14 },
          callback: (v) => v.toFixed(2),
        },
        grid: { color: t.grid },
        title: { display: true, text: "P(X = k)", color: t.ink, font: { size: 16 } },
      },
    },
  },
});
Runnable source as JSON, for any HTTP client: https://api.anyplot.ai/specs/stem-basic/chartjs/code. Any spec id and library id listed in llms-full.txt fit the same URL shape; every URL below is complete and callable.
{
  "spec_id": "stem-basic",
  "language": "javascript",
  "library": "chartjs",
  "page": "https://anyplot.ai/stem-basic/javascript/chartjs",
  "hub": "https://anyplot.ai/stem-basic",
  "code_json": "https://api.anyplot.ai/specs/stem-basic/chartjs/code",
  "spec_json": "https://api.anyplot.ai/specs/stem-basic",
  "render_light_png": "https://storage.googleapis.com/anyplot-images/plots/stem-basic/javascript/chartjs/plot-light.png",
  "render_dark_png": "https://storage.googleapis.com/anyplot-images/plots/stem-basic/javascript/chartjs/plot-dark.png",
  "interactive_light_html": "https://storage.googleapis.com/anyplot-images/plots/stem-basic/javascript/chartjs/plot-light.html",
  "interactive_dark_html": "https://storage.googleapis.com/anyplot-images/plots/stem-basic/javascript/chartjs/plot-dark.html",
  "quality_score": 86.0,
  "license": "MIT",
  "guide": "https://anyplot.ai/llms.txt"
}
Part of Basic Stem Plot on anyplot.ai.