The same plot in 14 other libraries — JavaScript: D3.js, Apache ECharts, Highcharts, MUI X Charts; Python: Altair, Bokeh, lets-plot, Matplotlib, Plotly, plotnine, Pygal, Seaborn; R: ggplot2; Julia: Makie.jl. Compare all 15 side by side: Basic Streamline Plot in Python, R, Julia and JavaScript.
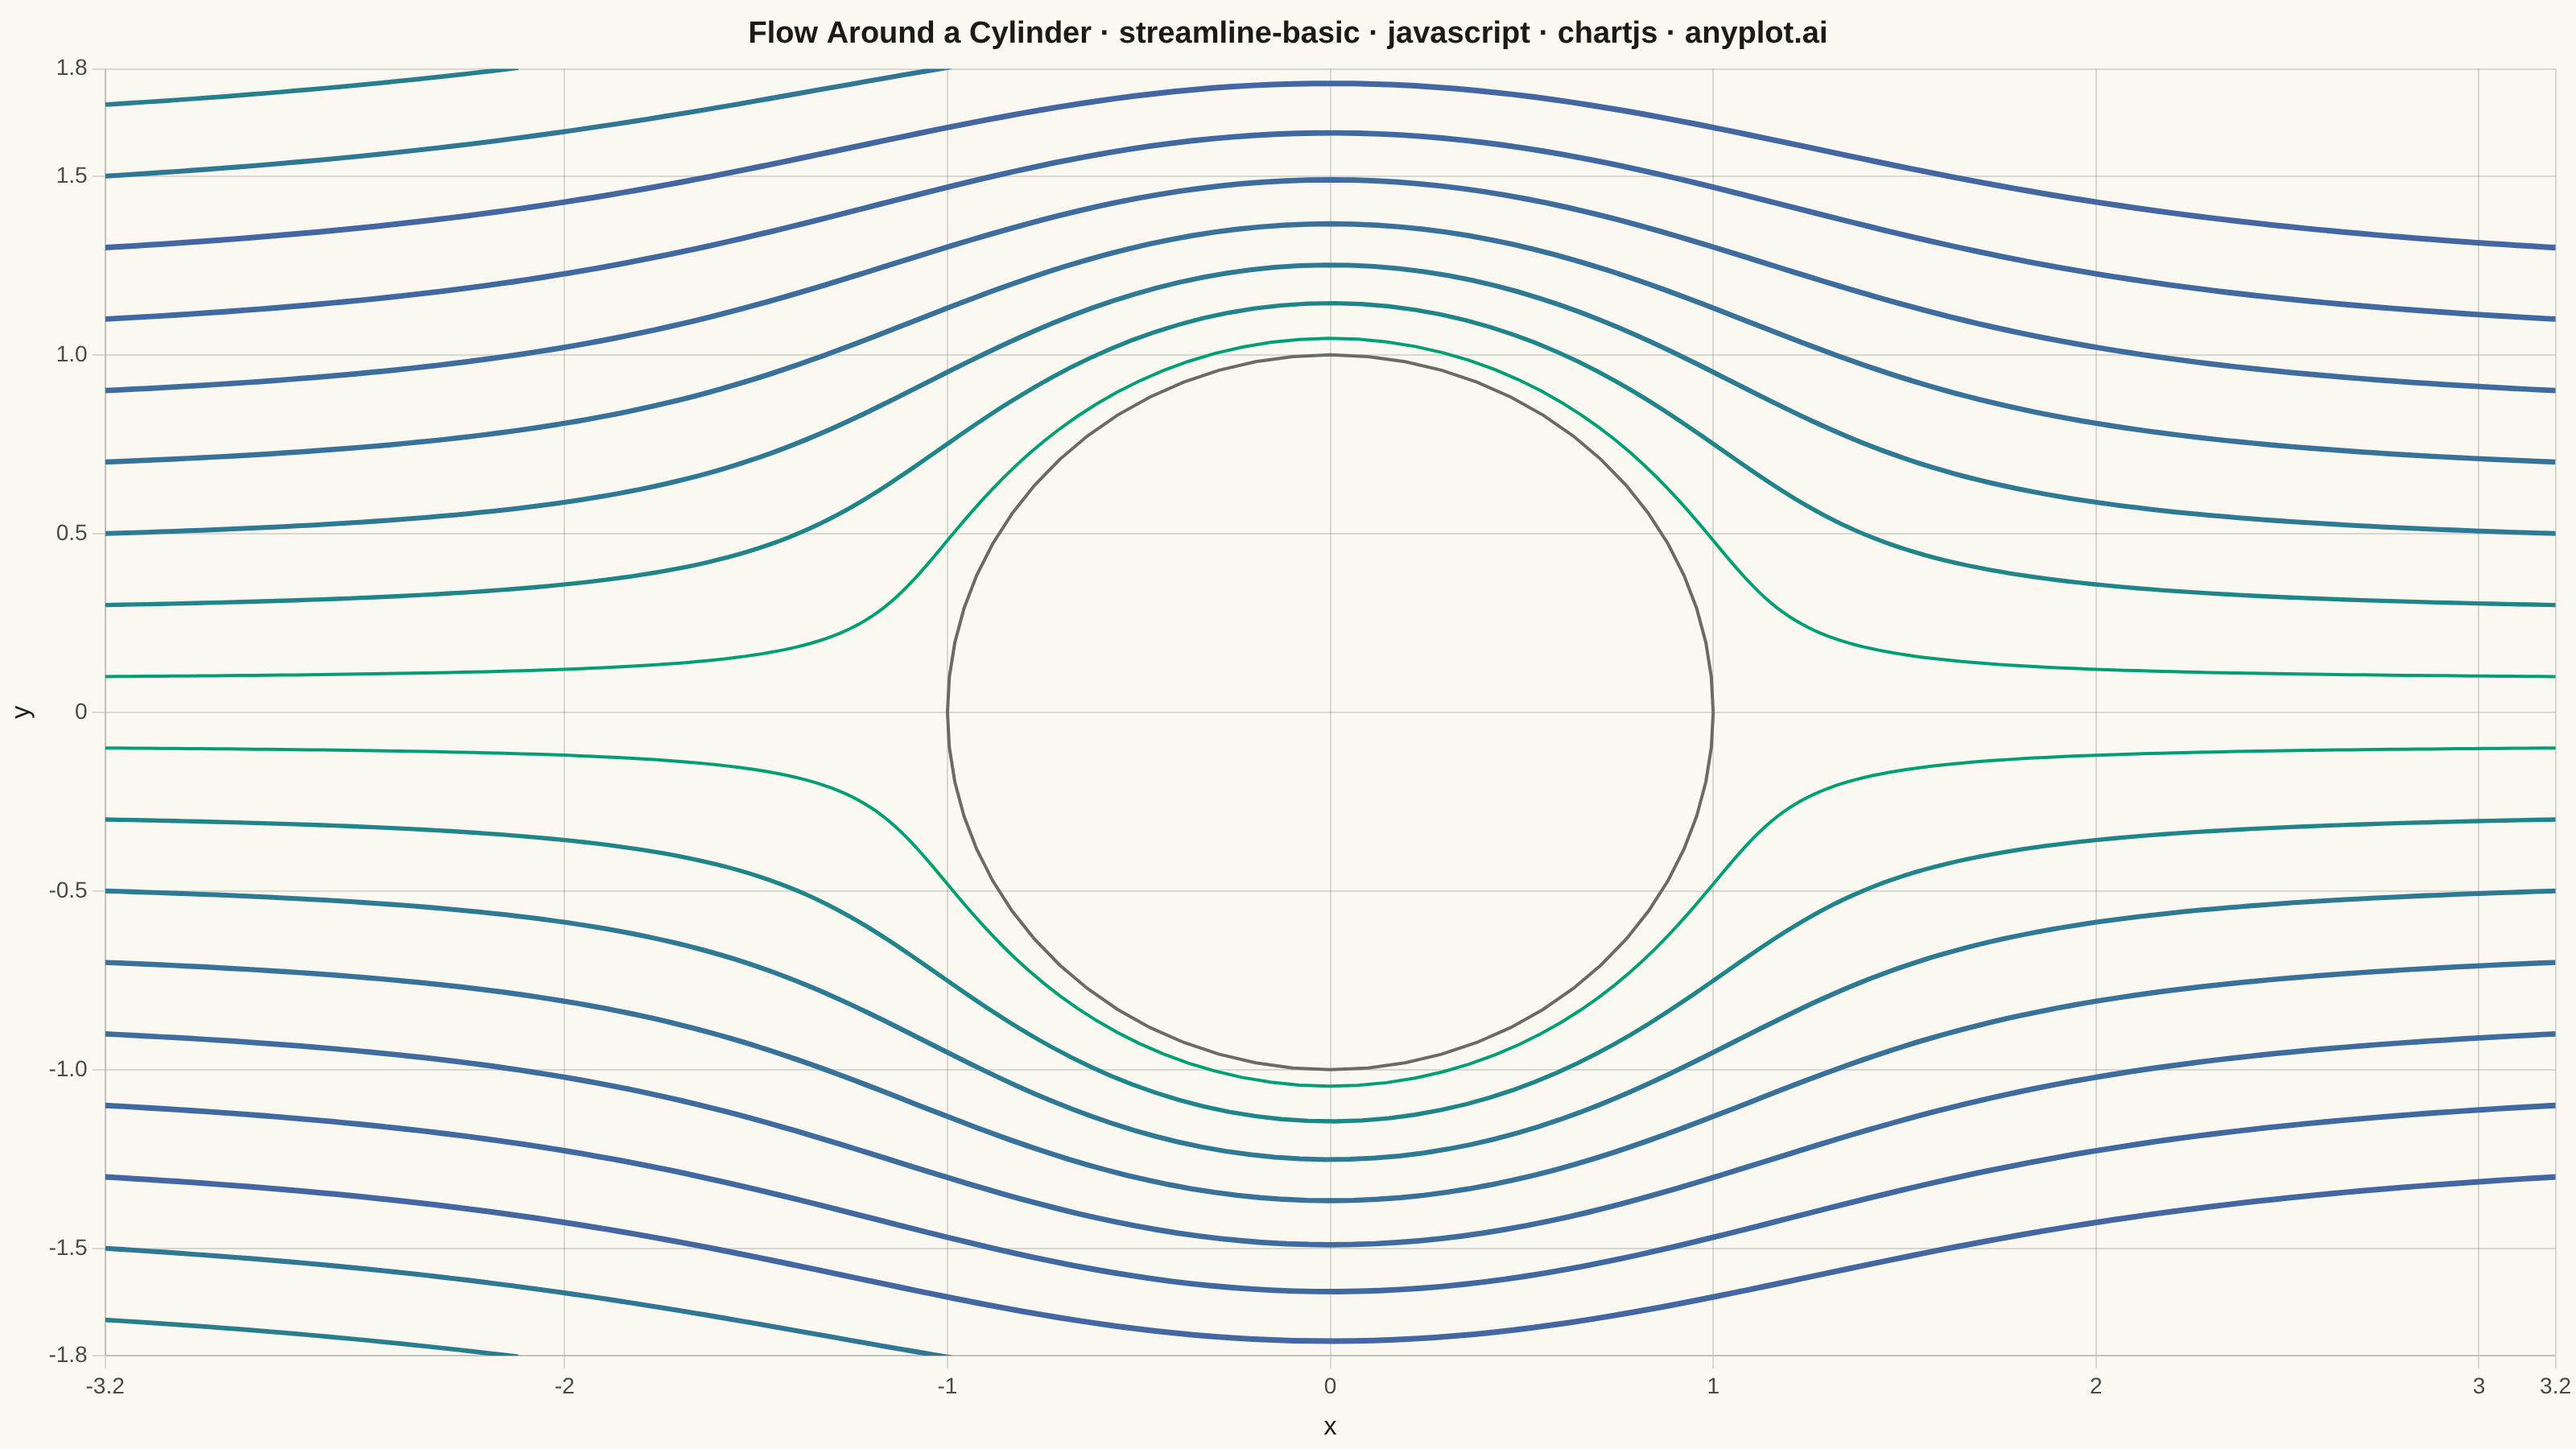
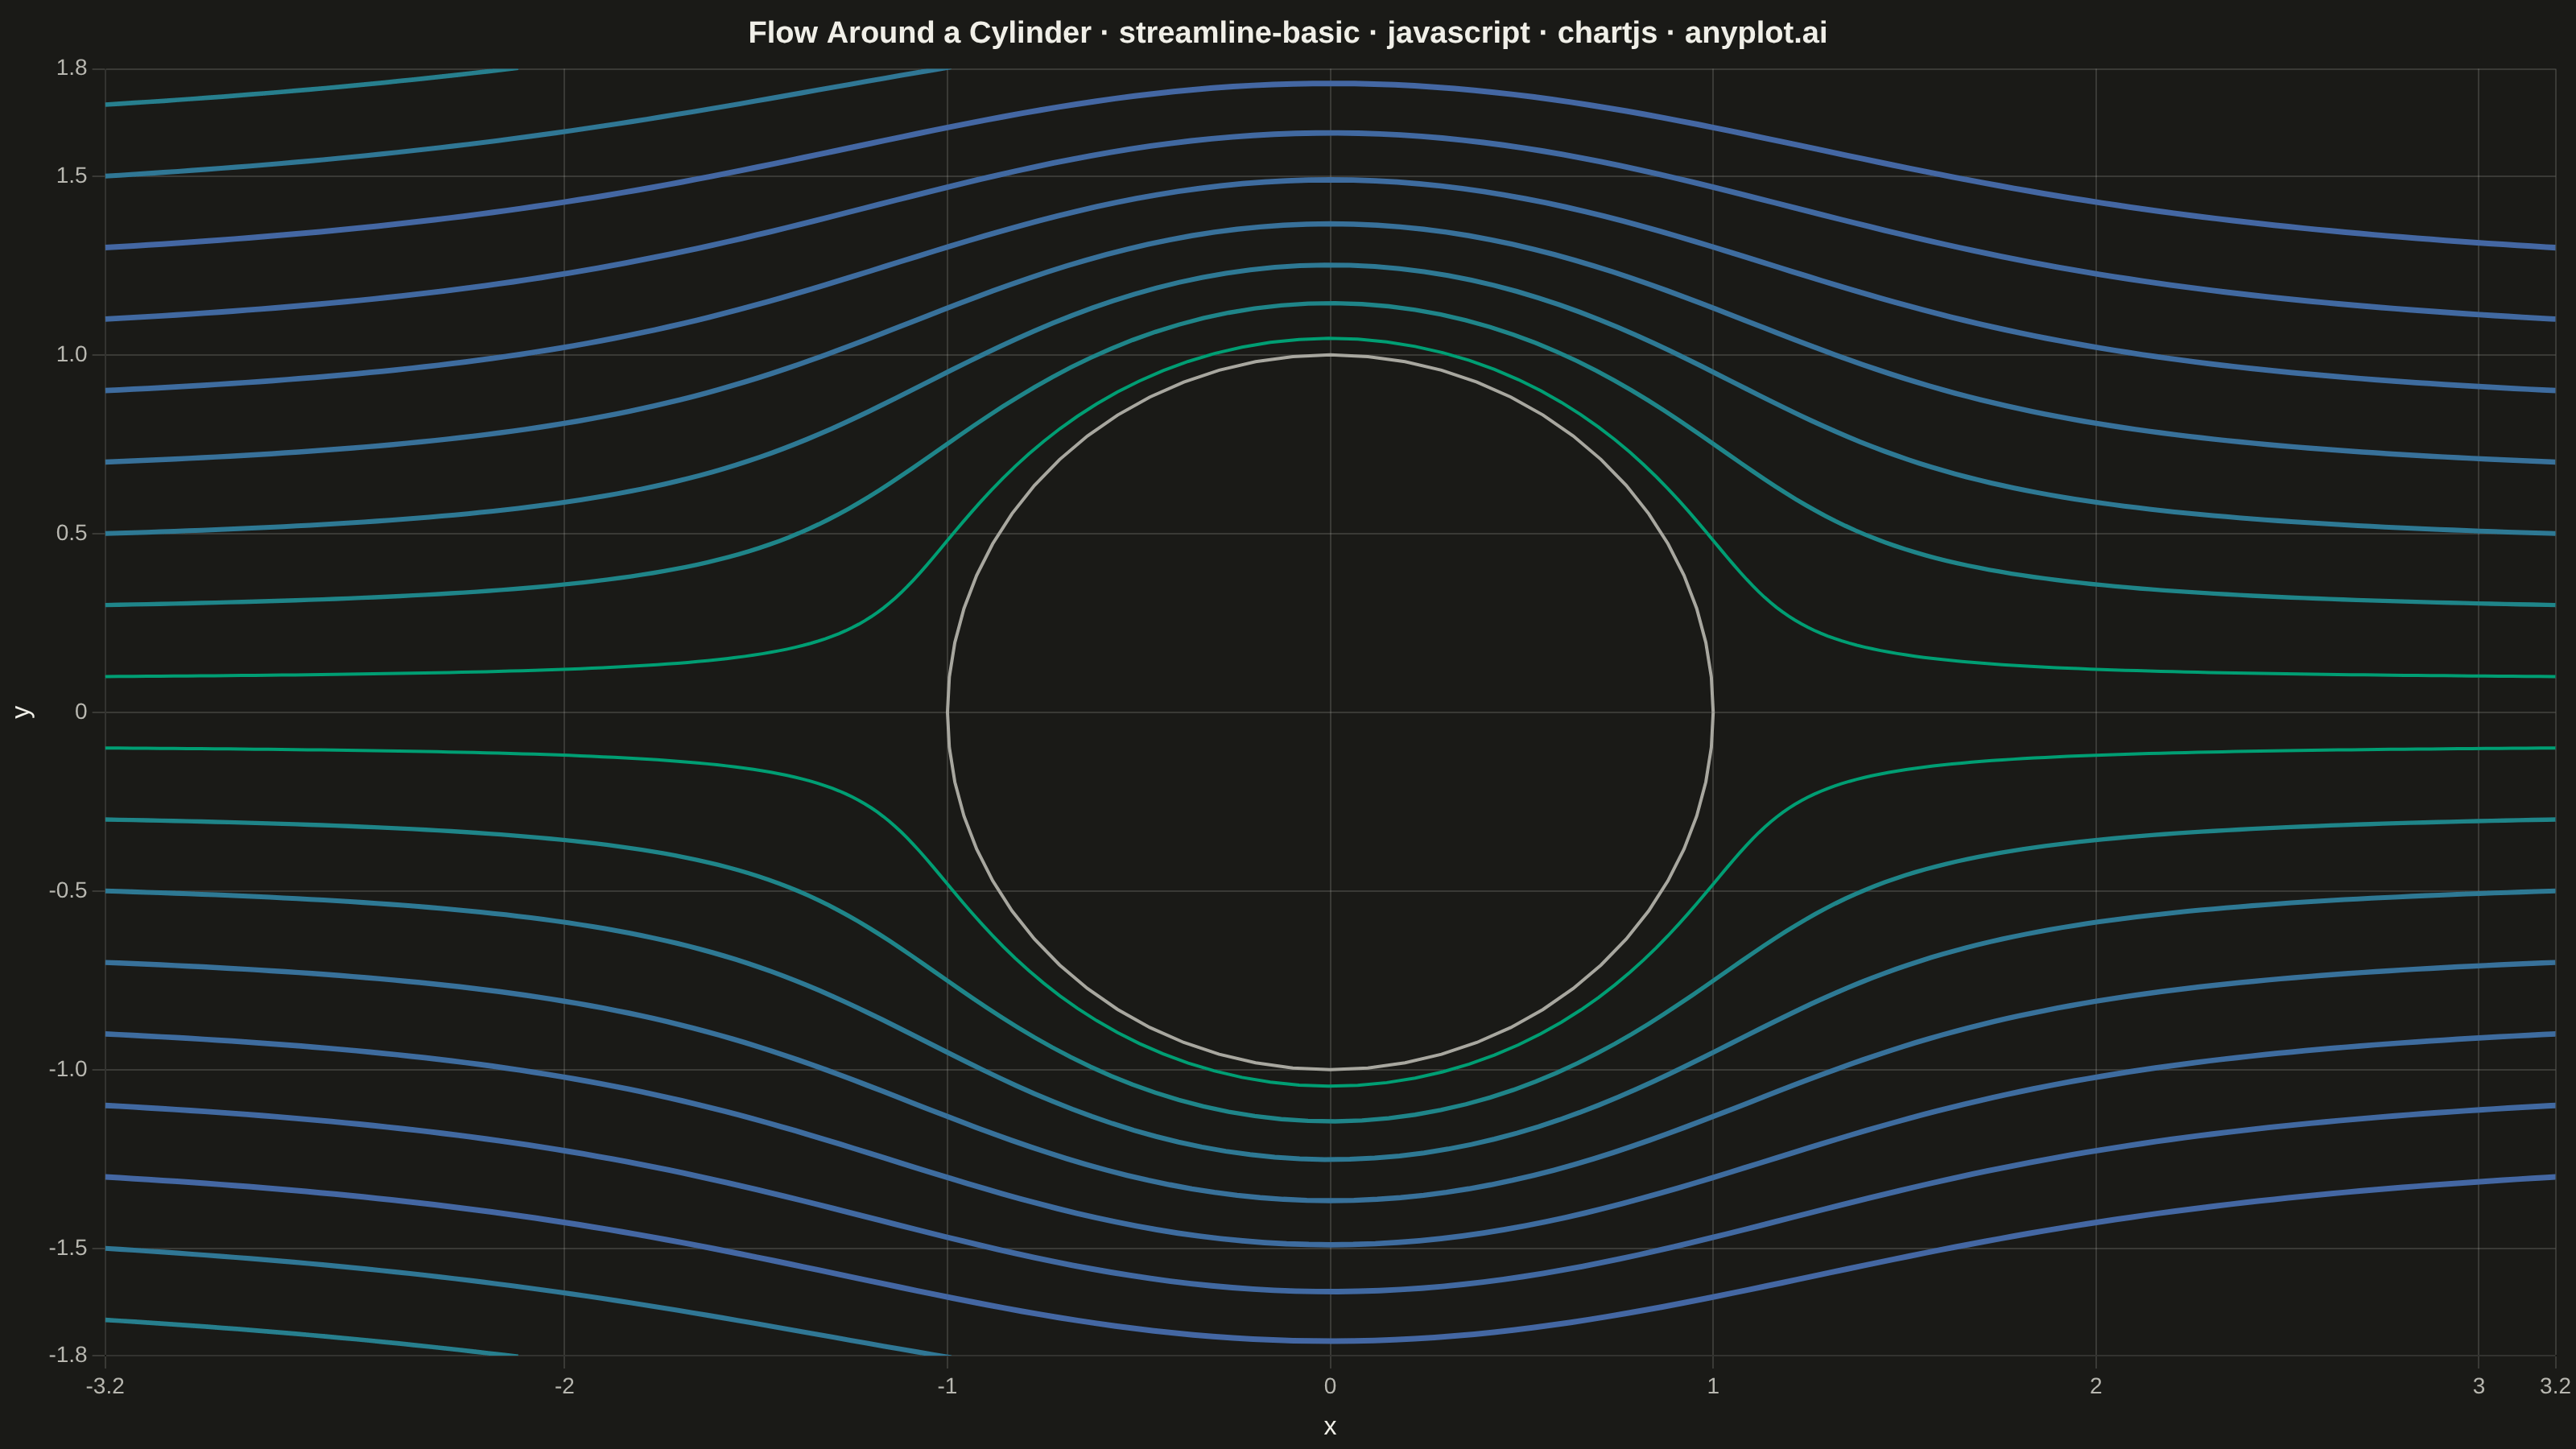
A streamline plot visualizes vector fields using smooth curves that are tangent to the field at every point. Unlike quiver plots that show discrete arrows, streamlines trace continuous paths through the field, revealing flow patterns, circulation, and field topology. This visualization is ideal for understanding fluid dynamics, electromagnetic fields, or gradient fields where the continuous nature of the flow is important.
// anyplot.ai
// streamline-basic: Basic Streamline Plot
// Library: chartjs 4.4.7 | JavaScript 22.23.2
// Quality: 88/100 | Created: 2026-09-09

//# anyplot-orientation: landscape
const THEME = window.ANYPLOT_THEME || "light";
const t = window.ANYPLOT_TOKENS;
const INK_MUTED = THEME === "light" ? "#6B6A63" : "#A8A79F";

// --- Vector field: potential flow past a circular cylinder -----------------
// Uniform stream (speed U) plus a doublet of strength that puts the
// stagnation points on a cylinder of radius R centered at the origin.
const U = 1;
const R = 1;

function velocity(x, y) {
  const r2 = x * x + y * y;
  const r4 = r2 * r2;
  const u = U * (1 - (R * R * (x * x - y * y)) / r4);
  const v = U * (-2 * R * R * x * y) / r4;
  return [u, v];
}

function rk4Step(x, y, dt) {
  const [k1u, k1v] = velocity(x, y);
  const [k2u, k2v] = velocity(x + (dt / 2) * k1u, y + (dt / 2) * k1v);
  const [k3u, k3v] = velocity(x + (dt / 2) * k2u, y + (dt / 2) * k2v);
  const [k4u, k4v] = velocity(x + dt * k3u, y + dt * k3v);
  const dx = (dt / 6) * (k1u + 2 * k2u + 2 * k3u + k4u);
  const dy = (dt / 6) * (k1v + 2 * k2v + 2 * k3v + k4v);
  const speed = Math.hypot(k1u, k1v);
  return { x: x + dx, y: y + dy, speed };
}

// --- Trace one streamline downstream from a seed point ----------------------
const X_MIN = -3.2,
  X_MAX = 3.2,
  Y_LIMIT = 1.8;
const DT = 0.04;
const MAX_STEPS = 400;

function traceStreamline(y0) {
  let x = X_MIN;
  let y = y0;
  const points = [{ x, y }];
  const speeds = [];
  for (let step = 0; step < MAX_STEPS; step += 1) {
    const next = rk4Step(x, y, DT);
    speeds.push(next.speed);
    x = next.x;
    y = next.y;
    points.push({ x, y });
    if (x > X_MAX || Math.abs(y) > Y_LIMIT) break;
  }
  const avgSpeed = speeds.reduce((a, b) => a + b, 0) / speeds.length;
  return { points, avgSpeed };
}

// Seed heights spanning the domain, skipping y=0 (the stagnation streamline
// that runs into the cylinder surface and never reaches the far side).
const seeds = [-1.7, -1.5, -1.3, -1.1, -0.9, -0.7, -0.5, -0.3, -0.1, 0.1, 0.3, 0.5, 0.7, 0.9, 1.1, 1.3, 1.5, 1.7];
const streamlines = seeds.map(traceStreamline);

const minSpeed = Math.min(...streamlines.map((s) => s.avgSpeed));
const maxSpeed = Math.max(...streamlines.map((s) => s.avgSpeed));

function hexToRgb(hex) {
  const n = parseInt(hex.slice(1), 16);
  return { r: (n >> 16) & 255, g: (n >> 8) & 255, b: n & 255 };
}
const seqLow = hexToRgb(t.seq[0]);
const seqHigh = hexToRgb(t.seq[1]);
function speedColor(avgSpeed) {
  const ratio = maxSpeed > minSpeed ? (avgSpeed - minSpeed) / (maxSpeed - minSpeed) : 0;
  const r = Math.round(seqLow.r + (seqHigh.r - seqLow.r) * ratio);
  const g = Math.round(seqLow.g + (seqHigh.g - seqLow.g) * ratio);
  const b = Math.round(seqLow.b + (seqHigh.b - seqLow.b) * ratio);
  return { color: `rgb(${r}, ${g}, ${b})`, ratio };
}

// --- Cylinder outline (drawn first, so streamlines render on top) ----------
const cylinderPoints = Array.from({ length: 65 }, (_, i) => {
  const angle = (i / 64) * 2 * Math.PI;
  return { x: R * Math.cos(angle), y: R * Math.sin(angle) };
});

const datasets = [
  {
    label: "Cylinder",
    data: cylinderPoints,
    borderColor: INK_MUTED,
    backgroundColor: THEME === "light" ? "rgba(26, 26, 23, 0.12)" : "rgba(240, 239, 232, 0.12)",
    borderWidth: 2,
    pointRadius: 0,
    fill: true,
    tension: 0,
    order: 0,
  },
];

streamlines.forEach(({ points, avgSpeed }) => {
  const { color, ratio } = speedColor(avgSpeed);
  datasets.push({
    label: "Streamline",
    data: points,
    borderColor: color,
    borderWidth: 2 + 1.5 * ratio,
    pointRadius: 0,
    fill: false,
    tension: 0,
    order: 1,
  });
});

// --- Mount -------------------------------------------------------------
const canvas = document.createElement("canvas");
document.getElementById("container").appendChild(canvas);

// --- Chart ---------------------------------------------------------------
const title = "Flow Around a Cylinder · streamline-basic · javascript · chartjs · anyplot.ai";
const titleFontSize = Math.max(14, Math.round(22 * (title.length > 67 ? 67 / title.length : 1)));

new Chart(canvas, {
  type: "line",
  data: { datasets },
  options: {
    responsive: true,
    maintainAspectRatio: false,
    animation: false,
    plugins: {
      title: { display: true, text: title, color: t.ink, font: { size: titleFontSize } },
      legend: { display: false },
      tooltip: { enabled: false },
    },
    scales: {
      x: {
        type: "linear",
        min: X_MIN,
        max: X_MAX,
        ticks: { color: t.inkSoft, font: { size: 14 } },
        grid: { color: t.grid },
        title: { display: true, text: "x", color: t.ink, font: { size: 16 } },
      },
      y: {
        type: "linear",
        min: -Y_LIMIT,
        max: Y_LIMIT,
        ticks: { color: t.inkSoft, font: { size: 14 } },
        grid: { color: t.grid },
        title: { display: true, text: "y", color: t.ink, font: { size: 16 } },
      },
    },
  },
});
Runnable source as JSON, for any HTTP client: https://api.anyplot.ai/specs/streamline-basic/chartjs/code. Any spec id and library id listed in llms-full.txt fit the same URL shape; every URL below is complete and callable.
{
  "spec_id": "streamline-basic",
  "language": "javascript",
  "library": "chartjs",
  "page": "https://anyplot.ai/streamline-basic/javascript/chartjs",
  "hub": "https://anyplot.ai/streamline-basic",
  "code_json": "https://api.anyplot.ai/specs/streamline-basic/chartjs/code",
  "spec_json": "https://api.anyplot.ai/specs/streamline-basic",
  "render_light_png": "https://storage.googleapis.com/anyplot-images/plots/streamline-basic/javascript/chartjs/plot-light.png",
  "render_dark_png": "https://storage.googleapis.com/anyplot-images/plots/streamline-basic/javascript/chartjs/plot-dark.png",
  "interactive_light_html": "https://storage.googleapis.com/anyplot-images/plots/streamline-basic/javascript/chartjs/plot-light.html",
  "interactive_dark_html": "https://storage.googleapis.com/anyplot-images/plots/streamline-basic/javascript/chartjs/plot-dark.html",
  "quality_score": 88.0,
  "license": "MIT",
  "guide": "https://anyplot.ai/llms.txt"
}
Part of Basic Streamline Plot on anyplot.ai.