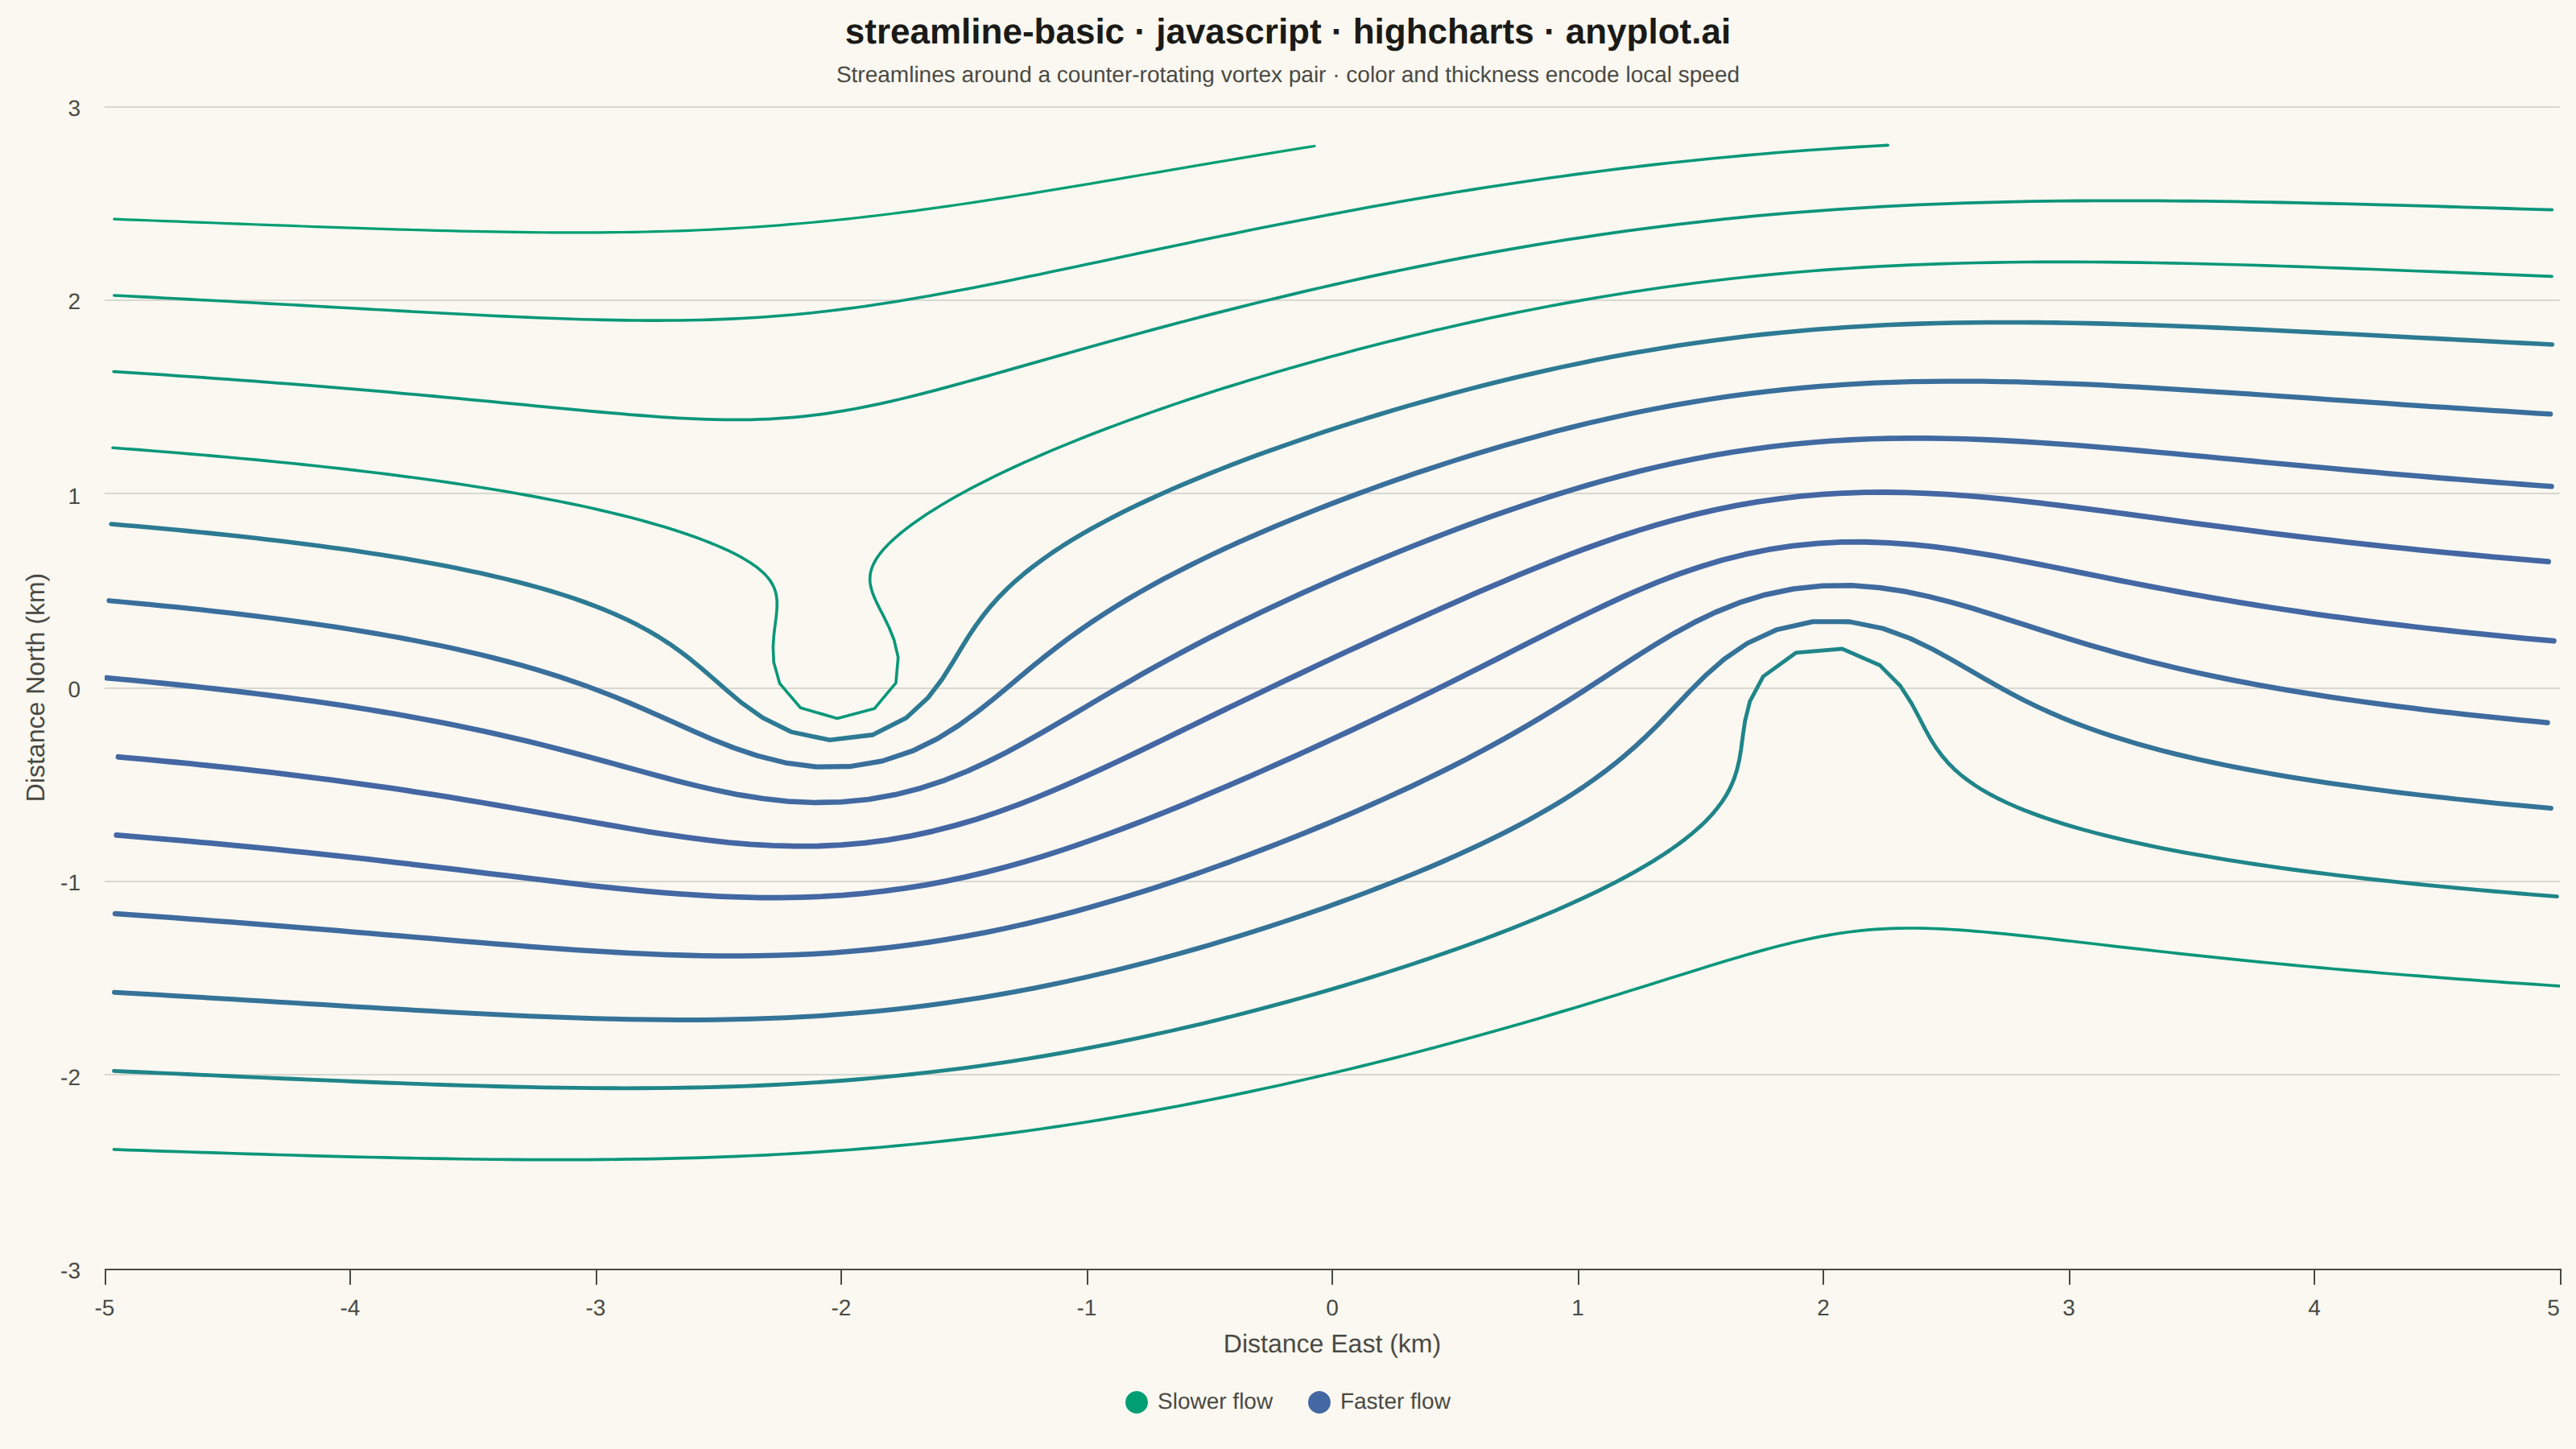
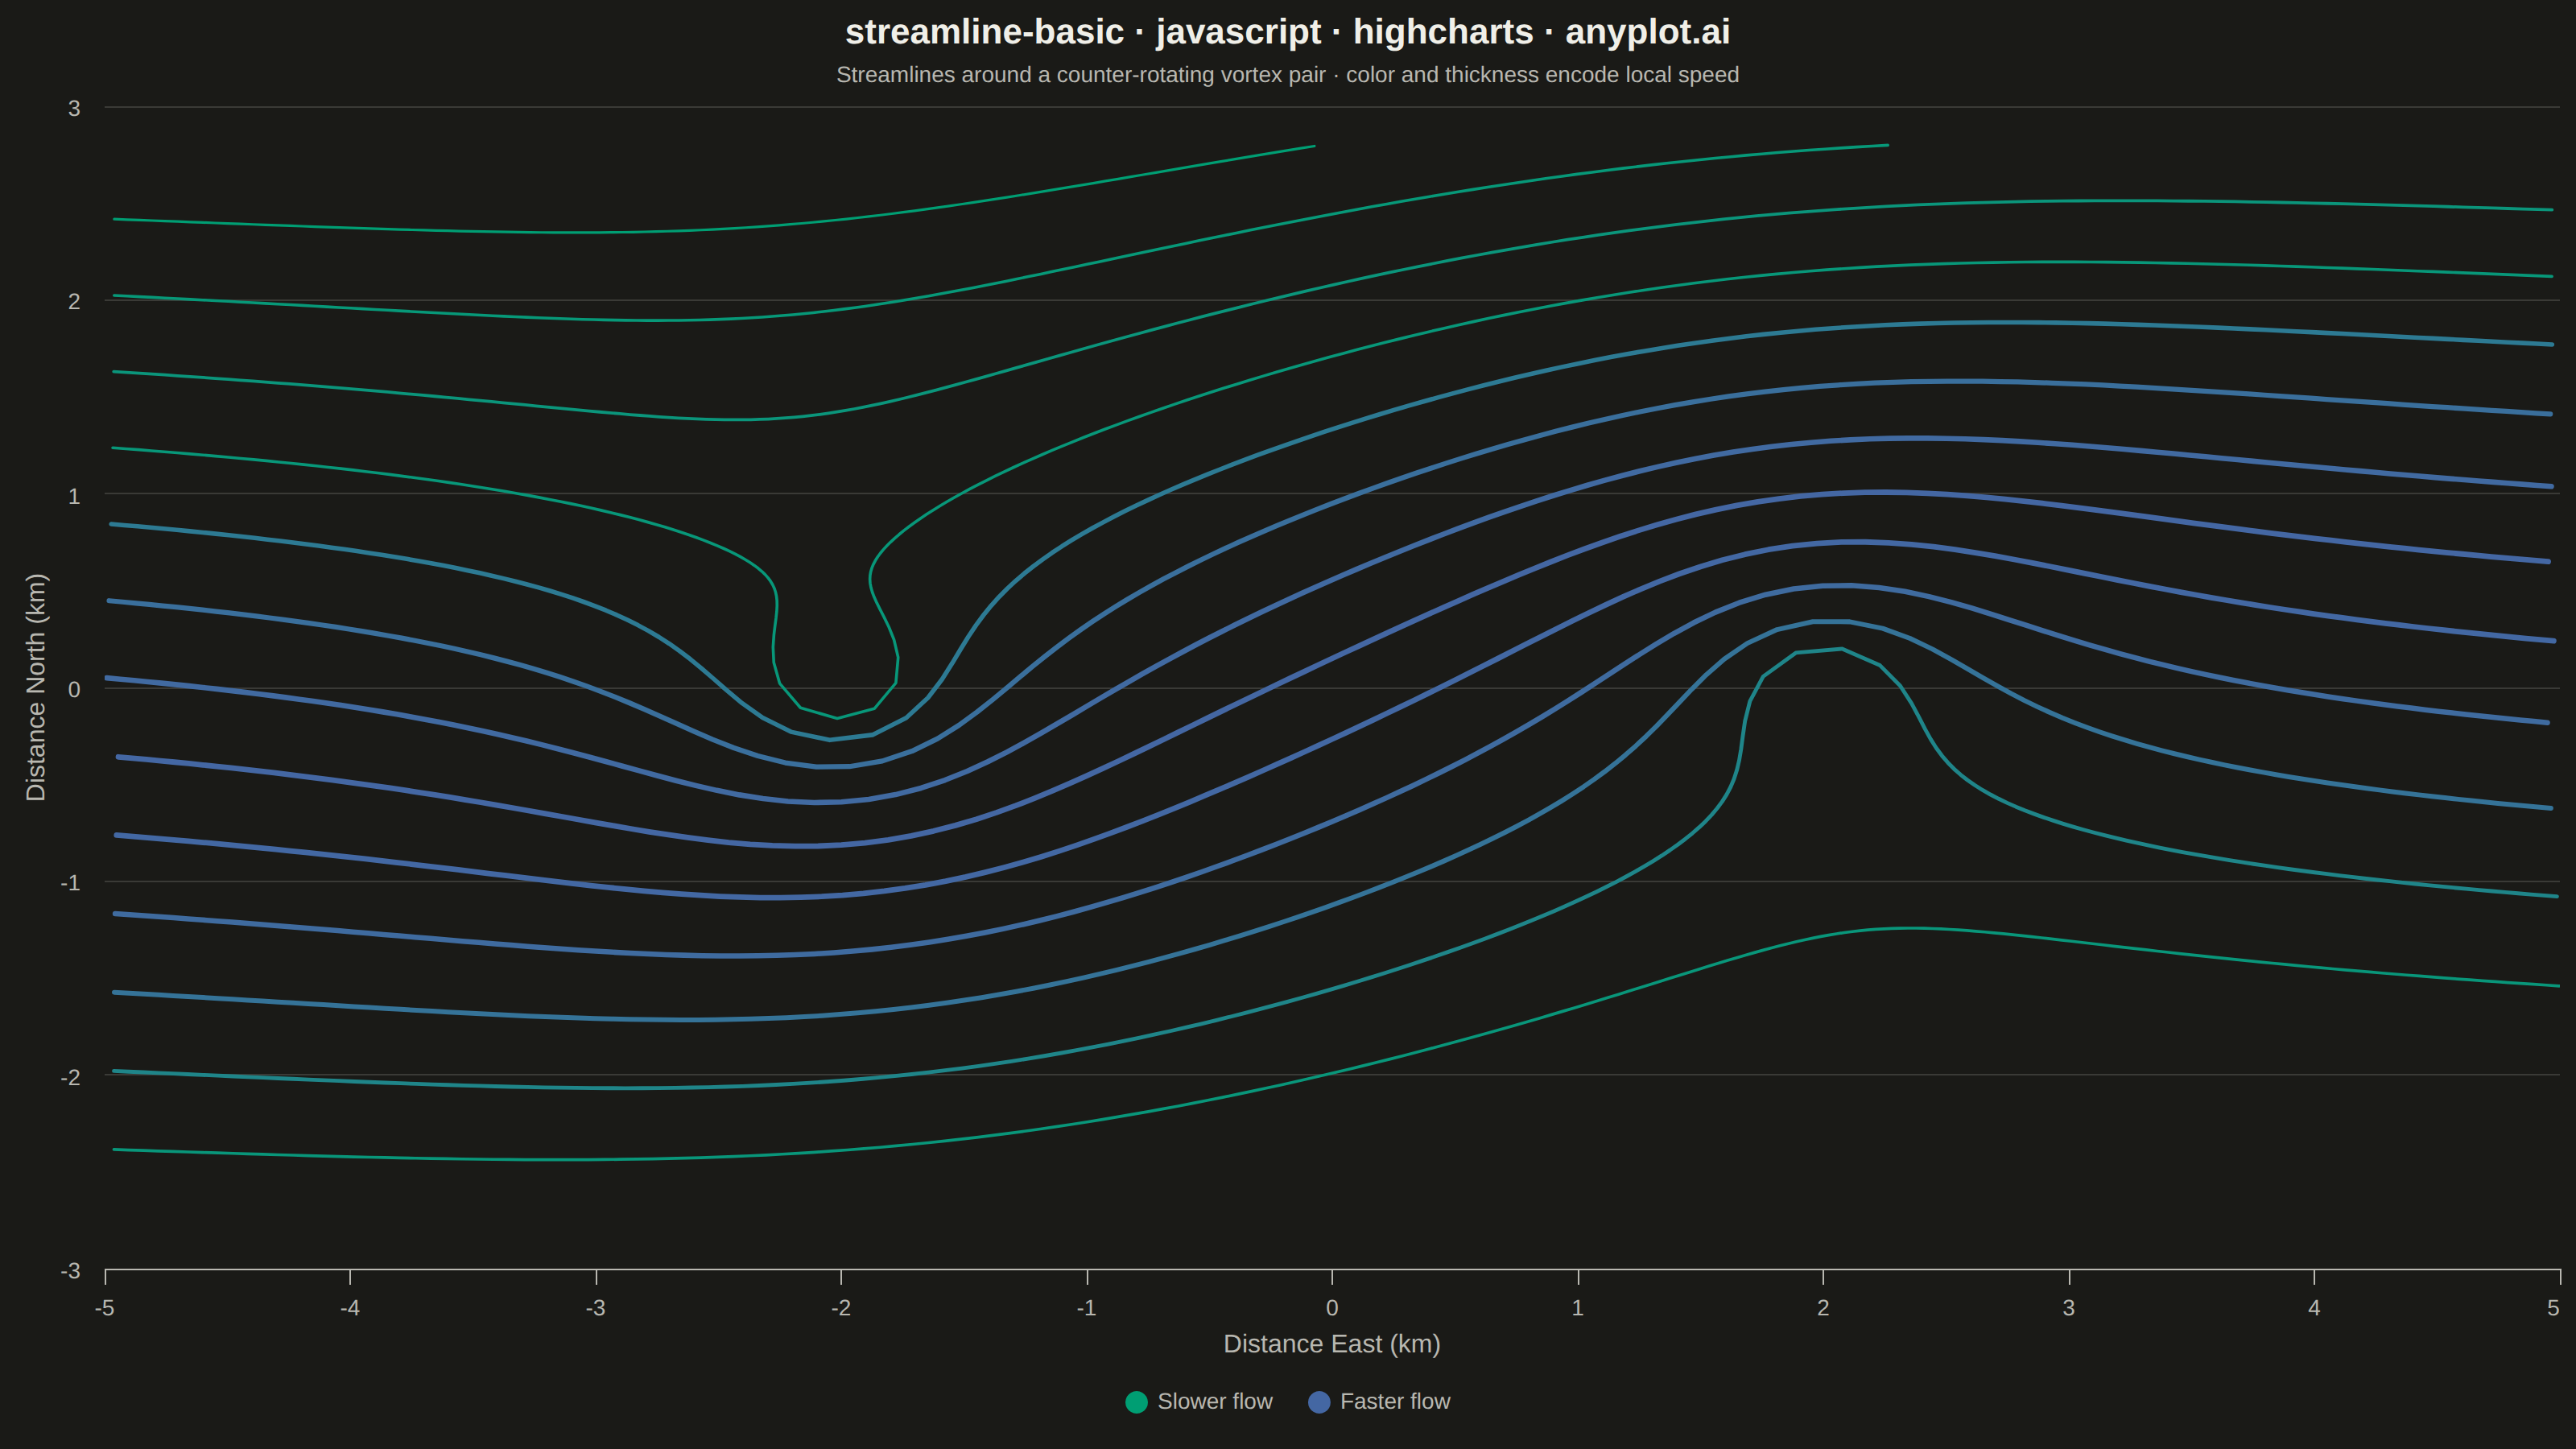
The same plot in 14 other libraries — JavaScript: Chart.js, D3.js, Apache ECharts, MUI X Charts; Python: Altair, Bokeh, lets-plot, Matplotlib, Plotly, plotnine, Pygal, Seaborn; R: ggplot2; Julia: Makie.jl. Compare all 15 side by side: Basic Streamline Plot in Python, R, Julia and JavaScript.
A streamline plot visualizes vector fields using smooth curves that are tangent to the field at every point. Unlike quiver plots that show discrete arrows, streamlines trace continuous paths through the field, revealing flow patterns, circulation, and field topology. This visualization is ideal for understanding fluid dynamics, electromagnetic fields, or gradient fields where the continuous nature of the flow is important.
// anyplot.ai
// streamline-basic: Basic Streamline Plot
// Library: highcharts 12.6.0 | JavaScript 22.23.2
// Quality: 91/100 | Created: 2026-09-09

const t = window.ANYPLOT_TOKENS;

// --- Vector field: a counter-rotating vortex pair embedded in a uniform ----
// wind. Superposed point-vortex velocity (softened near each core to avoid
// the analytic 1/r singularity) plus a constant eastward ambient flow — the
// combination that produces the classic "vortex in a stream" recirculation
// bubble bounded by a closed separatrix.
const AMBIENT_WIND = 1.6;
const VORTICES = [
  { x: -2, y: 0, strength: 6 },
  { x: 2, y: 0, strength: -6 },
];

function velocityAt(x, y) {
  let u = AMBIENT_WIND;
  let v = 0;
  for (const vortex of VORTICES) {
    const dx = x - vortex.x;
    const dy = y - vortex.y;
    const rSquared = Math.max(dx * dx + dy * dy, 0.05);
    u += (-vortex.strength * dy) / (2 * Math.PI * rSquared);
    v += (vortex.strength * dx) / (2 * Math.PI * rSquared);
  }
  return [u, v];
}

// --- Trace one streamline via RK4, integrating both ways from its seed -----
const X_MIN = -5;
const X_MAX = 5;
const Y_MIN = -2.8;
const Y_MAX = 2.8;
const STEP = 0.035;
const MAX_STEPS = 480;
const MAX_SPEED = 14;

function rk4Step(x, y, h) {
  const [u1, v1] = velocityAt(x, y);
  const [u2, v2] = velocityAt(x + (h * u1) / 2, y + (h * v1) / 2);
  const [u3, v3] = velocityAt(x + (h * u2) / 2, y + (h * v2) / 2);
  const [u4, v4] = velocityAt(x + h * u3, y + h * v3);
  return [
    x + (h * (u1 + 2 * u2 + 2 * u3 + u4)) / 6,
    y + (h * (v1 + 2 * v2 + 2 * v3 + v4)) / 6,
  ];
}

function traceHalf(x0, y0, h) {
  const path = [];
  let x = x0;
  let y = y0;
  for (let i = 0; i < MAX_STEPS; i += 1) {
    const [u, v] = velocityAt(x, y);
    if (Math.hypot(u, v) > MAX_SPEED || x < X_MIN || x > X_MAX || y < Y_MIN || y > Y_MAX) {
      break;
    }
    path.push([x, y]);
    [x, y] = rk4Step(x, y, h);
  }
  return path;
}

function traceStreamline(x0, y0) {
  const forward = traceHalf(x0, y0, STEP);
  const backward = traceHalf(x0, y0, -STEP);
  return backward.reverse().concat(forward.slice(1));
}

// --- Seed points: an upstream row spanning the full inflow edge. Each line
// is traced forward and backward from there, so the deflection around (and
// recirculation bubble bounding) each vortex emerges from the field itself
// rather than from separately-seeded core loops, which tangled into clutter.
const seeds = [];
for (let i = 0; i < 13; i += 1) {
  seeds.push([-4.6, -2.4 + i * 0.4]);
}

const streamlines = seeds
  .map(([sx, sy]) => {
    const points = traceStreamline(sx, sy);
    const speeds = points.map(([px, py]) => Math.hypot(...velocityAt(px, py)));
    const meanSpeed = speeds.reduce((sum, speed) => sum + speed, 0) / speeds.length;
    return { points, meanSpeed };
  })
  .filter((line) => line.points.length > 4);

const speedValues = streamlines.map((line) => line.meanSpeed);
const speedMin = Math.min(...speedValues);
const speedMax = Math.max(...speedValues);

// --- Imprint sequential colormap (speed → color) ----------------------------
function mixHex(hexA, hexB, ratio) {
  const a = parseInt(hexA.slice(1), 16);
  const b = parseInt(hexB.slice(1), 16);
  const channel = (shift) =>
    Math.round(((a >> shift) & 255) + (((b >> shift) & 255) - ((a >> shift) & 255)) * ratio);
  return `rgb(${channel(16)}, ${channel(8)}, ${channel(0)})`;
}

// --- Chart -------------------------------------------------------------------
// Streamlines loop back on themselves near the vortex cores, so a plain
// "line"/"spline" series (which auto-sorts points by ascending x) would
// scramble the path. A "scatter" series with lineWidth set draws the
// segments in data order instead, which preserves the traced curve.
// Markers stay hidden at rest (states.hover.enabled) so a mouse-driven HTML
// view can reveal each streamline's local speed on hover without any marker
// clutter in the static PNG screenshot (no pointer is ever active for it).
const streamlineSeries = streamlines.map((line, index) => {
  const ratio = speedMax > speedMin ? (line.meanSpeed - speedMin) / (speedMax - speedMin) : 0;
  return {
    type: "scatter",
    name: `Streamline ${index + 1}`,
    data: line.points,
    color: mixHex(t.seq[0], t.seq[1], ratio),
    lineWidth: 1.6 + ratio * 1.8,
    meanSpeed: line.meanSpeed,
    marker: { enabled: false, states: { hover: { enabled: true, radius: 5, lineWidth: 1 } } },
    showInLegend: false,
  };
});

const legendKeySeries = [
  {
    type: "scatter",
    name: "Slower flow",
    data: [],
    color: t.seq[0],
    marker: { enabled: true, radius: 7, symbol: "circle" },
  },
  {
    type: "scatter",
    name: "Faster flow",
    data: [],
    color: t.seq[1],
    marker: { enabled: true, radius: 7, symbol: "circle" },
  },
];

Highcharts.chart("container", {
  chart: {
    backgroundColor: "transparent",
    animation: false,
    style: { fontFamily: "inherit" },
  },
  credits: { enabled: false },
  colors: t.palette,
  title: {
    text: "streamline-basic · javascript · highcharts · anyplot.ai",
    style: { color: t.ink, fontSize: "22px", fontWeight: "600" },
  },
  subtitle: {
    text: "Streamlines around a counter-rotating vortex pair · color and thickness encode local speed",
    style: { color: t.inkSoft, fontSize: "14px" },
  },
  xAxis: {
    title: { text: "Distance East (km)", style: { color: t.inkSoft, fontSize: "16px" } },
    min: X_MIN,
    max: X_MAX,
    lineColor: t.inkSoft,
    tickColor: t.inkSoft,
    gridLineColor: t.grid,
    labels: { style: { color: t.inkSoft, fontSize: "14px" } },
  },
  yAxis: {
    title: { text: "Distance North (km)", style: { color: t.inkSoft, fontSize: "16px" } },
    min: Y_MIN,
    max: Y_MAX,
    gridLineColor: t.grid,
    lineColor: t.inkSoft,
    tickColor: t.inkSoft,
    labels: { style: { color: t.inkSoft, fontSize: "14px" } },
  },
  legend: {
    itemStyle: { color: t.inkSoft, fontSize: "14px" },
    itemHoverStyle: { color: t.ink },
  },
  tooltip: {
    backgroundColor: t.elevatedBg,
    borderColor: t.inkSoft,
    style: { color: t.ink, fontSize: "13px" },
    formatter() {
      const speed = this.series.userOptions.meanSpeed;
      return speed === undefined
        ? false
        : `<b>${this.series.name}</b><br/>speed ≈ ${speed.toFixed(2)}<br/>(${this.x.toFixed(1)}, ${this.y.toFixed(1)}) km`;
    },
  },
  plotOptions: {
    series: { animation: false, marker: { enabled: false } },
  },
  series: [...legendKeySeries, ...streamlineSeries],
});
Runnable source as JSON, for any HTTP client: https://api.anyplot.ai/specs/streamline-basic/highcharts/code. Any spec id and library id listed in llms-full.txt fit the same URL shape; every URL below is complete and callable.
{
  "spec_id": "streamline-basic",
  "language": "javascript",
  "library": "highcharts",
  "page": "https://anyplot.ai/streamline-basic/javascript/highcharts",
  "hub": "https://anyplot.ai/streamline-basic",
  "code_json": "https://api.anyplot.ai/specs/streamline-basic/highcharts/code",
  "spec_json": "https://api.anyplot.ai/specs/streamline-basic",
  "render_light_png": "https://storage.googleapis.com/anyplot-images/plots/streamline-basic/javascript/highcharts/plot-light.png",
  "render_dark_png": "https://storage.googleapis.com/anyplot-images/plots/streamline-basic/javascript/highcharts/plot-dark.png",
  "interactive_light_html": "https://storage.googleapis.com/anyplot-images/plots/streamline-basic/javascript/highcharts/plot-light.html",
  "interactive_dark_html": "https://storage.googleapis.com/anyplot-images/plots/streamline-basic/javascript/highcharts/plot-dark.html",
  "quality_score": 91.0,
  "license": "MIT",
  "guide": "https://anyplot.ai/llms.txt"
}
Part of Basic Streamline Plot on anyplot.ai.