The same plot in 14 other libraries — JavaScript: Chart.js, D3.js, Highcharts, MUI X Charts; Python: Altair, Bokeh, lets-plot, Matplotlib, Plotly, plotnine, Pygal, Seaborn; R: ggplot2; Julia: Makie.jl. Compare all 15 side by side: Basic Streamline Plot in Python, R, Julia and JavaScript.
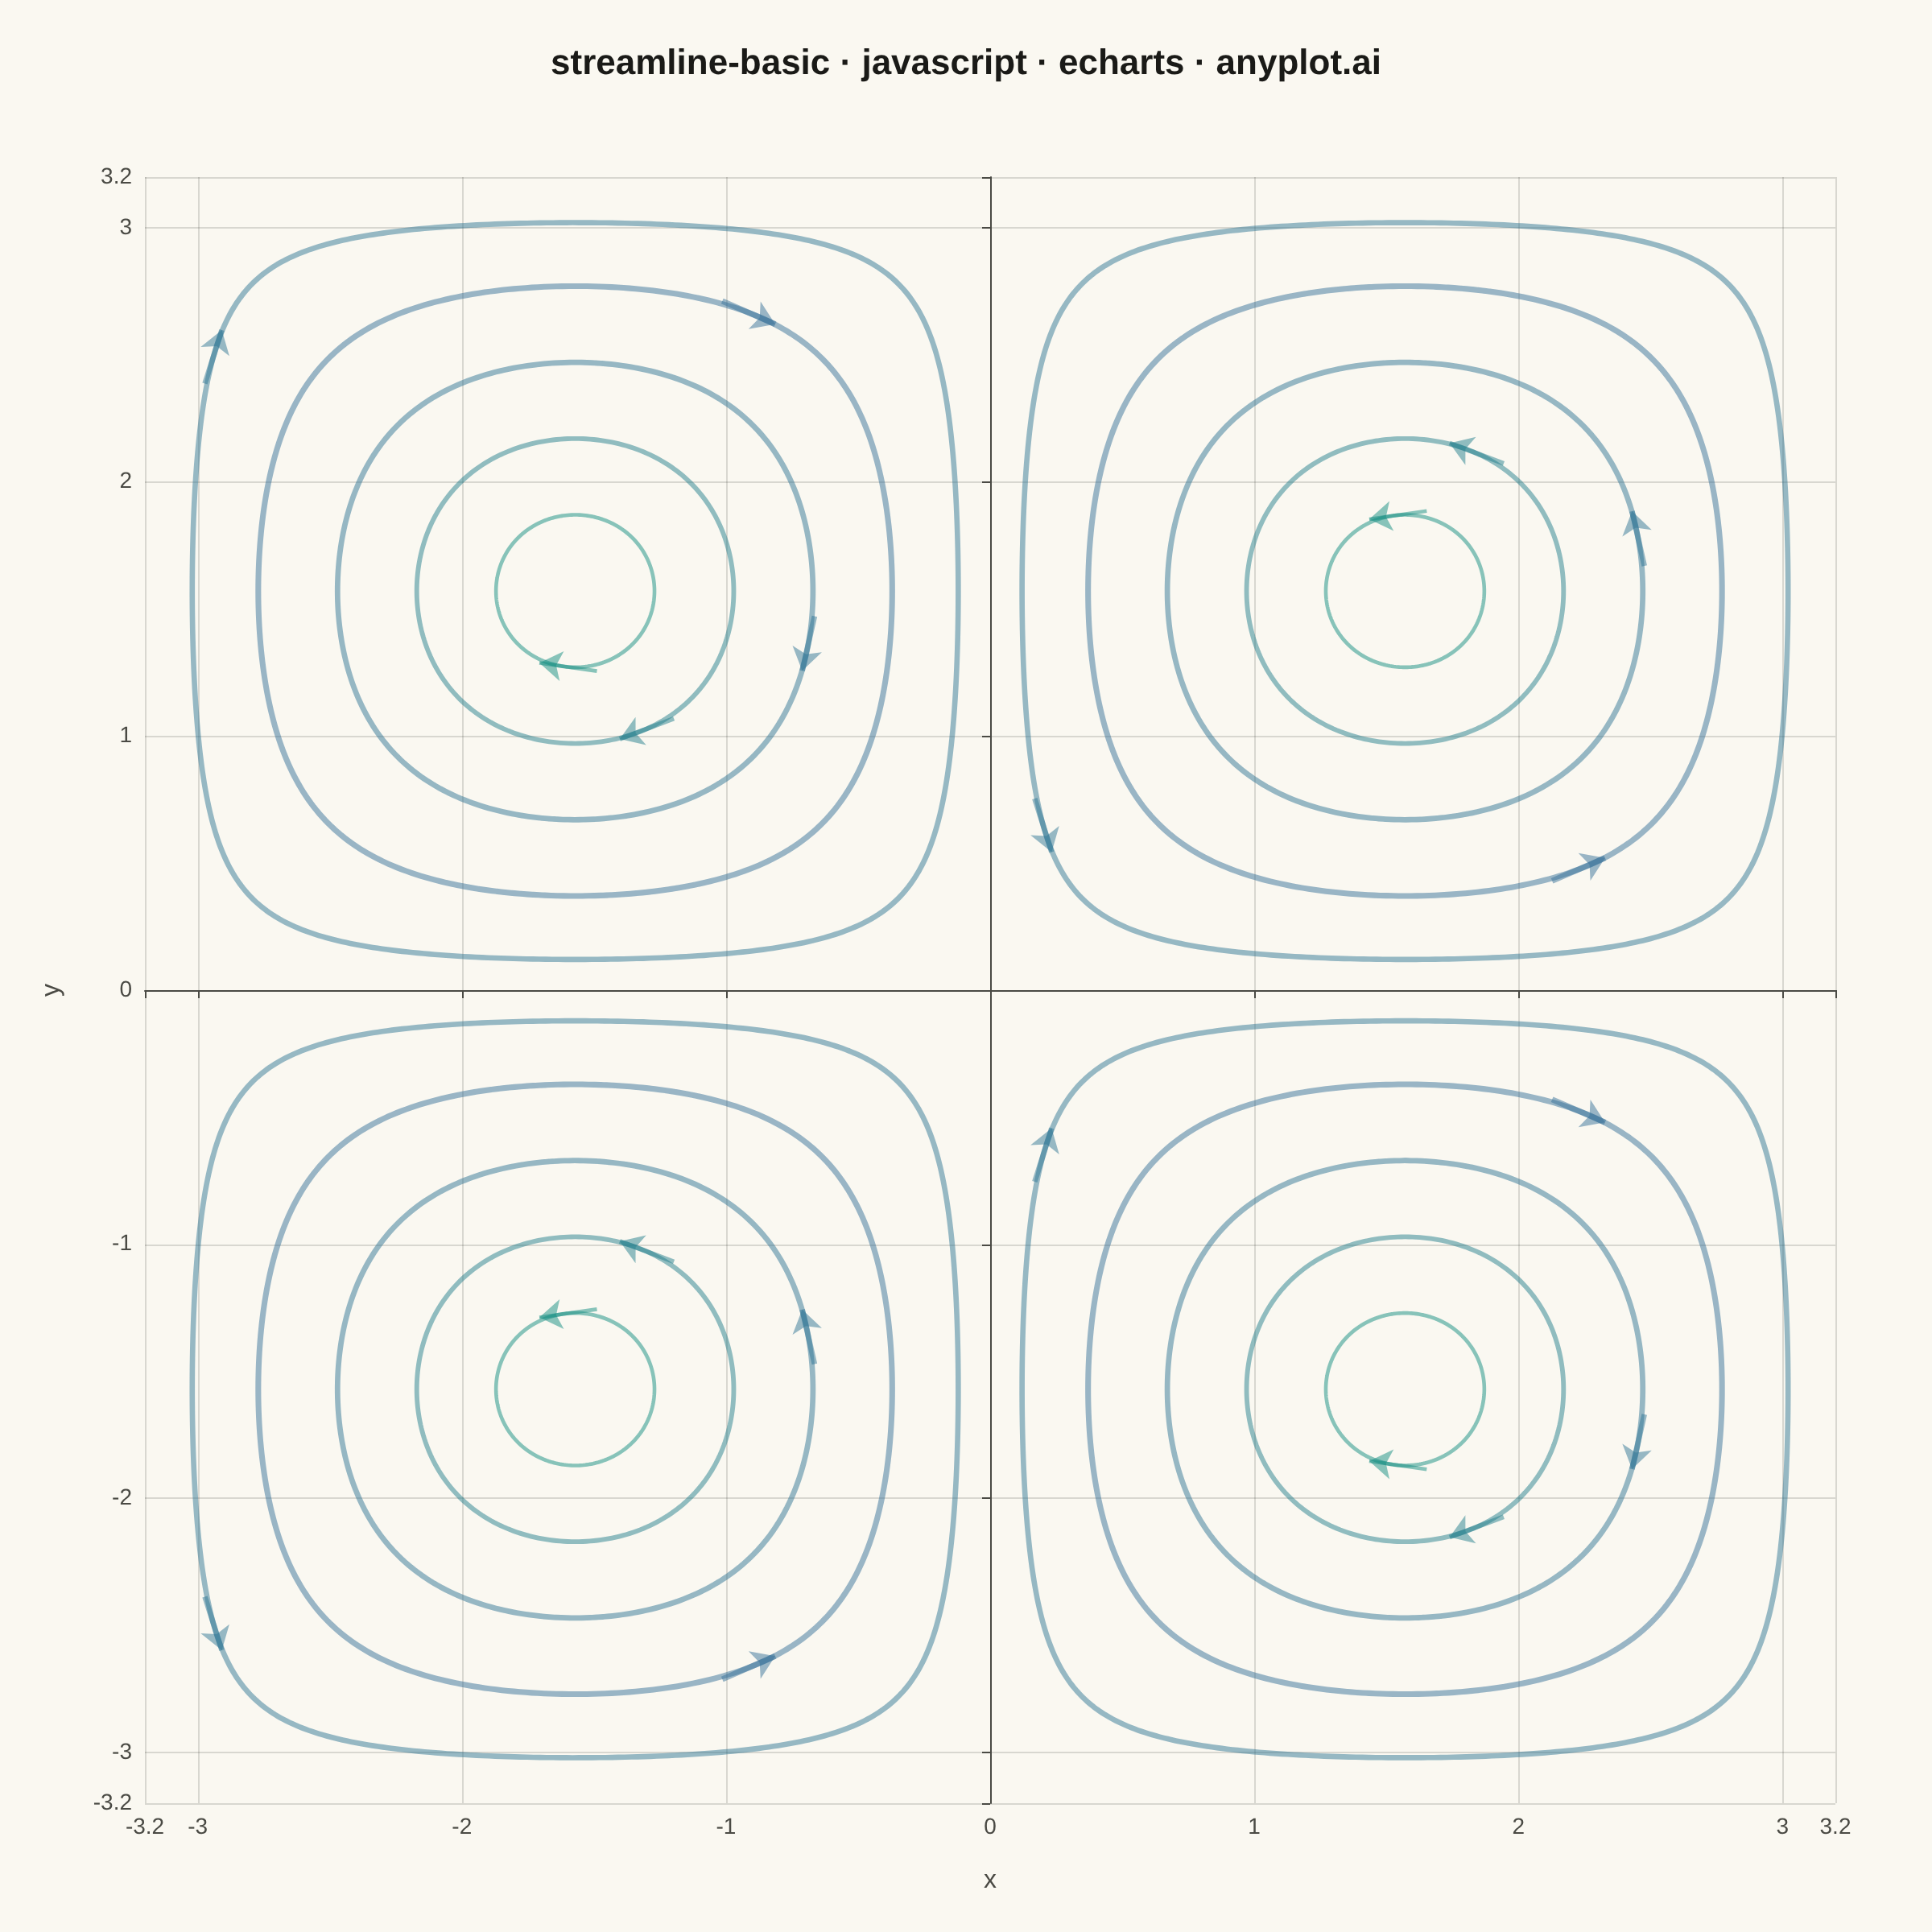
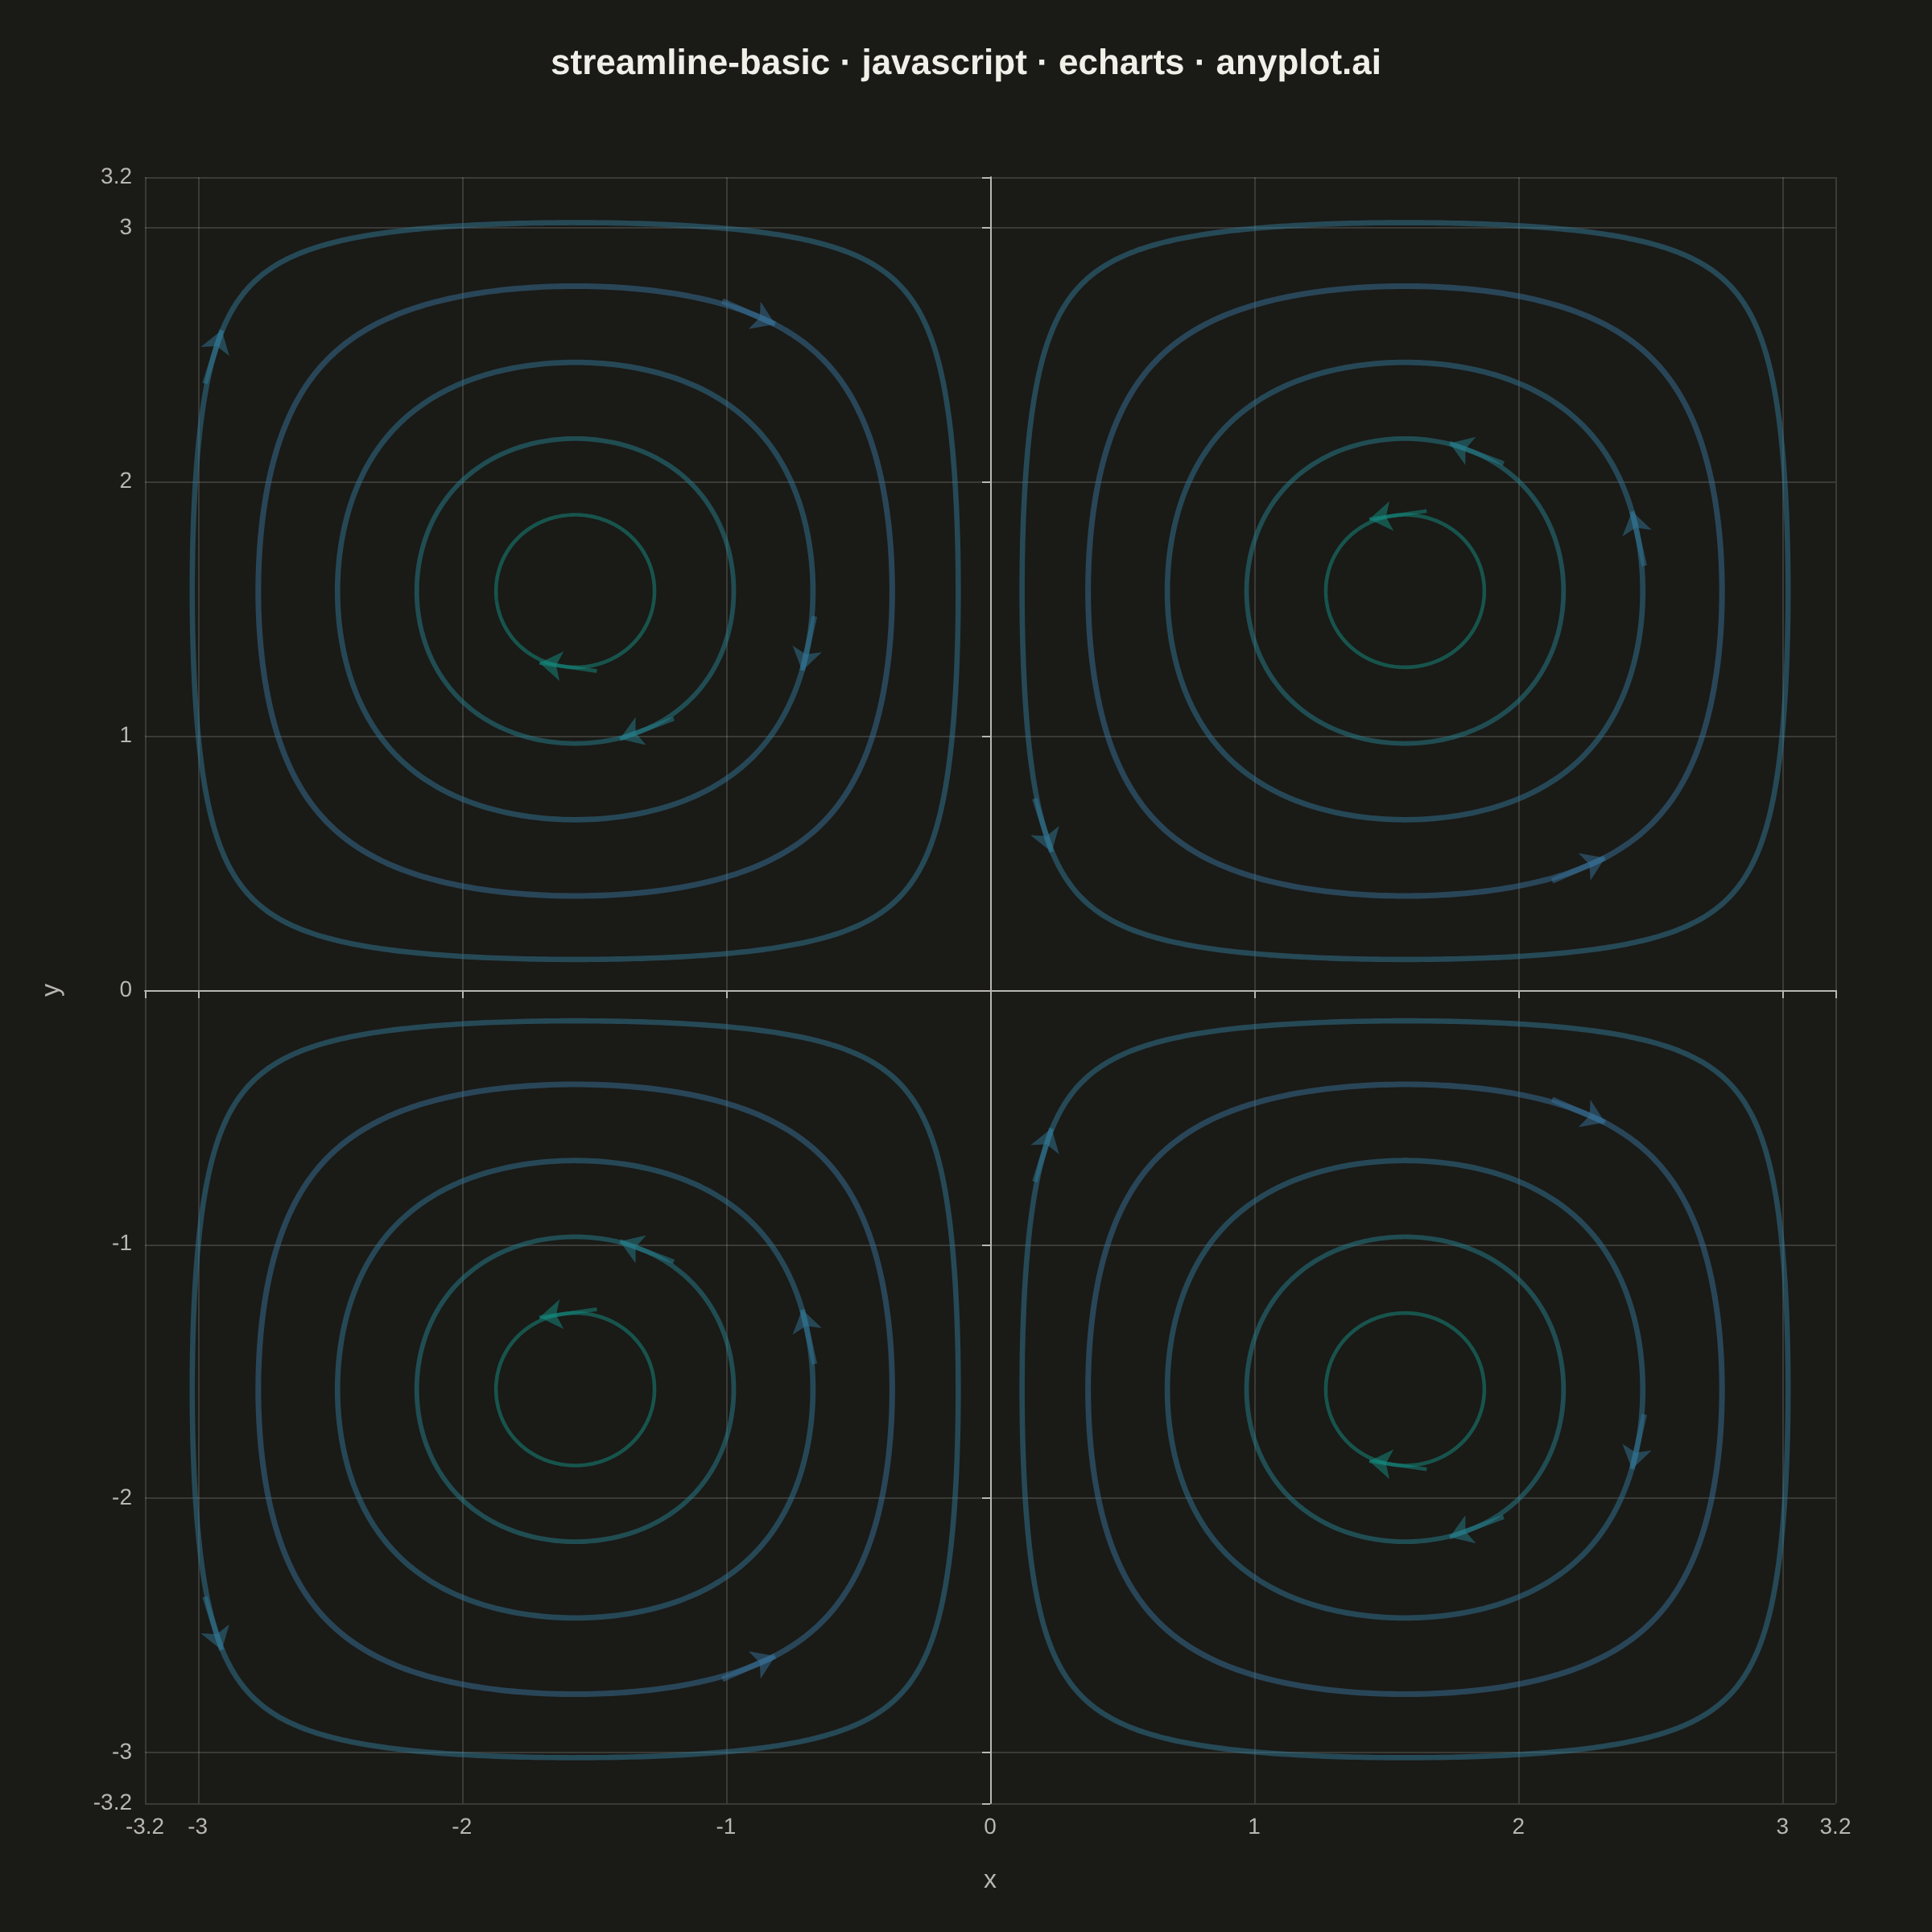
A streamline plot visualizes vector fields using smooth curves that are tangent to the field at every point. Unlike quiver plots that show discrete arrows, streamlines trace continuous paths through the field, revealing flow patterns, circulation, and field topology. This visualization is ideal for understanding fluid dynamics, electromagnetic fields, or gradient fields where the continuous nature of the flow is important.
// anyplot.ai
// streamline-basic: Basic Streamline Plot
// Library: echarts 6.1.0 | JavaScript 22.23.2
// Quality: 89/100 | Created: 2026-09-09

//# anyplot-orientation: square
const t = window.ANYPLOT_TOKENS;

// --- Vector field -------------------------------------------------------
// Taylor-Green cellular flow, a divergence-free field with stream function
// psi = sin(x) sin(y): u = sin(x)cos(y), v = -cos(x)sin(y). Streamlines are
// closed loops nested around four alternating vortex cells over [-pi, pi]^2.
const PI = Math.PI;
// Axis bounds are a clean round number (not the raw PI+margin), so ECharts'
// boundary tick labels don't render at full float precision.
const AXIS_LIMIT = 3.2;

const velocity = (x, y) => [Math.sin(x) * Math.cos(y), -Math.cos(x) * Math.sin(y)];

const speedAt = (x, y) => {
  const [u, v] = velocity(x, y);
  return Math.sqrt(u * u + v * v);
};

// --- Integrate one streamline via RK4 from a seed point ------------------
const traceStreamline = (x0, y0, steps, dt) => {
  let x = x0;
  let y = y0;
  const path = [[x, y]];
  for (let i = 0; i < steps; i += 1) {
    const [k1u, k1v] = velocity(x, y);
    const [k2u, k2v] = velocity(x + (k1u * dt) / 2, y + (k1v * dt) / 2);
    const [k3u, k3v] = velocity(x + (k2u * dt) / 2, y + (k2v * dt) / 2);
    const [k4u, k4v] = velocity(x + k3u * dt, y + k3v * dt);
    x += (dt / 6) * (k1u + 2 * k2u + 2 * k3u + k4u);
    y += (dt / 6) * (k1v + 2 * k2v + 2 * k3v + k4v);
    if (Math.abs(x) > PI || Math.abs(y) > PI) break;
    path.push([x, y]);
  }
  return path;
};

// Seeds: one radial family per vortex cell, offset along x from each cell's
// elliptic center (both the center and the cell boundary are stagnation
// points, so mid-radius offsets trace the cleanest closed loops).
const cellCenters = [
  [PI / 2, PI / 2],
  [-PI / 2, PI / 2],
  [-PI / 2, -PI / 2],
  [PI / 2, -PI / 2],
];
// A near-boundary radius is included so seeds sweep from each cell's elliptic
// center out toward the separatrix, showing more of the field topology.
const radii = [0.3, 0.6, 0.9, 1.2, 1.45];
const seeds = [];
cellCenters.forEach(([cx, cy]) => {
  radii.forEach((r) => {
    seeds.push([cx + r, cy]);
  });
});

// --- Color + width by mean speed along each streamline (imprint_seq) -----
const hexToRgb = (hex) => [1, 3, 5].map((i) => parseInt(hex.slice(i, i + 2), 16));
const seqLo = hexToRgb(t.seq[0]);
const seqHi = hexToRgb(t.seq[1]);
const lerp = (a, b, f) => a + (b - a) * f;

// --- Directional arrowhead: a short segment at each path's midpoint, oriented
// along the local flow direction, so circulation direction is visible per cell.
const arrowAt = (path) => {
  const midIdx = Math.floor(path.length / 2);
  const aheadIdx = Math.min(midIdx + 5, path.length - 1);
  const [mx, my] = path[midIdx];
  const [ax, ay] = path[aheadIdx];
  const dx = ax - mx;
  const dy = ay - my;
  const dist = Math.hypot(dx, dy) || 1;
  const ux = dx / dist;
  const uy = dy / dist;
  const halfLen = 0.11;
  return [
    [mx - ux * halfLen, my - uy * halfLen],
    [mx + ux * halfLen, my + uy * halfLen],
  ];
};

const streamlines = [];
const arrows = [];
seeds.forEach(([sx, sy]) => {
  const path = traceStreamline(sx, sy, 650, 0.025);
  const meanSpeed = path.reduce((sum, [px, py]) => sum + speedAt(px, py), 0) / path.length;
  const f = Math.max(0, Math.min(1, meanSpeed));
  const rgb = [0, 1, 2].map((i) => Math.round(lerp(seqLo[i], seqHi[i], f)));
  const color = `rgb(${rgb.join(",")})`;
  const width = lerp(1.6, 4, f);
  streamlines.push({ coords: path, lineStyle: { color, width } });
  arrows.push({ coords: arrowAt(path), lineStyle: { color, width } });
});

// --- Init ------------------------------------------------------------------
const chart = echarts.init(document.getElementById("container"));

// --- Option ------------------------------------------------------------------
chart.setOption({
  animation: false,
  backgroundColor: "transparent",
  title: {
    text: "streamline-basic · javascript · echarts · anyplot.ai",
    left: "center",
    top: 24,
    textStyle: { color: t.ink, fontSize: 22 },
  },
  grid: { left: 90, right: 60, top: 110, bottom: 80 },
  xAxis: {
    type: "value",
    min: -AXIS_LIMIT,
    max: AXIS_LIMIT,
    name: "x",
    nameLocation: "middle",
    nameGap: 40,
    nameTextStyle: { color: t.inkSoft, fontSize: 16 },
    axisLabel: { color: t.inkSoft, fontSize: 14 },
    axisLine: { lineStyle: { color: t.inkSoft } },
    splitLine: { lineStyle: { color: t.grid } },
  },
  yAxis: {
    type: "value",
    min: -AXIS_LIMIT,
    max: AXIS_LIMIT,
    name: "y",
    nameLocation: "middle",
    nameGap: 50,
    nameTextStyle: { color: t.inkSoft, fontSize: 16 },
    axisLabel: { color: t.inkSoft, fontSize: 14 },
    axisLine: { lineStyle: { color: t.inkSoft } },
    splitLine: { lineStyle: { color: t.grid } },
  },
  series: [
    {
      type: "lines",
      coordinateSystem: "cartesian2d",
      polyline: true,
      symbol: ["none", "none"],
      data: streamlines,
    },
    {
      type: "lines",
      coordinateSystem: "cartesian2d",
      symbol: ["none", "arrow"],
      symbolSize: 14,
      data: arrows,
    },
  ],
});
Runnable source as JSON, for any HTTP client: https://api.anyplot.ai/specs/streamline-basic/echarts/code. Any spec id and library id listed in llms-full.txt fit the same URL shape; every URL below is complete and callable.
{
  "spec_id": "streamline-basic",
  "language": "javascript",
  "library": "echarts",
  "page": "https://anyplot.ai/streamline-basic/javascript/echarts",
  "hub": "https://anyplot.ai/streamline-basic",
  "code_json": "https://api.anyplot.ai/specs/streamline-basic/echarts/code",
  "spec_json": "https://api.anyplot.ai/specs/streamline-basic",
  "render_light_png": "https://storage.googleapis.com/anyplot-images/plots/streamline-basic/javascript/echarts/plot-light.png",
  "render_dark_png": "https://storage.googleapis.com/anyplot-images/plots/streamline-basic/javascript/echarts/plot-dark.png",
  "interactive_light_html": "https://storage.googleapis.com/anyplot-images/plots/streamline-basic/javascript/echarts/plot-light.html",
  "interactive_dark_html": "https://storage.googleapis.com/anyplot-images/plots/streamline-basic/javascript/echarts/plot-dark.html",
  "quality_score": 89.0,
  "license": "MIT",
  "guide": "https://anyplot.ai/llms.txt"
}
Part of Basic Streamline Plot on anyplot.ai.