The same plot in 14 other libraries — JavaScript: Chart.js, Apache ECharts, Highcharts, MUI X Charts; Python: Altair, Bokeh, lets-plot, Matplotlib, Plotly, plotnine, Pygal, Seaborn; R: ggplot2; Julia: Makie.jl. Compare all 15 side by side: Basic Streamline Plot in Python, R, Julia and JavaScript.
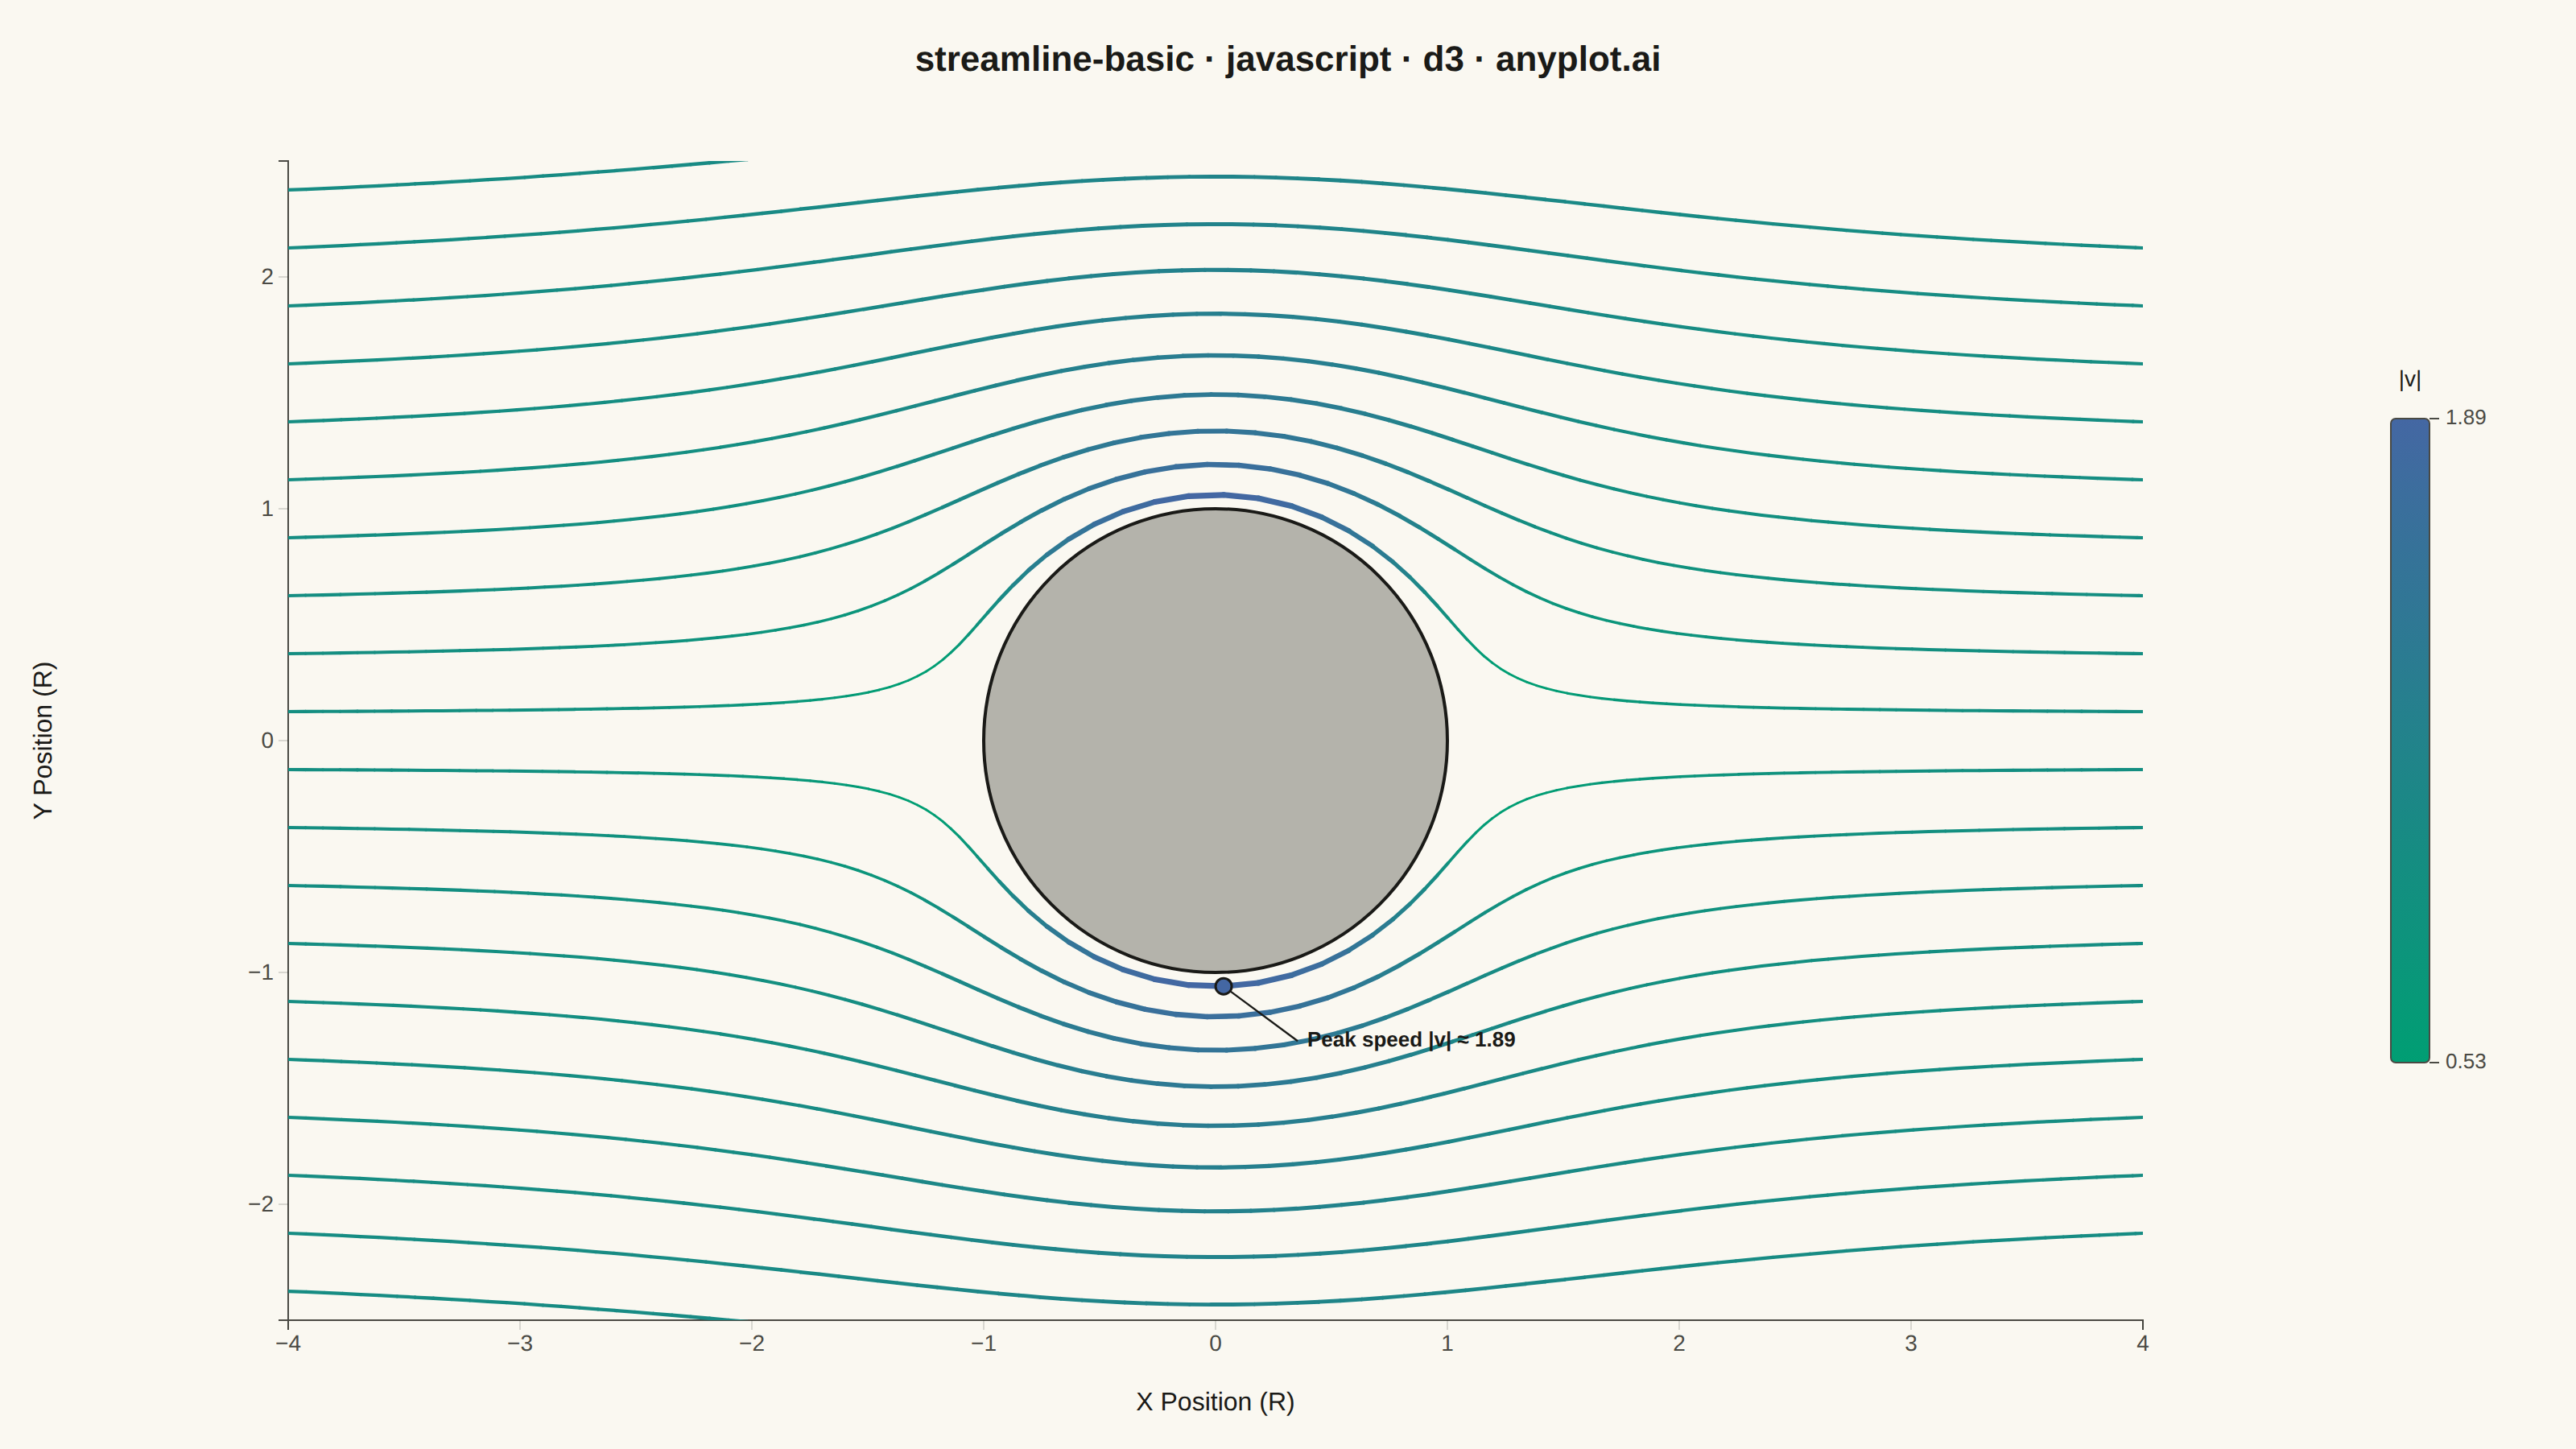
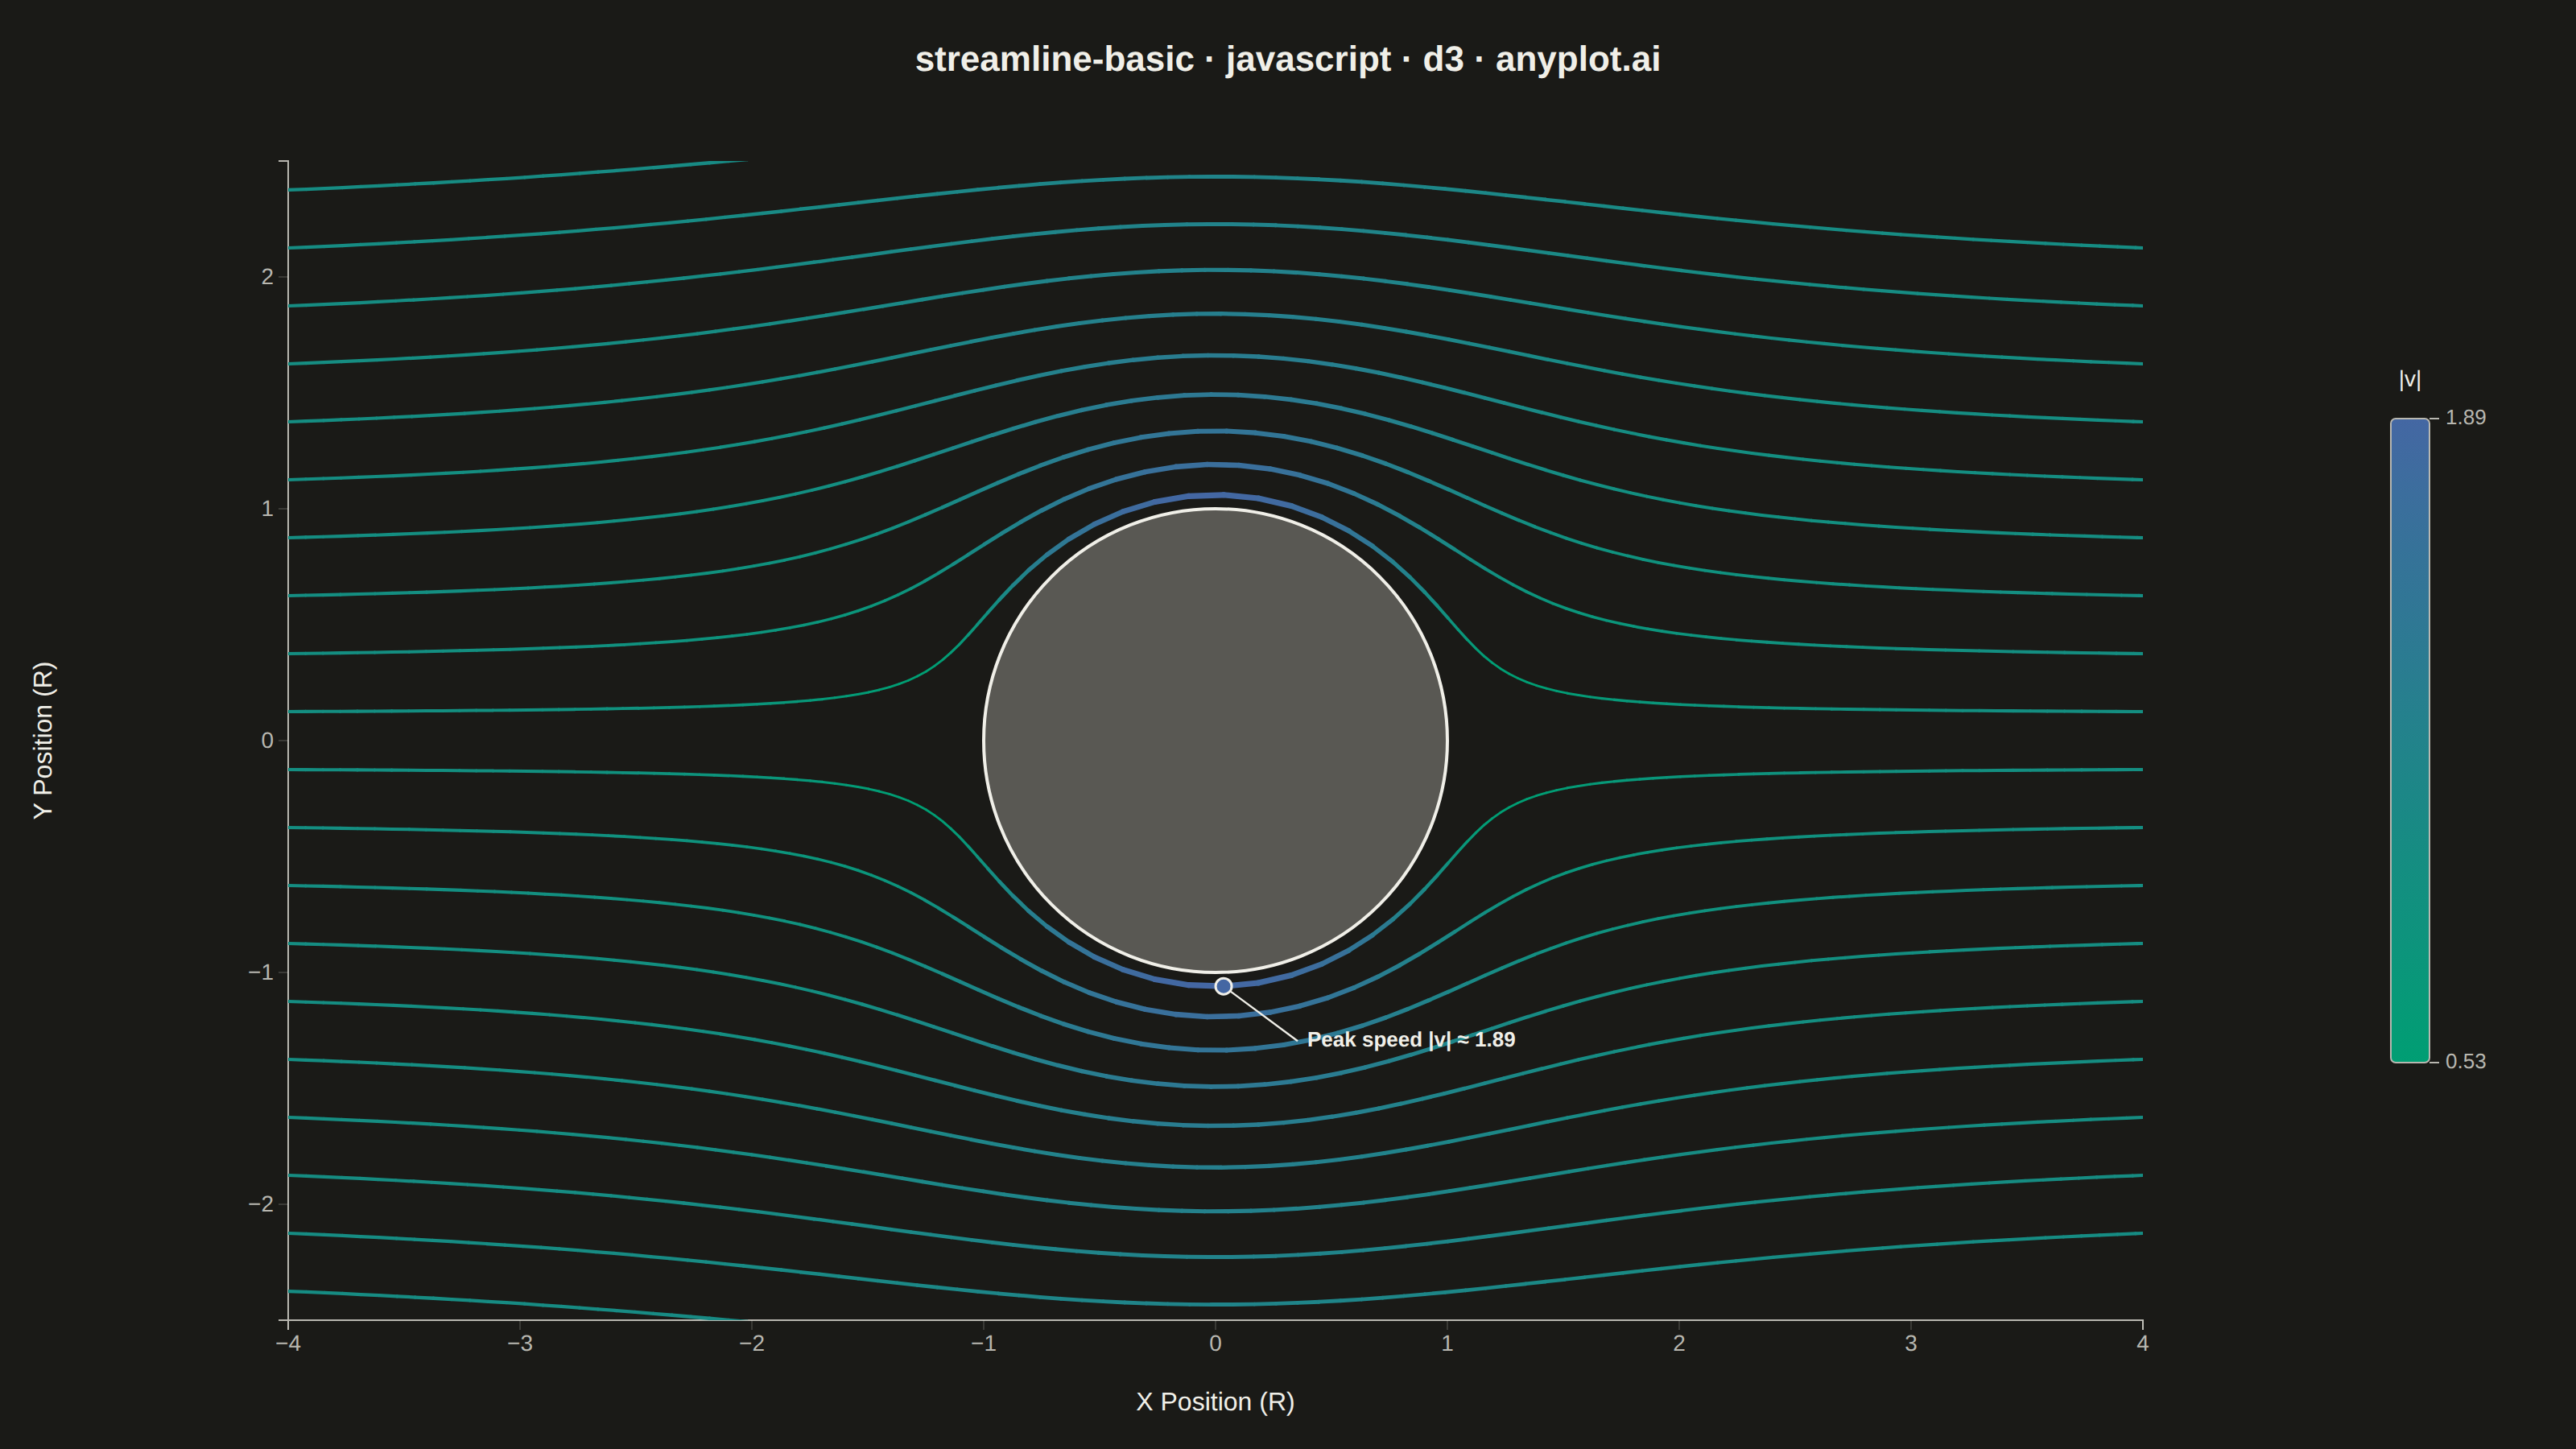
A streamline plot visualizes vector fields using smooth curves that are tangent to the field at every point. Unlike quiver plots that show discrete arrows, streamlines trace continuous paths through the field, revealing flow patterns, circulation, and field topology. This visualization is ideal for understanding fluid dynamics, electromagnetic fields, or gradient fields where the continuous nature of the flow is important.
// anyplot.ai
// streamline-basic: Basic Streamline Plot
// Library: d3 7.9.0 | JavaScript 22.23.2
// Quality: 93/100 | Created: 2026-09-09

const t = window.ANYPLOT_TOKENS;
const { width, height } = window.ANYPLOT_SIZE;

// --- Vector field: potential flow past a circular cylinder ------------------
// Uniform stream (speed U) plus a doublet of strength kappa placed at the
// origin. Their superposition is the classic textbook CFD demo: streamlines
// approach from the left, split around a circular obstacle of radius
// R = sqrt(kappa / U), and reconverge downstream.
const freeStreamSpeed = 1;
const doubletStrength = 1;
const cylinderRadius = Math.sqrt(doubletStrength / freeStreamSpeed);

const fieldAt = (x, y) => {
  const r2 = Math.max(x * x + y * y, 1e-6);
  const u = freeStreamSpeed + (doubletStrength * (y * y - x * x)) / (r2 * r2);
  const v = (-2 * doubletStrength * x * y) / (r2 * r2);
  return { u, v, speed: Math.sqrt(u * u + v * v) };
};

const rk4Step = (x, y, dt) => {
  const k1 = fieldAt(x, y);
  const k2 = fieldAt(x + (dt / 2) * k1.u, y + (dt / 2) * k1.v);
  const k3 = fieldAt(x + (dt / 2) * k2.u, y + (dt / 2) * k2.v);
  const k4 = fieldAt(x + dt * k3.u, y + dt * k3.v);
  return {
    x: x + (dt / 6) * (k1.u + 2 * k2.u + 2 * k3.u + k4.u),
    y: y + (dt / 6) * (k1.v + 2 * k2.v + 2 * k3.v + k4.v),
  };
};

// --- Trace streamlines from seeds along the left inflow edge ----------------
const domainX = [-4, 4];
const domainY = [-2.5, 2.5];
const stepSize = 0.08;
const maxSteps = 160;

const seedYs = d3.range(-2.375, 2.4, 0.25);
const streamlines = seedYs.map((y0) => {
  const points = [];
  let x = domainX[0];
  let y = y0;
  for (let i = 0; i < maxSteps; i += 1) {
    const r = Math.sqrt(x * x + y * y);
    if (r < cylinderRadius * 0.98) break;
    points.push({ x, y, speed: fieldAt(x, y).speed });
    if (x < domainX[0] - 0.1 || x > domainX[1] + 0.1 || y < domainY[0] - 0.1 || y > domainY[1] + 0.1) break;
    const next = rk4Step(x, y, stepSize);
    x = next.x;
    y = next.y;
  }
  return points;
});

const allSpeeds = streamlines.flat().map((p) => p.speed);
const speedExtent = d3.extent(allSpeeds);

// --- Scales -------------------------------------------------------------
const margin = { top: 100, right: 170, bottom: 80, left: 80 };
const iw = width - margin.left - margin.right;
const ih = height - margin.top - margin.bottom;

// Equal x/y pixel-per-unit so the cylinder renders as a true circle.
const pxPerUnit = ih / (domainY[1] - domainY[0]);
const plottedWidth = pxPerUnit * (domainX[1] - domainX[0]);
const offsetX = margin.left + (iw - plottedWidth) / 2;

const xScale = d3.scaleLinear().domain(domainX).range([offsetX, offsetX + plottedWidth]);
const yScale = d3.scaleLinear().domain(domainY).range([margin.top + ih, margin.top]);
const speedColor = d3.scaleSequential(d3.interpolateRgbBasis(t.seq)).domain(speedExtent);
const widthScale = d3.scaleLinear().domain(speedExtent).range([1.4, 3.6]).clamp(true);

// --- SVG mount ------------------------------------------------------------
const svg = d3.select("#container").append("svg").attr("width", width).attr("height", height);

// --- Axes -------------------------------------------------------------------
const xAxis = svg
  .append("g")
  .attr("transform", `translate(0,${margin.top + ih})`)
  .call(d3.axisBottom(xScale).ticks(8));
const yAxis = svg
  .append("g")
  .attr("transform", `translate(${offsetX},0)`)
  .call(d3.axisLeft(yScale).ticks(6));
for (const axis of [xAxis, yAxis]) {
  axis.selectAll("text").attr("fill", t.inkSoft).style("font-size", "14px");
  axis.selectAll("line").attr("stroke", t.grid);
  axis.select(".domain").attr("stroke", t.inkSoft);
}

svg
  .append("text")
  .attr("x", offsetX + plottedWidth / 2)
  .attr("y", margin.top + ih + 56)
  .attr("text-anchor", "middle")
  .attr("fill", t.ink)
  .style("font-size", "16px")
  .text("X Position (R)");

svg
  .append("text")
  .attr("transform", `translate(${margin.left - 48}, ${margin.top + ih / 2}) rotate(-90)`)
  .attr("text-anchor", "middle")
  .attr("fill", t.ink)
  .style("font-size", "16px")
  .text("Y Position (R)");

// --- Cylinder obstacle --------------------------------------------------
svg
  .append("circle")
  .attr("cx", xScale(0))
  .attr("cy", yScale(0))
  .attr("r", pxPerUnit * cylinderRadius)
  .attr("fill", t.inkSoft)
  .attr("fill-opacity", 0.4)
  .attr("stroke", t.ink)
  .attr("stroke-width", 2);

// --- Streamlines, colored + widened by local velocity magnitude -------------
const segments = streamlines.flatMap((points) =>
  points.slice(1).map((p1, i) => {
    const p0 = points[i];
    return { x1: p0.x, y1: p0.y, x2: p1.x, y2: p1.y, speed: (p0.speed + p1.speed) / 2 };
  }),
);

svg
  .append("defs")
  .append("clipPath")
  .attr("id", "plotClip")
  .append("rect")
  .attr("x", offsetX)
  .attr("y", margin.top)
  .attr("width", plottedWidth)
  .attr("height", ih);

svg
  .append("g")
  .attr("clip-path", "url(#plotClip)")
  .selectAll("line")
  .data(segments)
  .join("line")
  .attr("x1", (d) => xScale(d.x1))
  .attr("y1", (d) => yScale(d.y1))
  .attr("x2", (d) => xScale(d.x2))
  .attr("y2", (d) => yScale(d.y2))
  .attr("stroke", (d) => speedColor(d.speed))
  .attr("stroke-width", (d) => widthScale(d.speed))
  .attr("stroke-linecap", "round");

// --- Colorbar legend (velocity magnitude) ------------------------------
const legendWidth = 24;
const legendHeight = 400;
const legendX = width - margin.right + 55;
const legendY = margin.top + (ih - legendHeight) / 2;

const gradient = svg
  .append("defs")
  .append("linearGradient")
  .attr("id", "speedGradient")
  .attr("x1", "0")
  .attr("x2", "0")
  .attr("y1", "1")
  .attr("y2", "0");
d3.range(0, 1.001, 0.1).forEach((frac) => {
  gradient
    .append("stop")
    .attr("offset", `${frac * 100}%`)
    .attr("stop-color", speedColor(speedExtent[0] + frac * (speedExtent[1] - speedExtent[0])));
});

svg
  .append("rect")
  .attr("x", legendX)
  .attr("y", legendY)
  .attr("width", legendWidth)
  .attr("height", legendHeight)
  .attr("rx", 3)
  .attr("ry", 3)
  .attr("fill", "url(#speedGradient)")
  .attr("stroke", t.inkSoft)
  .attr("stroke-width", 1);

svg
  .append("text")
  .attr("x", legendX + legendWidth / 2)
  .attr("y", legendY - 20)
  .attr("text-anchor", "middle")
  .attr("fill", t.ink)
  .style("font-size", "14px")
  .text("|v|");

const legendTicks = [
  { y: legendY, value: speedExtent[1] },
  { y: legendY + legendHeight, value: speedExtent[0] },
];
for (const tick of legendTicks) {
  svg
    .append("line")
    .attr("x1", legendX + legendWidth)
    .attr("x2", legendX + legendWidth + 6)
    .attr("y1", tick.y)
    .attr("y2", tick.y)
    .attr("stroke", t.inkSoft)
    .attr("stroke-width", 1);
  svg
    .append("text")
    .attr("x", legendX + legendWidth + 10)
    .attr("y", tick.y)
    .attr("dominant-baseline", "middle")
    .attr("fill", t.inkSoft)
    .style("font-size", "13px")
    .text(tick.value.toFixed(2));
}

// --- Annotation: mark the peak-speed point at the cylinder's shoulder -------
const flatPoints = streamlines.flat();
const maxSpeedPoint = flatPoints.reduce((best, p) => (p.speed > best.speed ? p : best));
const maxPx = xScale(maxSpeedPoint.x);
const maxPy = yScale(maxSpeedPoint.y);
const labelDx = 46;
const labelDy = maxSpeedPoint.y >= 0 ? -34 : 34;

svg
  .append("line")
  .attr("x1", maxPx)
  .attr("y1", maxPy)
  .attr("x2", maxPx + labelDx)
  .attr("y2", maxPy + labelDy)
  .attr("stroke", t.ink)
  .attr("stroke-width", 1.2);

svg
  .append("circle")
  .attr("cx", maxPx)
  .attr("cy", maxPy)
  .attr("r", 5)
  .attr("fill", speedColor(maxSpeedPoint.speed))
  .attr("stroke", t.ink)
  .attr("stroke-width", 1.5);

svg
  .append("text")
  .attr("x", maxPx + labelDx + 6)
  .attr("y", maxPy + labelDy)
  .attr("dominant-baseline", "middle")
  .attr("fill", t.ink)
  .style("font-size", "13px")
  .style("font-weight", "600")
  .text(`Peak speed |v| ≈ ${maxSpeedPoint.speed.toFixed(2)}`);

// --- Title --------------------------------------------------------------
svg
  .append("text")
  .attr("x", width / 2)
  .attr("y", 44)
  .attr("text-anchor", "middle")
  .attr("fill", t.ink)
  .style("font-size", "22px")
  .style("font-weight", "600")
  .text("streamline-basic · javascript · d3 · anyplot.ai");
Runnable source as JSON, for any HTTP client: https://api.anyplot.ai/specs/streamline-basic/d3/code. Any spec id and library id listed in llms-full.txt fit the same URL shape; every URL below is complete and callable.
{
  "spec_id": "streamline-basic",
  "language": "javascript",
  "library": "d3",
  "page": "https://anyplot.ai/streamline-basic/javascript/d3",
  "hub": "https://anyplot.ai/streamline-basic",
  "code_json": "https://api.anyplot.ai/specs/streamline-basic/d3/code",
  "spec_json": "https://api.anyplot.ai/specs/streamline-basic",
  "render_light_png": "https://storage.googleapis.com/anyplot-images/plots/streamline-basic/javascript/d3/plot-light.png",
  "render_dark_png": "https://storage.googleapis.com/anyplot-images/plots/streamline-basic/javascript/d3/plot-dark.png",
  "interactive_light_html": "https://storage.googleapis.com/anyplot-images/plots/streamline-basic/javascript/d3/plot-light.html",
  "interactive_dark_html": "https://storage.googleapis.com/anyplot-images/plots/streamline-basic/javascript/d3/plot-dark.html",
  "quality_score": 93.0,
  "license": "MIT",
  "guide": "https://anyplot.ai/llms.txt"
}
Part of Basic Streamline Plot on anyplot.ai.